
 Open Access Article
 This Open Access Article is licensed under a
 Creative Commons Attribution 3.0 Unported Licence
Advantages of the polysaccharides from Gracilaria lemaneiformis over metformin in antidiabetic effects on streptozotocin-induced diabetic mice
Lingrong Wen†
ab,
Yunlin Zhang†ab,
Dongxiao Sun-Waterhouseab,
Lijun You *ab and
Xiong Fuab
*ab and
Xiong Fuab
aSchool of Food Science and Engineering, South China University of Technology, Guangzhou 510640, China. E-mail: feyoulijun@scut.edu.cn; Fax: +86-20-87113848; Tel: +86-20-87113848
bCenter of Guangdong Food Green Processing and Nutrition Regulation Engineering Technology, South China University of Technology, Guangzhou, Guangdong Province 510640, China
First published on 30th January 2017
Abstract
In the present study, polysaccharides from Gracilaria lemaneiformis (GLP) were obtained by citric acid extraction, and had a low molecular weight (21.2 kDa) with a high amount of galactose. GLP showed effective inhibitory effects on α-amylase activity. After a six-week animal trial, GLP was found to combat streptozotocin (STZ)-induced diabetes and associated with oxidative stress, via its regulation of glucose and lipid metabolism, repair of pancreatic β-cells, protection of liver and kidney function, promotion of the activities of endogenous antioxidant enzymes, and suppression of lipid peroxidation. A dose-dependent manner was found in these examinations except for the glucokinase level, superoxide dismutase activity, and malondialdehyde content. GLP treatments were also more effective at regulating the insulin level, lipidemic parameters and blood urea nitrogen level than metformin treatment. Thus, GLP is more advantageous than metformin not only in the naturalness of GLP but also in the action of combating STZ-induced diabetes. Accordingly, GLP may be utilized as a potential functional food supplement for diabetes prevention in the future.
Introduction
Diabetes mellitus (DM) is one of the rapidly growing chronic metabolic diseases worldwide with high rates of morbidity and mortality. The number of diabetic patients was 171 million in 2000 but will reach 366 million in 2030.1 DM is one of the major causes of renal disease, blindness and nontraumatic limb amputation.2 The risk of heart disease and stroke would be 2–4 times higher for the patients with diabetes. Diabetes is predicted to be the 7th leading cause of death in 2030.3Diabetes was defined as a state with carbohydrate and lipid metabolism disorders. It has been closely linked to elevated reactive oxygen species (ROS) and/or impaired antioxidant defense systems.4 The detrimental effects of diabetes were found largely mediated and complicated through oxidative stress.5 Insulin was once commonly used for DM, but repeated administration of insulin was then proven to have many adverse effects. Although various synthetic anti-diabetic drugs including hypoglycemic agents (e.g. biguanides and sulfonylureas) and biochemical drugs (e.g. insulin-like growth factor, aldose reductase inhibitor and protein glycation inhibitor), have been developed to combat diabetes. While their effectiveness is unsatisfactory, they also present undesired toxicity and side effects like hypoglycemia and lactic acid intoxication upon continuous uses. Thereby, the therapeutical strategies of diabetes were proposed to focus on the so-called “medicinal foods”. Nowadays, consumers are becoming more health-conscious and well engaged in the concept of “a healthy diet plus balanced lifestyle” thus increasingly driven to natural products with a standardized edible composition and pleasant attributes for consumption. This demand stimulates R&D professionals to seek alternative natural foods for counteracting diabetes. Plant-based materials or products enriched with various phytochemical constituents such as polysaccharides, phenolics and other antioxidants are highly desirable in this regard.6,7
Among the relevant bioactivities, polysaccharides have attracted high attention for diabetic control and clinical syndromes amelioration purposes.8 Marine-derived polysaccharides have already been found to possess health benefits such as cancer incidence-lowering, decrease of blood pressure and blood glucose, anti-inflammatory, immunomodulatory, neuroprotective and healthy gut-promoting effects.9 Gracilaria lemaneiformis, a red seaweed belonging to the family Gracilariaceae (Rhodophyta).10 Agarose and agaropectin were the major component of G. lemaneiformis, and their proportion varies with origin.11 Further, polysaccharides from Gracilaria lemaneiformis (GLP) have been found to possess various biological activities such as antioxidant, antimutagenic, anti-food allergic, antitumor and hypoglycemic effects.10–12 However, the effect of GLP on diabetes induced by streptozotocin (STZ) (a naturally occurring chemical to induce toxicity in the insulin-producing pancreatic β cells of mammals), have not been investigated and the underlying mechanisms remained unknown. Further, polysaccharides with good water solubility and relatively low molecular weight (MW) likely possess greater bioactivities.13 But the MW of GLP is very high. Liao et al.10 used ascorbic acid and hydrogen peroxide to degrade GLP after ethanolic precipitation. In this study, citric acid extraction, which had a positive influence on the polysaccharide degradation and antioxidant capacities,14 was employed to generate low MW GLP. The anti-diabetes effect was assessed using STZ-induced mouse model, based on hypoglycemic activity, biomarkers of carbohydrate and lipid metabolism, and activities of antioxidant enzymes.
Experimental
Chemicals and reagent kits
Ethanol, hydrochloric acid, citric acid, phenol and sulfuric acid were purchased from Guangzhou Reagent Co. (Guangzhou, China). Standards of xylose (Xyl), arabinose (Ara), glucose (Glc), galactose (Gal), fructose (Fru), mannose (Man), fucose (Fuc), galacturonic acid (GalA), inositol, metformin, α-amylase (from porcine pancreas, ≥10 units per mg solid) and dextrans (MW of 5.2, 11.6, 23.8, 48.6, 148, 273, 410, 668, 1400 kDa) were purchased from Sigma Chemical Company (St. Louis, MO, USA). Streptozotocin (STZ) was purchased from Shanghai Aladdin Biological Technology Co., LTD (Shanghai, China). Commercial test kits used for measuring total cholesterol (TC), triglyceride (TG), low-density lipoprotein cholesterol (LDL-C), high-density lipoprotein cholesterol (HDL-C), blood urea nitrogen (BUN), glucokinase (GCK), glucose-6-phosphatase (G-6-Pase), glucose-6-phosphate dehydrogenase (G-6-PD), aspartate aminotransferase (AST), alanine aminotransferase (ALT), superoxide dismutase (SOD), glutathione peroxidase (GSH-Px), and catalase (CAT), were purchased from Jiancheng Inst. of Biotechnology (Nanjing, China). All the other chemicals used were of analytical grade.Preparation of polysaccharides GLP
Dried G. lemaneiformis powder was first mixed with 95% ethanol (1![[thin space (1/6-em)]](https://www.rsc.org/images/entities/char_2009.gif) :30, m/v) at 70 °C for 2 h (maintained in a water bath) to separate the ethanol-soluble and ethanol-insoluble substances. Then the dried residue was extracted with 50-fold volumes (v/w) of citric acid solution (235.6 mM, pH = 2) at 100 °C for 2 h. The resultant mixture was centrifuged at 3500g for 15 min at 4 °C (Allegra X-15R, Beckman Coulter Co., Ltd., Brea, California, USA). The supernatant was collected and its pH was then adjusted to neutral using NaOH (2 M), before being concentrated in a rotary evaporator (Hei-VAP, Heidolph, Germany) under reduced pressure at 50 °C. The preliminarily concentrated extract was dialyzed against distilled water at 4 °C for 3 days in a dialysis tube (MW 1000 cut off) before the dialyzed residue was further concentrated to a proper volume. Then four volumes of anhydrous alcohol were added to the concentrated dialyzed residue to give a final concentration of 80% (v/v), and such a mixture was kept overnight at 4 °C. The resultant precipitate (crude GLP) was recovered through centrifugation (3500g, 4 °C, 20 min), then lyophilized (ALPHA, 1–2 LD plus, Marin Christ Co., Osterode, Germany) to yield the target GLP sample. Duplicate GPL samples were prepared in parallel following the same procedures.
:30, m/v) at 70 °C for 2 h (maintained in a water bath) to separate the ethanol-soluble and ethanol-insoluble substances. Then the dried residue was extracted with 50-fold volumes (v/w) of citric acid solution (235.6 mM, pH = 2) at 100 °C for 2 h. The resultant mixture was centrifuged at 3500g for 15 min at 4 °C (Allegra X-15R, Beckman Coulter Co., Ltd., Brea, California, USA). The supernatant was collected and its pH was then adjusted to neutral using NaOH (2 M), before being concentrated in a rotary evaporator (Hei-VAP, Heidolph, Germany) under reduced pressure at 50 °C. The preliminarily concentrated extract was dialyzed against distilled water at 4 °C for 3 days in a dialysis tube (MW 1000 cut off) before the dialyzed residue was further concentrated to a proper volume. Then four volumes of anhydrous alcohol were added to the concentrated dialyzed residue to give a final concentration of 80% (v/v), and such a mixture was kept overnight at 4 °C. The resultant precipitate (crude GLP) was recovered through centrifugation (3500g, 4 °C, 20 min), then lyophilized (ALPHA, 1–2 LD plus, Marin Christ Co., Osterode, Germany) to yield the target GLP sample. Duplicate GPL samples were prepared in parallel following the same procedures.
Chemical composition and molecular weight of GLP
Total sugar content of GLP was determined following the phenolic-sulfuric acid method with D-glucose as the standard compound.15 The uronic acid content of GLP was measured according to a previously published method with galacturonic acid as the standard compound.16 The sulfate content was determined after acid hydrolysis of the polysaccharides, according to the gelatin–barium/barium chloride–gelatin method, using potassium sulfate as the standard.17 The neutral monosaccharide composition and molecular weight were determined as described previously.18Fourier transform infrared (FT-IR) analysis of GLP was performed using a IR spectrophotometer (Bruker Co., Ettlingen, Germany). The polysaccharides were ground with spectroscopic grade potassium bromide (KBr) power and then pressed into pellets (1 mm) for FTIR measurement in the wavenumber range of 400–4000 cm−1.19
Inhibitory effects of GLP on α-amylase activity
The α-amylase activity was determined as reported by Apostolidis et al.,20 and acarbose was used as positive control. The inhibitory effect was expressed as half maximal inhibitory concentration (IC50).Animal treatment and diabetes induction
Normal Kunming mice (male, weighing 25–28 g, aged 4–5 weeks) were obtained from Experimental Animal Center, Guangdong Pharmaceutical University, Guangdong, China. All experimental procedures were approved by the Animal Management Committee and the Animal Ethics Committee of Experimental Animal Center, Guangdong Pharmaceutical University, and carried out in accordance with “Principles of Laboratory Animal Care and Use in Research” (State Council of China, 1988). The breeding of mice and induction of diabetes using STZ were performed as described by Liu et al.21 The mice were divided into 6 groups (12 mice per group): NC (the normal mice as control); DC (the STZ-induced diabetic control group without any GLP or metformin drug treatment, negative control); PC (the STZ-induced diabetic control group with a metformin drug treatment (300 mg per kg body weight per day), positive control); GLP-L (the STZ-induced diabetic mice with a low dose GLP treatment only: at a dose of 60 mg per kg body weight per day via oral administration using a lavage needle); GLP-M (the STZ-induced diabetic mice with a medium dose GLP treatment only: 120 mg per kg body weight per day); GLP-H (the STZ-induced diabetic mice with a high dose GLP treatment only: 225 mg per kg body weight per day). The animals with a GLP treatment received the same volume of GLP solution at the above-mentioned concentration, while the mice in the NC and DC groups received the same volume of vehicle solution (distilled water). The GLP or metformin drug treatment, and the equivalent vehicle solution supply was provided separately on the basis of “once a day” at noon. During the experimental period, the body weight, diet consumption, water intake, animal behaviors and urine production were recorded on a daily basis.Upon the completion of the 6 week treatment, all the mice were fasted for 12 h at staggered times although free access to water was still allowed. Mice were anesthetized with chloral hydrate (400 mg kg−1 body weight), and the blood samples were collected from the orbital sinus, and centrifuged immediately for 5 min at 14000g at 4 °C to obtain serum for biochemical analysis. Additionally, the whole blood samples were collected using sodium citrate as the anticoagulant. Mice were then sacrificed by cervical dislocation, and the liver and kidney were then sampled after necropsy and then stored at −80 °C, as well as the obtained serum.
Determination of fasting blood glucose level and oral glucose tolerance
The FBG level of all the animal groups was determined weekly from the 2nd week after the GLP treatment and expressed as millimole per liter of blood (mmol L−1). Tail vein blood was collected and its glucose level was measured using blood glucose test strips.Oral glucose tolerance test (OGTT) was carried out on the last day of the diabetic trial. The mice were fasted for 12 h and then orally administered with glucose (2.0 g kg−1 body weight). The glucose level of the blood drops obtained through clipping the mouse tail was measured upon (time zero) and after glucose administration for 30, 60 and 120 min, respectively using a glucose assay kit (Jiancheng Inst. of Biotechnology, Nanjing, China).
Measurement of liver and kidney indexes
Upon the end of animal trial, the livers and kidneys samples were collected under anaesthetized conditions to calculated the liver and kidney indexes (liver or kidney weight as a percentage of body weight), respectively.Biochemical analyses of the serum samples
The content of TC, TGs, HDL-c, LDL-c, BUN, and C-peptide, as well as the activities of aspartate aminotransferase (AST) and alanine aminotransferase (ALT) in serum were measured using commercially available assay kits.Determination of liver glycogen and carbohydrate-metabolizing enzymes activities
The liver samples, which had removed visible fat and connective tissue previously, were cut into small pieces with a pair of stainless steel scissors and homogenized (1:10, w/v) immediately in cold physiological saline (4 °C). The supernatants were collected for biochemical analyses after centrifugation (14000g, 4 °C, 10 min). The glycogen levels were measured using the anthracenone method. The GCK and G-6-Pase activities of the liver tissue, as well as the G-6-PD activity of the whole blood, were determined using corresponding commercial kits. The G-6-PD activity was expressed as the percentage of methemoglobin reduction.
Determination of antioxidant enzymes activities and the MDA content
The SOD activity and the MDA content of the serum, and the activities of GSH-Px and CAT in the liver were determined using the corresponding commercial diagnostic kits according to the instructions.Statistical analysis
Statistical analyses were performed using SPSS software 21.0 (IBM Corporation, New York, USA). Data were subjected to one-way analysis of variance (ANOVA), and differences between means were assessed using the Tukey's multiple comparison test and p < 0.05 was regarded as “significant”.Results and discussion
Characteristics of the polysaccharides from Gracilaria lemaneiformis (GLP)
The recovery of GLP prepared by citric acid extraction was 17.81 ± 0.34% of the starting Gracilaria lemaneiformis raw material on a dry mass basis, significantly higher than that of GLP from hot water extraction (100 °C, 2 h, 14.87 ± 0.18%). The contents of total sugar, uronic acid and sulfate content were 66.68, 33.92 and 19.64%, respectively, of the crude polysaccharides (Table 1). The neutral monosaccharides in GLP likely included rhamnose, arabinose, xylose, mannose, glucose and galactose with a molar ratio was 1.66:0.50:1.00:0.20:1.50:3.80 (Table 1). The MW of the GLP obtained in the present study was 21.2 kDa.
| Total sugar (%) | Uronic acids (%) | Sulfate (%) | MW (×104 Da) | Neutral sugar (mole ratio) | |||||
|---|---|---|---|---|---|---|---|---|---|
| Rha | Ara | Xyl | Man | Glc | Gal | ||||
| 66.68 ± 1.78 | 33.92 ± 0.22 | 19.64 ± 1.0 | 2.12 | 1.66 | 0.50 | 1.00 | 0.20 | 1.50 | 3.80 |
The FT-IR spectrum of GLP exhibited a typical spectrum of polysaccharides with the peaks around 3470 and 2950 cm−1 corresponding to stretching vibrations of O–H and C–H, respectively (Fig. 1). The signal at 1655 cm−1 corresponds to bending vibration of N–H–C–O, while this broad band may also result from the bound water.22 The signals at 1080, 1050 and 934 cm−1 were likely associated with the glycosidic linkage C–O–H and C–O–C stretching vibration, in particular, the signal at 934 cm−1 was assigned to the C–O vibration of 3,6-anhydro-L-galactose.10,23 The characteristic absorption peak around 1270 cm−1 corresponds to asymmetric stretching vibration of S![[double bond, length as m-dash]](https://www.rsc.org/images/entities/char_e001.gif) O in the sulfate groups. The signals around 800–850 cm−1 assigned to C–O–S bond stretching can infer the position of sulfate group in the polysaccharides.24 The peak at 850 cm−1 was attributed to the sulfate substitution at C-4 of galactose residues.25 The absence of the absorption signal around 820 cm−1 suggests the absence of 6-sulfate of D-galactose units. The low intensity of the signal at 807 cm−1 indicated that the weak presence of 2-sulfate galactose and the sulfate on the C-2 of 3,6-anhydro-L-galactose.26
O in the sulfate groups. The signals around 800–850 cm−1 assigned to C–O–S bond stretching can infer the position of sulfate group in the polysaccharides.24 The peak at 850 cm−1 was attributed to the sulfate substitution at C-4 of galactose residues.25 The absence of the absorption signal around 820 cm−1 suggests the absence of 6-sulfate of D-galactose units. The low intensity of the signal at 807 cm−1 indicated that the weak presence of 2-sulfate galactose and the sulfate on the C-2 of 3,6-anhydro-L-galactose.26
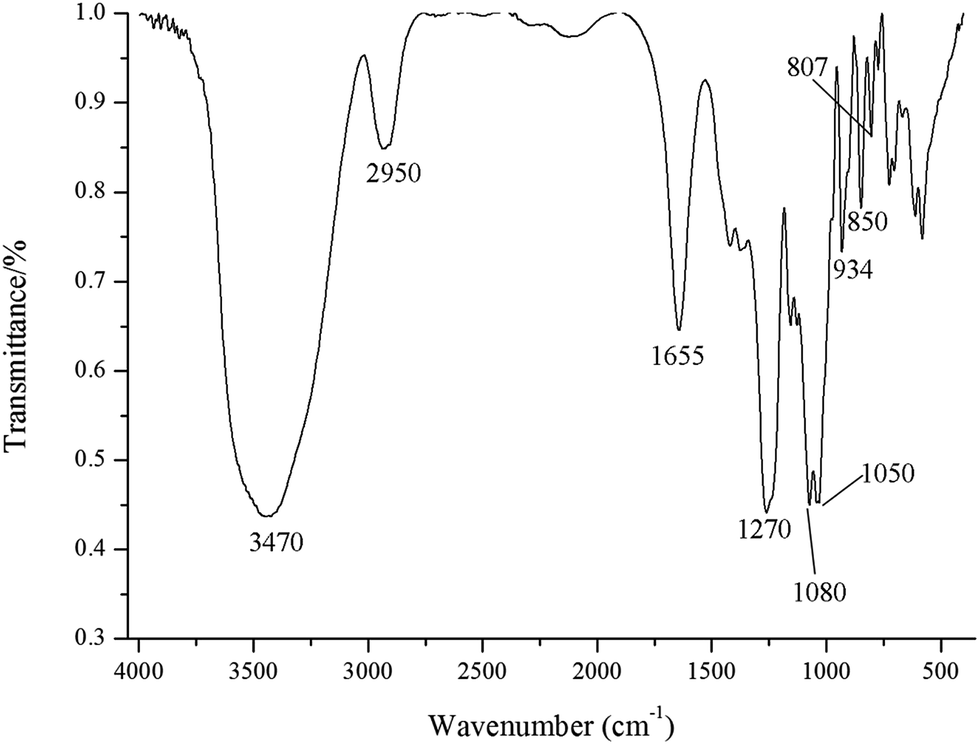 | ||
| Fig. 1 FT-IR spectra in KBr pellets of G. lemaneiformis polysaccharides. | ||
The molecular weight and viscosity of algae polysaccharides plays an important role in their physiological activity.10 Citric acid extraction was an effective way to produce polysaccharides with lower MW and viscosity.14 In this study, the MW of GLP was only 21.2 kDa, which was significantly (p < 0.05) lower than that of the polysaccharides produced via hot water extraction (e.g. 1571 kDa). The viscosity of the GLP produced in this study (0.89 mPa s) was more than 40 times lower than that of the GLP produced via hot water extraction (38.67 mPa s). A low MW of polysaccharide was found to be associated positively with their biological functions, e.g. laminarin with a low MW led to enhanced antioxidant activity.27 A previous study reported that a GLP degradation product with a lower MW (57.02 kDa) (termed as GLP1 and obtained through ascorbic acid and hydrogen peroxide (H2O2) treatments on GLP) had a greater hypoglycemic effect than the initial GLP (MW, 121.89 kDa).10 Thus, citric acid extraction could be an appropriate method to generate functional polysaccharides from plants.
In this study, the monosaccharide that had the highest amount in the GLP was galactose. Previous studies already indicated an acid polysaccharides from Gracilaria lemaneiformis with a 6.13% of sulfate content, the major monosaccharide galactose as well as a small amount of rhamnose, arabinose, xylose and mannose expect for glucose.11 Moreover, a sulfated polysaccharide isolated from Gracilaria lemaneiformis showed significantly higher MW (152.5 kDa) and galactose content (87.49%), but lower sulfate content (11.26%), compared to our results.12 These differences might be due to various factors, including the different extraction methods and/or different geographical origins of the materials used in the experiment.
Inhibitory effect of GLP on the activity of α-amylase
The results showed that GLP possessed effective inhibitory effect on the activity of α-amylase with IC50 value of 3.94 ± 0.3 μg mL−1, which was significantly lower than that of acarbose (22.94 ± 0.0.89 μg mL−1), a common drug for diabetes patients. Present study indicated that GLP was a potent amylase inhibitor, which was known as starch blockers due to its ability that prevent dietary starch from being absorbed by the body.20 GLP also showed comparable or greater inhibitory effect to the α-glucosidase than acarbose.10 Both α-glucosidase and α-amylase inhibitors, whose activity was centered in helping to keep blood sugar levels within a controlling range, were effectively contribute to type 2 diabetes management.20,28 All these results indicated that GLP showed potential to help managing diabetes.Effect of GLP on the fasting blood glucose levels and oral glucose tolerance
The FBG levels of all the mice subjected to STZ injection including DC, PC and all the GLP-treated groups were remarkably higher than that of the normal mice (NC group, p < 0.05) throughout the diabetic trial (including the last day, day 42, Table 2). There was no significant difference in the FBG level among these STZ-treated groups on day 0 (at the start of the diabetic trial). The FBG level of the NC group appeared to be almost the same throughout the trial. A significant increase (p < 0.05) in the FBG level of the DC group, compared to that of day 0, was detected on any analysis day (day 14, day 21, day 28, day 35 or day 42), suggesting that the absence of metformin drug or GLP treatment following STZ injection would result in elevation of blood glucose. However, the administration of metformin drug or GLP would combat the elevation of FBG caused by STZ injection to different extent. The FBG-lowering effect of metformin treatment as compared to day 0 (either the DC or PC group) started to take place around day 28, and became more obvious and significant after 6 weeks (on day 42). The FBG-lowering effect of GLP administration increased with an elevated dose of GLP, while the current low dose of GLP was proven to have no FBG-lowering effect compared with the DC group. Thus, GLP-supplementation at the current medium or high dose could slightly ameliorate the increase of FBG induced by STZ injection, although the current GLP treatments didn't show advantage over the present metformin treatment.| Group | Fasting blood glucose level (mmol L−1) | |||||
|---|---|---|---|---|---|---|
| 0 day | 14 day | 21 day | 28 day | 35 day | 42 day | |
| a NC, DC, PC, GLP-L, GLP-M and GLP-H refer to normal control, negative control, positive control, low dose GLP treatment, medium dose GLP treatment, and high dose GLP treatment, respectively. Different superscript letters indicate that values in the same column are significantly different (p < 0.05). | ||||||
| NC | 6.36 ± 0.98b | 6.05 ± 1.09c | 5.98 ± 0.97b | 6.21 ± 0.98c | 6.13 ± 1.21c | 5.96 ± 0.99c |
| DC | 23.90 ± 6.36a | 27.99 ± 5.68a | 31.62 ± 3.69a | 31.75 ± 3.59a | 30.57 ± 5.12a | 29.59 ± 4.17a |
| PC | 23.97 ± 6.22a | 27.97 ± 7.19a | 25.75 ± 6.33a | 23.55 ± 5.71b | 23.62 ± 5.35b | 21.48 ± 4.23b |
| GLP-L | 24.42 ± 5.44a | 28.91 ± 3.91a | 30.45 ± 3.03a | 27.95 ± 2.62a | 29.68 ± 3.79a | 29.83 ± 4.34a |
| GLP-M | 24.40 ± 5.42a | 27.51 ± 5.38a | 29.32 ± 3.98a | 27.63 ± 4.19a | 26.39 ± 5.14a | 23.15 ± 6.88ab |
| GLP-H | 24.28 ± 5.45a | 24.29 ± 5.99b | 32.49 ± 2.45a | 27.65 ± 2.51a | 24.46 ± 3.98b | 22.31 ± 4.44b |
After 6 weeks of metformin or GLP treatment, glucose tolerance was evaluated and the mice subject to STZ injection (including DC, PC and all the GLP-diabetic treated groups) exhibited apparently different hyperglycemic response to oral glucose administration compared to the NC group (Fig. 2). All the blood glucose-time plots for the 6 groups of mice exhibited a peak value a peak value at the 30th min after glucose loading, although only the NC group showed an obvious turning point at the 60th min due to a sharp change in the decreasing rate of blood glucose before reaching the normal level at the 120th min. A suppression effect on the blood glucose level persisted until the blood glucose level reached the initial level. The blood glucose level in response to the GLP or metformin treatment decreased in the order of GLP-L > GLP-M and metformin > GLP-H treated groups, indicating that the higher dose GLP-treated mice had more potent glucose tolerance than that of the lower dose-treated mice. The current high dose of GLP led to a greater fall of blood glucose in comparison with metformin treatment, thus the GLP-H was the best treatment in this study considering glucose response.
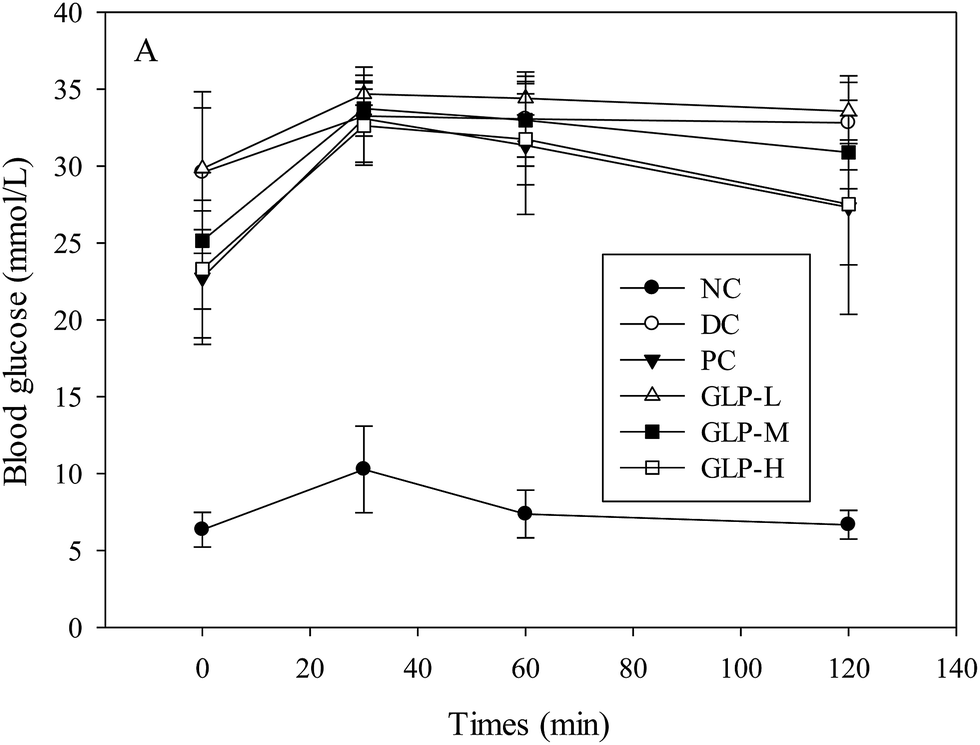 | ||
| Fig. 2 Effect of polysaccharides from G. lemaneiformis on oral glucose tolerance in STZ-induced diabetic mice using OGTT. NC, DC, PC, GLP-L, GLP-M and GLP-H refer to normal control, negative control, positive control, low dose GLP treatment, medium dose GLP treatment, and high dose GLP treatment, respectively. | ||
Higher fasting blood glucose levels were found in diabetes due to dysfunction of β-cells. Streptozotocin (STZ), one of the most common substances to induce diabetes in animal model, could be taken up by pancreatic β-cells and then induce the death of β-cells through alkylating DNA damage and production of NO, exhibiting diabetes symptoms such as hyperglycemia and glucose intolerance.29 In the present study, the FBG levels of the STZ-induced diabetic mice significantly increased by 375% as compared to the normal mice (p < 0.05). The blood glucose level was reduced by 5.57–29.37% upon a GLP treatment, in comparison with the untreated diabetic group (DC group) after 6 weeks of treatment. A previously published study reported a more remarkable hypoglycemic effect (compared to this study), where the GLP prepared using different procedure had a more potent anti-diabetes effect and could reduce FBG from 18.85 to 10.12 mmol L−1 within 21 days in an alloxan-induced diabetic mice model.10 The differences in the FBG-lowering effect between the previous and current studies resulted from the differences in the animal model used and the GLP preparation method. The major mechanism of the action of alloxan and streptozotocin in β-cells of pancreas was different.30 Moreover, glucose can inhibit the diabetogenic effect of alloxan through the interaction of sugar and GLUT2, but exerts little impact on STZ-induced diabetic actions. Apparently, the differences between the two studies in the GLP preparation methods directly caused differences in characteristics such as MW, sugar composition and sulfate group etc. So the difference might due to the distinction of GLP structure as well. The previous study employed ethanolic precipitation followed by polysaccharide degradation using ascorbic acid and hydrogen peroxide, whilst the present study used ethanolic precipitation followed by citric acid extraction.
Polysaccharides were potential functional food supplement for diabetes prevention. A heteropolysaccharide with a molecular weight of 15 kDa was found to have hypoglycemic, and hypolipidemic activities on the streptozotocin-induced diabetic mouse, and the FBG level was reduced by 48.58% after polysaccharides treatment (100 mg per kg per day), in comparison with the diabetic control.31 Polysaccharide fraction from Opuntia dillenii Haw. fruits (200 mg per kg per day) could significantly decrease FBG level by 34.4% using streptozotocin-induced diabetic mouse model, compared with diabetic control rats.32 These results might imply that the hypoglycemic effect of GLP was weaker than that of these polysaccharides. However, GLP showed comparable antidiabetic effect than a polysaccharide from Ganoderma atrum, which showed significantly antidiabetic effect on high fat diet- and streptozotocin-induced type 2 diabetic rats as oral administration of this polysaccharide at 200 mg kg−1 body weight significantly reduced FBG level by about 30.37%.33
Effect of GLP on glycometabolism
As described earlier, STZ could induce glucose metabolism disorder in the experimental mice. GLP treatment could likely combat this dysfunction, as the administration of GLP suppressed the STZ-induced decrease of the levels of blood C-peptide, GCK, G-6-PD and liver glycogen and lowered the STZ-induced increase of the G-6-Pase level (Table 3). Such effects of GLP administration generally became more potent when the dose of GLP was increased, with the GLP-H exerting comparable or greater desirable effects than the metformin treatment. The activity of G-6-PD of DC group mice were significantly reduced by 73.19% due to the STZ injection, in comparison with the NC group mice (p < 0.05). However, the metformin treatment resulted in a large increase (191.55%) in the activity of G-6-PD when the PC group mice are compared to the DC group mice. Similarly, a significant increase (p < 0.05; from 132.4 to 186.0%) in the activity of G-6-PD was observed in the mice with a GLP supplement. The balance of glucose utilization and production are monitored by insulin and glucagon hormones. Insulin stimulates glucose uptake, utilization and storage while suppressing hepatic glucose production and consequently reducing the plasma glucose level. Glucagon promotes the release of the stored glucose and facilitates the newly synthesized glucose into the bloodstream.2 The level of C-peptide corresponds to insulin secretion (at a 1:1 molar ratio) thus represents a direct measure of endogenous insulin secretion.34 In this study, the level of C-peptide of the DC was significantly lower than that of the NC mice, suggesting that the STZ-induced diabetic mice suffered insulin dysfunction due to the destruction of pancreatic β-cells caused by STZ. The increase (26.41–35.15%) of the C-peptide level upon GLP treatments, compared to 13.27% increase for metformin supplement, suggests that the FBG-lowering effect of GLP might take place through ameliorating insulin secretion deficiency. Such a finding further supports the notion that insulin play an important role in monitoring the level of blood glucose.
| Group | C-Peptide (pg mL−1) | GCK (μg g−1) | G-6-Pase (μg g−1) | G-6-PD (%) | LHG (mg g−1) |
|---|---|---|---|---|---|
| a NC, DC, PC, GLP-L, GLP-M, GLP-H, GCK, G-6-Pase, G-6-PD, and LHG refer to normal control, negative control, positive control, low dose GLP treatment, medium dose GLP treatment, high dose GLP treatment, glucokinase, glucose-6-phosphatase, glucose-6-phosphate dehydrogenase, and the levels of hepatic glycogen, respectively. Different superscript letters indicate that values in the same column are significantly different (p < 0.05). | |||||
| NC | 39.05 ± 4.82a | 3.41 ± 0.19ac | 1.22 ± 0.12b | 75.90 ± 2.26a | 34.60 ± 2.93c |
| DC | 30.44 ± 3.89c | 2.96 ± 0.13d | 1.46 ± 0.1a | 20.35 ± 3.15d | 12.98 ± 2.13e |
| PC | 33.83 ± 5.88b | 3.28 ± 0.13c | 1.28 ± 0.08b | 59.33 ± 2.61b | 42.47 ± 3.68a |
| GLP-L | 38.62 ± 5.64a | 3.52 ± 0.22ab | 1.30 ± 0.15b | 47.30 ± 3.16c | 27.65 ± 3.75d |
| GLP-M | 38.48 ± 5.08a | 3.36 ± 0.19bc | 1.31 ± 0.13b | 48.39 ± 2.05c | 34.13 ± 2.67c |
| GLP-H | 41.14 ± 4.54a | 3.51 ± 0.09a | 1.23 ± 0.11b | 58.20 ± 2.93b | 37.29 ± 3.7b |
For the type 2 diabetic patients, glycogen storage is typically diminished due to decreased glucose uptake, insulin secretion deficiency and insulin resistance. In this study, the level of glycogen in the DC group (untreated diabetic mice) was significantly lower than (about 1/3 as much as) that in the normal mice, indicating unbalance between glycogen synthesis and glycogenolysis due to insulin secretion deficiency induced by STZ. However, the GLP treatment combat the decline of glycogen storage in a dose-dependent manner (GLP-M and GLP-H enabled the level of hepatic glycogen to recover to the same level or slightly higher level, respectively, compared to the normal group). G-6-PD and G-6-Pase are well known to be involved in the process of sugar metabolism, and GCK is also closely associated with blood glucose homeostasis (i.e. the rates of glucose uptake and glycogen synthesis and storage).35,36 The decrease of the GCK and G-6-PD activities with an increase of the G-6-Pase activity in the DC mice, as well as the reversed changes upon the GLP treatment for 6 weeks, further demonstrated the impact of GLP administration on the process of sugar metabolism. An increase in gluconeogenesis was possible for the STZ-induced diabetic mice of this study, as a remarkably increased G-6-Pase activity was observed. Previous studies already reported the same findings because of the roles of G-6-Pase in gluconeogenesis.37 A significant increase in GCK and a significant decrease in G-6-Pase in the GLP treatment groups were observed, suggesting that GLP could transfer more blood glucose into the liver by activating the glycolytic pathway and suppressing the gluconeogenic pathway.38 All these results suggested that the insulin-like activity of GLP, which might be able to regulate the expression of the enzymes involved in the carbohydrate metabolism, was the plausible explanation for its antidiabetic effect.
Hypolipidemic effect of GLP in STZ-induced diabetic mice
The STZ injection and subsequent metformin or GLP treatments influenced the levels of TC, TG, HDL-c and LDL-c (Table 4). The DC group exhibited significantly (p < 0.05) higher levels of TC, TG and LDL-c but a lower HDL-c level, indicating the undesired effects brought by the STZ injection. Both metformin and GLP treatments were able to ameliorate such undesired an impact. For the GLP treated groups, the levels of TC, TG and LDL-c were reduced by 17–32%, 47–59% and 20–44%, respectively, while the HDL-c level was increased by 44–47%. GLP treatments were generally more effective at monitoring these parameters than metformin, except for LDL-c upon GLP-L or GLP-M administration.| Group | TG | TC | LDL-c | HDL-c | HDL-c/TC |
|---|---|---|---|---|---|
| a NC, DC, PC, GLP-L, GLP-M, GLP-H, TC, TG, LDL-c, HDL-c, HDL-c/TC and BUN refer to normal control, negative control, positive control, low dose GLP treatment, medium dose GLP treatment, high dose GLP treatment, total cholesterol, triglyceride, low-density lipoprotein cholesterol, high-density lipoprotein cholesterol, the rate of high-density lipoprotein cholesterol to total cholesterol, and blood urea nitrogen, respectively. Different superscript letters indicate that values in the same column are significantly different (p < 0.05). | |||||
| NC | 0.62 ± 0.09c | 3.16 ± 0.51b | 0.27 ± 0.05cd | 8.89 ± 2.26b | 2.81 |
| DC | 1.29 ± 0.42a | 4.01 ± 0.73a | 0.43 ± 0.15a | 5.89 ± 1.15a | 1.47 |
| PC | 1.19 ± 0.51b | 3.38 ± 0.64b | 0.26 ± 0.08d | 5.26 ± 1.42a | 1.56 |
| GLP-L | 0.68 ± 0.33c | 3.10 ± 0.46b | 0.32 ± 0.08bc | 8.70 ± 1.86b | 2.81 |
| GLP-M | 0.52 ± 0.18d | 3.29 ± 0.49b | 0.34 ± 0.09b | 8.49 ± 2.0b | 2.58 |
| GLP-H | 0.53 ± 0.19d | 2.70 ± 0.45c | 0.24 ± 0.08d | 8.55 ± 1.81b | 3.17 |
Lipids play a critical role in the pathogenesis of DM, and hypertriglyceridemia and hypercholesterolemia were the most common lipid abnormalities found in diabetes.39 The undesired elevation of the serum lipids observed in the DC group of this study indicated the lipid abnormalities induced by STZ. The protect effect of phytochemicals on type 2 diabetes were related to its hypolipidemic effect.40 The cholesterol-lowering effect of GLP was possibly due to the ability of GLP to bind to bile acids within the intestine thus increasing bile acid excretion and decreasing the cholesterol absorption from the intestine.41 The HDL-c/TC value is one of the most useful independent factors for assessing the risk of coronary artery disease.40 In the present study, the HDL-c/TC values of the six groups of mice varied from 1.47 to 3.17 with the lowest occurring in the DC group, suggesting that the STZ-induced diabetes could trigger coronary artery disease. GLP treatments seemed to reduce the atherogenic risk as the HDL-c/TC values were higher than that of the DC group. Thus, GLP might be used for suppressing hypertriglyceridemia and hypercholesterolemia as part of the anti-diabetic treatment.
Effects of GLP on liver index and liver function
Previous study indicated that DM induced liver damage or impaired liver function including nonalcoholic fatty liver disease, steatohepatitis, and liver cirrhosis.42 As showed in Fig. 3A, liver index showed a significant increase in the DC group compared to the NC group (p < 0.05), suggesting liver steatosis and/or nonalcoholic fatty liver disease was present in the diabetes mice, in agreement with previous report.43 However, in GLP and metformin treatment groups, the liver index significantly decreased as compared to the DC group (p < 0.05). These results indicated that liver steatosis and/or nonalcoholic fatty liver disease was alleviated by GLP. Moreover, the activities of AST and ALT are two reliable biomarkers to evaluate the liver function. Liver was found be necrotized in STZ-induced diabetic rats, and an increase in the activities of AST and ALT were observed.44 Mice in the DC group showed significantly increased activities of AST (about 3-fold, Fig. 3B) and ALT (about 7-fold, Fig. 3C). However, treatment with metformin resulted in a significant decrease in the activities of AST and ALT compared to the DC group (p < 0.05). Similarly, GLP treatment (all dose) caused reduction in the activities of AST and ALT, in a dose-dependent manner. These results suggesting that treatment with GLP may improve liver function in diabetic mice, which was concordant with previous study that polysaccharide could effectively protect liver against necrosis induced by STZ.43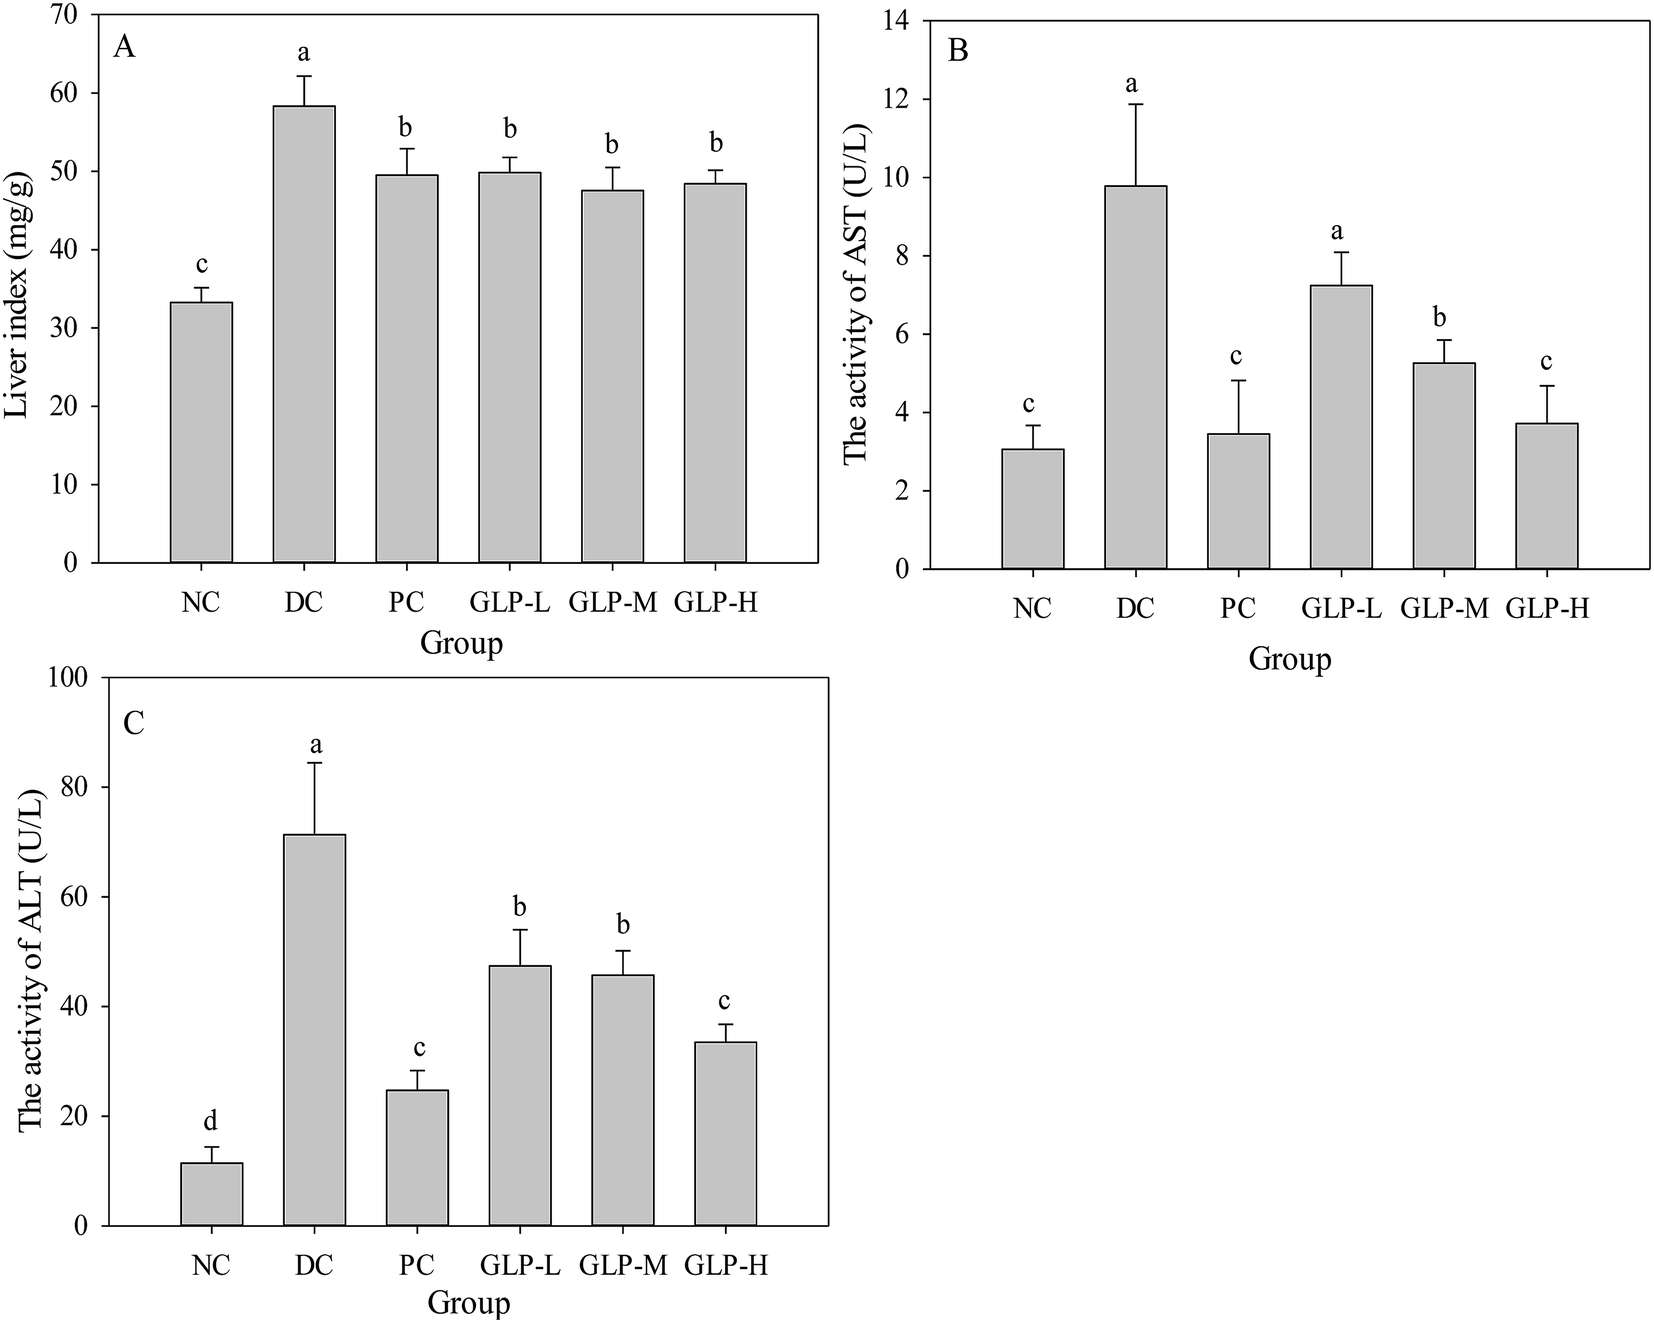 | ||
| Fig. 3 Effect of GLP polysaccharides from G. lemaneiformis on the liver index and liver function in STZ-induced diabetes mice at the end of the administration period. (A) Effect of GLP on the liver index; (B) effect of GLP on the activity of AST in serum; (C) effect of GLP on the activity of ALT in serum. NC, DC, PC, GLP-L, GLP-M and GLP-H refer to normal control, negative control, positive control, low dose GLP treatment, medium dose GLP treatment, and high dose GLP treatment, respectively (values with no letter in common indicate significant differences (p < 0.05)). | ||
Effects of GLP on kidney index and the blood urea nitrogen (BUN) in serum
A significantly increased level of kidney index was observed in the DC group compared to the NC group (Fig. 4A, p < 0.05), suggesting kidney steatosis was induced by STZ injection. However, this increase was reversed after metformin and GLP treatment, suggesting the protective effect of GLP on kidney. Moreover, an increased BUN in blood results from a high protein diet, reduced glomerular filtration rate (renal failure), congestive heart failure, gastrointestinal hemorrhage, or even fever.45 In this study, the serum BUN levels of the DC group were significantly higher (p < 0.05) than that of the normal mice (Fig. 4B), indicating a higher level of blood urea (55.90% higher) induced by STZ injection. However, the level of BUN remarkably decreased by 21.25, 27.28 and 35.29%, respectively, after the GLP-L, GLP-M or GLP-H administration. The metformin treatment could significantly lower the BUN level as well (more effective than GLP-L and GLKP-M but slightly less potent than GLP-H). An elevation of the urea level was believed to associated with renal dysfunction, a symptom caused by diabetic hyperglycemia.46 Thus, the GLP or metformin treatment on the diabetic mice might combat the impaired kidney function as well as other diabetic symptoms.10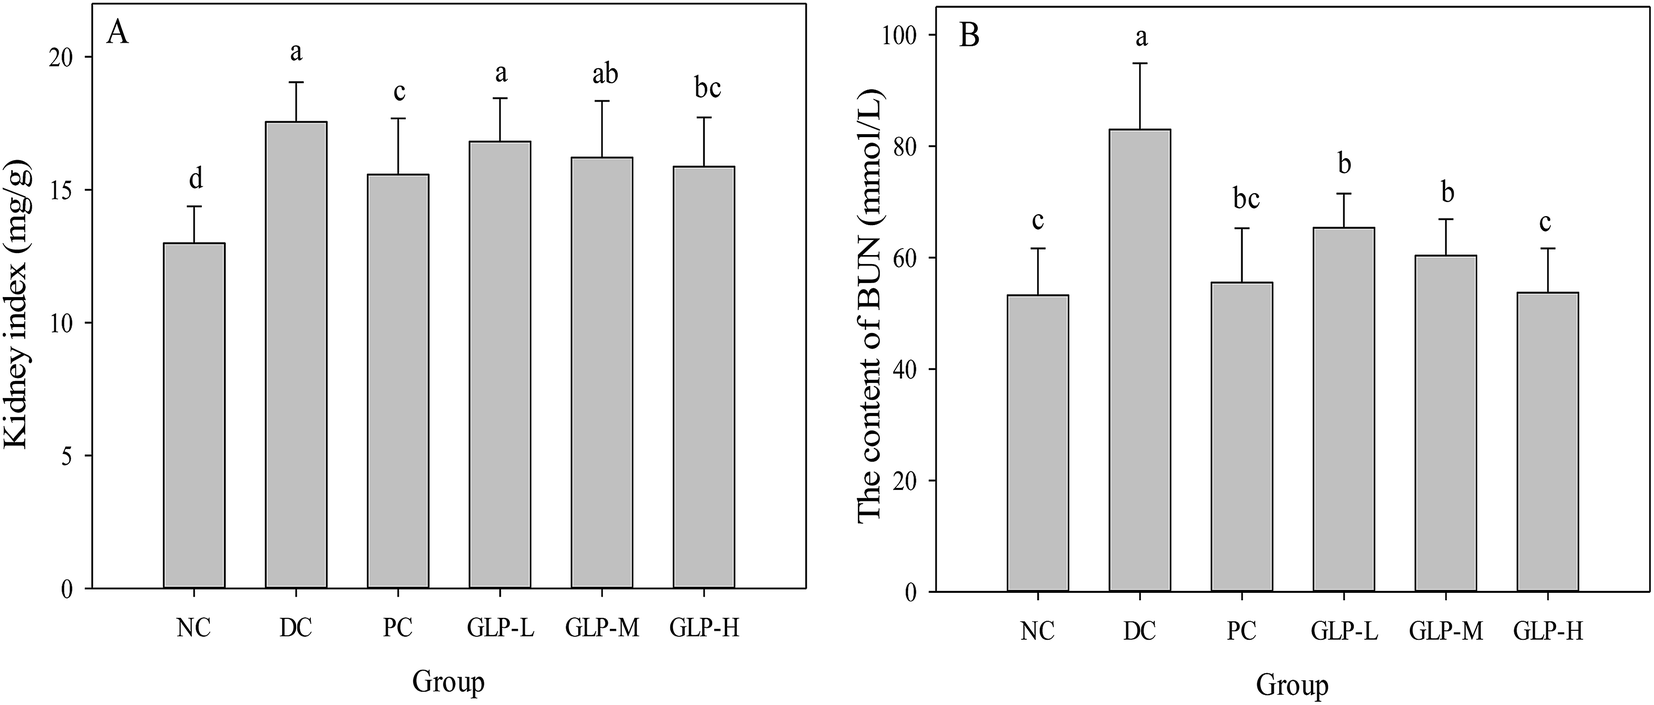 | ||
| Fig. 4 Effect of GLP polysaccharides from G. lemaneiformis on the kidney index and BUN content in STZ-induced diabetes mice at the end of the administration period. (A) Effect of GLP on the kidney index; (B) effect of GLP on the content of BUN in serum. NC, DC, PC, GLP-L, GLP-M and GLP-H refer to normal control, negative control, positive control, low dose GLP treatment, medium dose GLP treatment, and high dose GLP treatment, respectively. Values with no letter in common indicate significant differences (p < 0.05). | ||
Effect of GLP on the antioxidant enzymes and MDA content
As described above, GLP was a potential source of antioxidant, which might contribute to the protective effect of oxidative stress caused by type 2 diabetes. The activity of serum antioxidant enzyme SOD of the DC mice was significantly (p < 0.05) lower than that of the other mice (i.e. the NC, PC and GLP-treated groups, which had essentially the same SOD activity) (Fig. 5A). For the activities of GSH-Px and CAT in the liver, although the values for the DC group were still the lowest among the trialed groups, some differences were detected among the NC, PC and GLP-treated mice. GLP or metformin treatment following the STZ injection made the GSH-Px activity higher compared to the normal mice. GLP treatments led to the GSH-Px activity to be increased by 9.71% to 12.56% in a dose-dependent manner with almost the same effect detected for GLP-L and GLP-M as well as for GLP-H and metformin treatments (Fig. 5B). A similar changing pattern in CAT activity was found in comparison with the GSH-Px activity, although the difference between the GLP-L/GLP-M and GLP-H/PC groups became more remarkable while the difference between the GLP-L/GLP-M and DC group was smaller (Fig. 5C). A GLP treatment after STZ injection could increase the CAT activity by 5.74–23.65%. Thus, GLP, as well as the metformin, could protect the antioxidant enzymes against STZ-induced oxidative stress. | ||
| Fig. 5 Effect of GLP polysaccharides from G. lemaneiformis on the activities of antioxidant enzymes and MDA content in STZ-induced diabetes mice at the end of the administration period. (A) Effect of GLP on the activity of SOD in serum; (B) effect of GLP on the activity of GSH-Px in liver, (C) effect of GLP on the activity of CAT in liver; (D) effect of GLP on the content of MDA in serum. NC, DC, PC, GLP-L, GLP-M and GLP-H refer to normal control, negative control, positive control, low dose GLP treatment, medium dose GLP treatment, and high dose GLP treatment, respectively. Values with no letter in common indicate significant differences (p < 0.05). | ||
MDA, a major aldehydic decomposition product of lipid oxidation, is widely used as an index of lipid peroxidation. A remarkable increase in MDA content was found in the DC group (Fig. 5D), indicating that the STZ injection could induce lipid peroxidation GLP at all the test doses had exerted the same lowering effect on lipid peroxidation and enabled the MDA content down to the initial MDA level of the normal mice. Interestingly, the metformin treatment following STZ injection did not reduce lipid peroxidation. Thus, GLP could inhibit diabetes-associated lipid peroxidation, whilst metformin treatment couldn't. GLP could be more advantageous than metformin in combating STZ-induced diabetes.
STZ is a nitric oxide (NO) donor and could damage mitochondria causing increased xanthine oxidase activity, and generation of superoxide anions hydrogen peroxide and hydroxyl radicals.30 These radicals in excess and over time would induce chronic oxidative stress, and as a result, defective insulin gene expression, decreased insulin sensitivity and secretion, damaged pancreatic β-cells, and ultimately diabetes.47 Further, chronic exposure of pancreatic β-cells to high glucose concentration would result in defective insulin gene expression because of the loss of two critical proteins, PDX-1 and MafA (which activate the insulin promoter). Activities of the antioxidant enzymes in endogenous antioxidant systems including SOD, GSH-Px, and CAT, are commonly used to evaluate the antioxidant level of an organism.48 Previous studies already indicated the close association between increasing oxidative stress and diabetes.49,50 Some other studies reported that antioxidant supplementation could prevent from decreased insulin mRNA and insulin gene promoter activity, thereby increasing insulin content and secretion.47,51 In this study, GLP administration was found to promote the activities of the endogenous antioxidant enzymes. SOD significantly contribute to oxygen defense metabolism through intercepting and decreasing superoxide to water and molecular oxygen.52 A decrease in SOD activity in the DC group was possible, because the enzyme could be inactivated by hydrogen peroxide or glycosylated due to diabetes.53 CAT involves in the reduction of hydrogen peroxide especially at high concentrations, thus a decrease in CAT activity was likely due to its glycation and/or inactivation by superoxide radical. GSH represents a major endogenous antioxidant through its sulfhydryl group. The GSH in the liver and kidney is directly related to oxidative stress. Biological role is to protect the organism from oxidative damage. GSH-Px can reduce both lipid hydroperoxides (to alcohols) and free hydrogen peroxide (to water). The MDA content indicated the degree of organic lipid peroxides and relevant cell damage.54 Thus, the concomitant changes in the MDA level were anticipated to be associated with the activities of SOD, GSH and GSH-Px towards the toxic radicals. Liao et al.10 also found that GLP could increase the SOD and GSH-Px activities and the total antioxidant capacity, and decrease the MDA level in the blood, liver and kidney of diabetic animals. Therefore, the antidiabetic and hypoglycemic effects of GLP including lowering FBG and serum lipids as well as increasing insulin secretion and glycogen storage, may due to its protective effects on antioxidant enzymes and inhibition of lipid peroxidation.
Conclusions
Polysaccharide preparation from G. lemaneiformis (GLP) with a lower MW (21.2 kDa) could be produced at a higher yield of ∼17.81% dry weight via citric acid extraction. Present work showed that GLP possessed in vitro inhibitory effect on α-amylase and offered in vivo antidiabetic and hypoglycemic effects in streptozotocin-induced diabetic mouse model. The obtained GLP had a total sugar of 66.68%, uronic acid of 33.92% and sulfate content 19.64%, with monosaccharides rhamnose, arabinose, xylose, mannose, glucose and galactose presented at a molar ratio of 1.66:0.50:1.00:0.20:1.50:3.80. Moreover, GLP showed effective effect on lowering fasting blood glucose, improving glucose tolerance, increasing the levels of C-peptide, liver glycogen and HDL-c, decreasing the levels of serum TC, TG, LDL-c, and BUN. Moreover, GLP supplement significantly elevated GCK level, reduced G-6-Pase level, and increased G-6-PD activity. After treating with GLP, an increase in the activities of SOD, GSH-Px, and CAT, a decrease of the activities of AST and ALT, and the MDA content were observed, in comparison with the untreated diabetic mice. Moreover, a dose-dependent manner was found in most of the antidiabetic effects of GLP analyzed in this study, except for the GCK level and SOD activity. For most of the biochemical parameters/biomarkers, GLP and metformin treatments were both found to exert desirable effects on the STZ-induced diabetic mice. GLP treatments were generally more effective at monitoring insulin level, the lipidemic parameters and BUN level than metformin treatment. Thus, GLP is more advantageous than metformin not only in the naturalness of GLP but also in the action of combating STZ-induced diabetes. Accordingly, GLP could be used as a potential health food to combat STZ-induced diabetes and associated oxidative stress, via its regulation of glucose and lipid metabolism, repair of pancreatic β-cells, protection of liver and kidney function, and promotion of the activities of endogenous antioxidant enzymes. GLP-H appeared to be the best treatment in these aspects. Future work should include the study on the antidiabetic effects of the present GLP at a higher dose than GLP-H.
Acknowledgements
The authors are grateful to the financial support from Pearl River S&T Nova Program of Guangzhou (No. 201610010096), Guangdong Special Support Program (No. 2015TQ01N670), the Fundamental Research Funds for the Central Universities (2015ZZ110), the National Natural Science Foundation of Guangdong Province (No. 2014A030313242) and the program of “Leading Talent of Guangdong Province”.References
- S. Wild, G. Roglic, A. Green, R. Sicree and H. King, Diabetes Care, 2004, 27, 1047–1053 CrossRef PubMed.
- A. R. Saltiel, Cell, 2001, 104, 517–529 CrossRef CAS PubMed.
- C. D. Mathers and D. Loncar, PLoS Med., 2006, 3, e442 Search PubMed.
- V. Pitozzi, L. Giovannelli, G. Bardini, C. M. Rotella and P. Dolara, Mutat. Res., Fundam. Mol. Mech. Mutagen., 2003, 529, 129–133 CrossRef CAS PubMed.
- D. Koya and G. L. King, Diabetes, 1998, 47, 859–866 CrossRef CAS PubMed.
- S. J. Grant, D. H.-T. Chang, J. Liu, V. Wong, H. Kiat and A. Bensoussan, BMC Complementary Altern. Med., 2013, 13, 1–12 CrossRef PubMed.
- W. Pierre, A. J. H. Gildas, M. C. Ulrich, W.-N. Modeste, N. T. Benoît and K. Albert, BMC Complementary Altern. Med., 2012, 12, 1–8 CrossRef PubMed.
- J. Zhou, J. Yan, Z. Bai, K. Li and K. Huang, Carbohydr. Polym., 2015, 121, 199–206 CrossRef CAS PubMed.
- R. E. Cian, S. R. Drago, F. Sanchez de Medina and O. Martinez-Augustin, Mar. Drugs, 2015, 13, 5358–5383 CrossRef CAS PubMed.
- X. Liao, L. Yang, M. Chen, J. Yu, S. Zhang and Y. Ju, Food Funct., 2015, 6, 2542–2549 CAS.
- Y. Fan, W. Wang, W. Song, H. Chen, A. Teng and A. Liu, Carbohydr. Polym., 2012, 88, 1313–1318 CrossRef CAS.
- Q. M. Liu, Y. Yang, S. J. Maleki, M. Alcocer, S. S. Xu, C. L. Shi, M. J. Cao and G. M. Liu, J. Agric. Food Chem., 2016, 64, 4536–4544 CrossRef CAS PubMed.
- M. Zhang, L. Zhang, P. C. K. Cheung and V. E. C. Ooi, Carbohydr. Polym., 2004, 56, 123–128 CrossRef CAS.
- J. Lu, L. You, Z. Lin, M. Zhao and C. Cui, Int. J. Food Sci. Technol., 2013, 48, 1352–1358 CrossRef CAS.
- M. Dubois, K. A. Gillis, J. K. Hamilton, P. A. Rebers and F. Smith, Anal. Chem., 1956, 28, 350–356 CrossRef CAS.
- T. Bitter and H. M. Muir, Anal. Biochem., 1962, 4, 330–334 CrossRef CAS PubMed.
- J. Craigie, Z. Wen and J. Van der Meer, Bot. Mar., 1984, 27, 55–62 CAS.
- L. Wen, L. Lin, L. You, B. Yang, G. Jiang and M. Zhao, Carbohydr. Polym., 2011, 85, 541–547 CrossRef CAS.
- L. You, Q. Gao, M. Feng, B. Yang, J. Ren, L. Gu, C. Cui and M. Zhao, Food Chem., 2013, 138, 2242–2249 CrossRef CAS PubMed.
- E. Apostolidis, Y.-I. Kwon and K. Shetty, Innovative Food Sci. Emerging Technol., 2007, 8, 46–54 CrossRef CAS.
- Y. Liu, J. Sun, S. Rao, Y. Su, J. Li, C. Li, S. Xu and Y. Yang, Food Chem. Toxicol., 2013, 62, 285–291 CrossRef CAS PubMed.
- A. Majumder, A. Singh and A. Goyal, Carbohydr. Polym., 2009, 75, 150–156 CrossRef CAS.
- L. J. You, Q. Gao, M. Y. Feng, B. Yang, J. Y. Ren, L. J. Gu, C. Cui and M. M. Zhao, Food Chem., 2013, 138, 2242–2249 CrossRef CAS PubMed.
- G. Xie, I. A. Schepetkin, D. W. Siemsen, L. N. Kirpotina, J. A. Wiley and M. T. Quinn, Phytochemistry, 2008, 69, 1359–1371 CrossRef CAS PubMed.
- L. Pereira, A. M. Amado, A. T. Critchley, F. Van de Velde and P. J. Ribeiro-Claro, Food Hydrocolloids, 2009, 23, 1903–1909 CrossRef CAS.
- J. S. Maciel, L. S. Chaves, B. W. S. Souza, D. I. A. Teixeira, A. L. P. Freitas, J. P. A. Feitosa and R. C. M. de Paula, Carbohydr. Polym., 2008, 71, 559–565 CrossRef CAS.
- J.-I. Choi, H.-J. Kim and J.-W. Lee, Food Chem., 2011, 129, 520–523 CrossRef CAS.
- R. A. DeFronzo, Ann. Intern. Med., 1999, 131, 281–303 CrossRef CAS PubMed.
- M. Vessal, M. Hernmati and M. Vasei, Comp. Biochem. Physiol., Part C: Toxicol. Pharmacol., 2003, 135, 357–364 CrossRef.
- T. Szkudelski, Physiol. Res., 2001, 50, 537–546 CAS.
- Y. T. Liu, D. Chen, Y. X. You, S. Q. Zeng, Y. Hu, X. Y. Duan, A. P. Liu, H. Chen, X. J. Hu, S. J. Chen, C. Li and D. W. Chen, Carbohydr. Polym., 2016, 149, 399–407 CrossRef CAS PubMed.
- J. Gao, Y. L. Han, Z. Y. Jin, X. M. Xu, X. Q. Zha, H. Q. Chen and Y. Y. Yin, Carbohydr. Polym., 2015, 124, 25–34 CrossRef CAS PubMed.
- K. Zhu, S. Nie, C. Li, S. Lin, M. Xing, W. Li, D. Gong and M. Xie, Int. J. Biol. Macromol., 2013, 57, 142–150 CrossRef CAS PubMed.
- W. M. Kuhtreiber, S. L. L. Washer, E. Hsu, M. Zhao, P. Reinhold 3rd, D. Burger, H. Zheng and D. L. Faustman, Diabetic Med., 2015, 32, 1346–1353 CrossRef CAS PubMed.
- E. Reiling, E. Van't Riet, M. Groenewoud, L. Welschen, E. Van Hove, G. Nijpels, J. Maassen and J. Dekker, Diabetologia, 2009, 52, 1866–1870 CrossRef CAS PubMed.
- K. K. Osbak, K. Colclough, C. Saint-Martin, N. L. Beer, C. Bellanné-Chantelot, S. Ellard and A. L. Gloyn, Hum. Mutat., 2009, 30, 1512–1526 CrossRef CAS PubMed.
- Z. Q. Liu, E. J. Barrett, A. C. Dalkin, A. D. Zwart and J. Y. Chou, Biochem. Biophys. Res. Commun., 1994, 205, 680–686 CrossRef CAS PubMed.
- M. Liu, Y. Zhang, H. Zhang, B. Hu, L. Wang, H. Qian and X. Qi, Int. J. Biol. Macromol., 2016, 91, 1170–1176 CrossRef CAS PubMed.
- Y. Yao, F. Chen, M. Wang, J. Wang and G. Ren, J. Agric. Food Chem., 2008, 56, 8869–8873 CrossRef CAS PubMed.
- W.-T. Xiong, L. Gu, C. Wang, H.-X. Sun and X. Liu, J. Ethnopharmacol., 2013, 150, 935–945 CrossRef PubMed.
- S. Sancheti, S. Sancheti, M. Bafna and S.-Y. Seo, Eur. Food Res. Technol., 2010, 231, 415–421 CrossRef CAS.
- H. Ahmadieh and S. T. Azar, Diabetes Res. Clin. Pract., 2014, 104, 53–62 CrossRef CAS PubMed.
- K. X. Zhu, S. P. Nie, L. H. Tang, C. Li, D. M. Gong and M. Y. Xie, J. Agric. Food Chem., 2016, 64, 1938–1944 CrossRef CAS PubMed.
- R. B. Kasetti, M. D. Rajasekhar, V. K. Kondeti, S. S. Fatima, E. G. T. Kumar, S. Swapna, B. Ramesh and C. A. Rao, Food Chem. Toxicol., 2010, 48, 1078–1084 CrossRef CAS PubMed.
- D. L. Longo, D. L. Kasper, J. L. Jameson, A. S. Fauci, S. L. Hauser and J. Loscazo, Harrison principle of internal medicine (18th), MC Graw-Hill, New York, 2012 Search PubMed.
- F. El-Demerdash, M. Yousef and N. A. El-Naga, Food Chem. Toxicol., 2005, 43, 57–63 CrossRef CAS PubMed.
- H. Yang, X. Jin, C. W. K. Lam and S.-K. Yan, Clin. Chem. Lab. Med., 2011, 49, 1773–1782 CAS.
- L. Wen, Q. Gao, C.-w. Ma, Y. Ge, L. You, R. H. Liu, X. Fu and D. Liu, J. Funct. Foods, 2016, 20, 400–410 CrossRef CAS.
- K.-C. Chang, C.-C. Hsu, S.-H. Liu, C.-C. Su, C.-C. Yen, M.-J. Lee, K.-L. Chen, T.-J. Ho, D.-Z. Hung, C.-C. Wu, T.-H. Lu, Y.-C. Su, Y.-W. Chen and C.-F. Huang, PLoS One, 2013, 8, e54374 CAS.
- K. Maiese, Z. Z. Chong and Y. C. Shang, Curr. Med. Chem., 2007, 14, 1729–1738 CrossRef CAS PubMed.
- Y. Tanaka, C. E. Gleason, P. O. T. Tran, J. S. Harmon and R. P. Robertson, Proc. Natl. Acad. Sci. U. S. A., 1999, 96, 10857–10862 CrossRef CAS.
- Y.-F. Lin, H.-L. Tsai, Y.-C. Lee and S.-J. Chang, J. Nutr., 2005, 135, 2457–2461 CAS.
- S. Rajasekaran, K. Sivagnanam and S. Subramanian, Pharmacol. Rep., 2005, 57, 90–96 Search PubMed.
- M. Valko, D. Leibfritz, J. Moncol, M. T. Cronin, M. Mazur and J. Telser, Int. J. Biochem. Cell Biol., 2007, 39, 44–84 CrossRef CAS PubMed.
Footnote |
| † These authors contributed equally to this work. |
| This journal is © The Royal Society of Chemistry 2017 |