DOI:
10.1039/C6RA26923K
(Paper)
RSC Adv., 2017,
7, 3934-3940
A novel negative thermal expansion material of Zr0.70V1.33Mo0.67O6.73
Received
17th November 2016
, Accepted 23rd December 2016
First published on 16th January 2017
Abstract
A novel negative thermal expansion (NTE) material of Zr0.70V1.33Mo0.67O6.73 was synthesized. Its microstructure, crystal structure and thermal expansion properties were studied in detail. Structure analysis shows that Zr0.70V1.33Mo0.67O6.73 possesses a cubic crystal structure with the space group Pa![[3 with combining macron]](https://www.rsc.org/images/entities/char_0033_0304.gif) (no. 205) at room temperature (RT). The experimental results show that Zr0.70V1.33Mo0.67O6.73 exhibits a stable isotropic negative thermal expansion property and maintains a cubic structure from 103 to 773 K without any phase transition. The average linear coefficients of thermal expansion (CTEs) are calculated to be −3.75 × 10⁻⁶ K−1 (163–673 K) and −4.50 × 10⁻⁶ K−1 (RT–773 K). The intrinsic linear CTEs are calculated to be −3.84 × 10⁻⁶ K−1 (103–473 K) and −4.22 × 10⁻⁶ K−1 (RT–673 K). And the phase transition temperature of ZrV2O7 has been reduced below RT, this may be attributed to the incorporation of the cubic ZrMo2O8 structure and partially occupied Zr atoms (4a). The NTE property of Zr0.70V1.33Mo0.67O6.73 can be attributed to the quasi-rigid unit modes (QRUMs).
(no. 205) at room temperature (RT). The experimental results show that Zr0.70V1.33Mo0.67O6.73 exhibits a stable isotropic negative thermal expansion property and maintains a cubic structure from 103 to 773 K without any phase transition. The average linear coefficients of thermal expansion (CTEs) are calculated to be −3.75 × 10⁻⁶ K−1 (163–673 K) and −4.50 × 10⁻⁶ K−1 (RT–773 K). The intrinsic linear CTEs are calculated to be −3.84 × 10⁻⁶ K−1 (103–473 K) and −4.22 × 10⁻⁶ K−1 (RT–673 K). And the phase transition temperature of ZrV2O7 has been reduced below RT, this may be attributed to the incorporation of the cubic ZrMo2O8 structure and partially occupied Zr atoms (4a). The NTE property of Zr0.70V1.33Mo0.67O6.73 can be attributed to the quasi-rigid unit modes (QRUMs).
1 Introduction
Since Sleight et al.1 reported that the cubic ZrW2O8 exhibits isotropic negative thermal expansion (NTE) from 0.3 to 1050 K in 1995, the NTE materials have received extensive attention. NTE materials have potential application in the field of precise optics, aerospace, biomedical, integrated circuits and sensors due to their unique thermal expansion properties.2–4 However, the existing NTE materials still have many deficiencies from the perspective of application requirements. For instance, the typical NTE material ZrW2O8 is built of an open network of rigid ZrO6 octahedra and WO4 tetrahedra. It supports lower energy (∼0.5 meV) phonon modes and has a metastable phase at room temperature. However, ZrW2O8 undergoes an order–disorder transition at 430 K (α → β, CTEs from −8.8 × 10⁻⁶ K−1 to −4.9 × 10⁻⁶ K−1) and it is easily to be decomposed above 770 K.5–10 In addition, its phase transition pressure is relatively low and will undergo a phase transition from α to γ at 0.21 GPa (CTEs from −8.8 × 10⁻⁶ K−1 to −1.2 × 10⁻⁶ K−1)11 Similarly, the cubic ZrMo2O8 which is isostructural to ZrW2O8, has an average expansion coefficients of −6.9 × 10⁻⁶ K−1 (2–200 K) and −5.0 × 10⁻⁶ K−1 (250–502 K).12 A2M3O12 (A is a rare earth or a transition metal, M is Mo or W) series NTE materials have the advantages of big CTEs, wide-temperature range and large chemical flexibility. However, its anisotropy and hydroscopicity are serious obstacles for achieving excellent NTE properties.4,13,14 ZrV2O7 has a strong isotropic NTE characteristic from 375 to 1075 K (CTE −7.1 × 10⁻⁶ K−1) and is stable at room temperature which is different from that of ZrW2O8. Nevertheless, it displays two first phase transitions at 350 K and 375 K. It belongs to a 3 × 3 × 3 superstructure below 350 K and transforms to 1 × 1 × 1 cubic phase above 375 K, meanwhile, it transforms from positive thermal expansion to NTE. In addition, ZrV2O7 undergoes a reversible phase transition at 1.38–1.58 GPa from α (cubic) to β (pseudotetragonal).15–19 It should be highlighted that, this material will have an important application prospects if the phase transition temperature can be reduced to below room temperature.
From 1995 to 2001, Sleight et al. has done deep researches on ZrV2−xPxO7 series materials.15,17,21 In addition, Yamamura et al. has studied the phase transition temperature of Zr1−xHfxV2O7.20 However, it's regrettable that the phase transition temperature hasn't been reduced to below room temperature successfully.
In this paper, we report a novel NTE material Zr0.70V1.33Mo0.67O6.73 for the first time, which exhibits a stable isotropic NTE property in a wide temperature range from 103 to 773 K. Its crystal structure, microstructure and thermal expansion properties are studied in detail. The mechanism of the NTE property was also discussed. Its excellent NTE property integrated with the facile preparation method suggests potential applications of this novel material in many fields.
2 Experimental procedures
Analytica-grade ZrO2, V2O5 and MoO3 powders were used as starting materials and mixed according to the molar ratio of 0.70![[thin space (1/6-em)]](https://www.rsc.org/images/entities/char_2009.gif) :1.40:0.70 as eqn (1).
:1.40:0.70 as eqn (1).| | |
0.70ZrO2 + 1.33V2O5 + 0.67MoO3 = Zr0.70V1.33Mo0.67O6.73
| (1) |
The excess V2O5 and MoO3 is to compensate for their evaporation during heating. Raw materials were thoroughly mixed and ground for 2 h with absolute ethyl alcohol in an agate mortar. The homogenized raw materials were pressed into cylindrical pellets with diameter of 5 mm and thickness of 3–5 mm by 769YP-15A powder tableting machine in 8 MPa and dwelled 5 min. The pellets were put into a tubular furnace preheated to sintering temperature at 953 K and maintained for 4 h before quenched, then dried at 473 K for 1 h. To get more uniform sample, the process of ground, press and sinter was performed for a secondary round according to the process described above. Final sample was obtained after annealed at 673 K.
A D8 ADVANCE X-ray diffractometer (Germany Bruker) was used for room, high and low temperature XRD measurements; a Quanta250 scanning electron micrograph (SEM, USA FEI) and a APOLLO XP energy dispersive spectroscopy (EDS, USA EDAX) were used to analysis microstructure and chemical of sample; a ESCALAB 250Xi X-ray photoelectron spectroscopy (XPS, Germany Thermo Fisher) was used to analyze the composition of the samples and states of elements; a STA 449F3 simultaneous thermal analyzer (Germany Netzsch, in the temperature range of 300–873 K with heating and cooling rates of 10 K min−1) was used to differential scanning calorimetry (DSC) and thermogravimetric measurements (TG); a LabRAM HR Evolution Raman spectrometer (France HORIBA Jobin Yvon S.A.S.) was used to measure room temperature and temperature-dependent Raman spectral; a LINSEIS DIL L75 dilatometer (Germany LINSEIS, in the temperature range of RT–773 K with heating rate of 5 K min−1) and a LINSEIS DIL L76 dilatometer (Germany LINSEIS, in the temperature range of 163–673 K with heating rate of 5 K min−1) were used to measure the relative length changes depended temperature.
3 Results and discussion
3.1 Microstructure
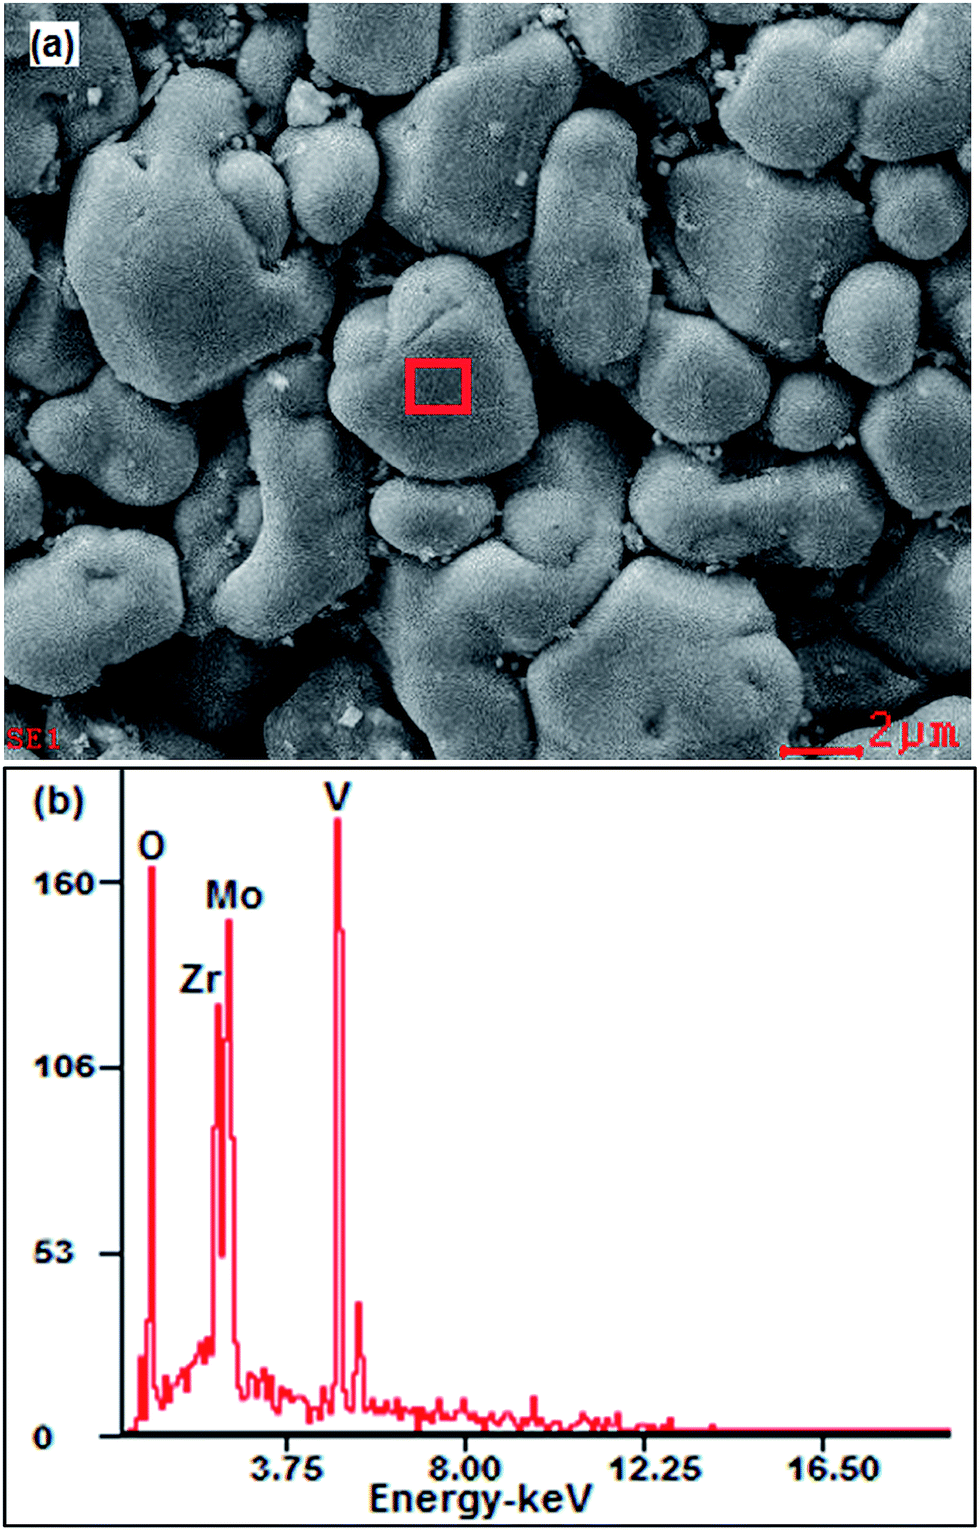
Fig. 1a shows the SEM image of the sample. It can be seen that the ceramic sample is composed of irregular particles with different sizes and smooth surface. The average particle sizes are approximately 1–6 μm. Fig. 1b shows the EDS spectrum corresponding to Fig. 1a. The EDS analysis of the grains presents primary elements of Zr, V, Mo and O.
 |
| | Fig. 1 SEM image and EDS spectrum. (a) SEM image of sample; (b) EDS spectrum corresponding to (a). | |
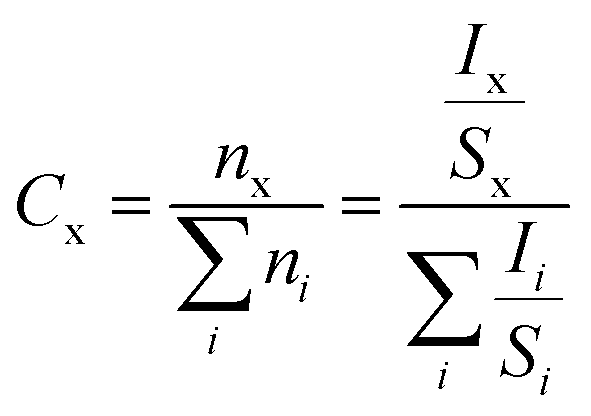
To further confirm the composition of sample, we also performed XPS analyses. Fig. 2a shows the survey scan XPS spectrum of sample, and Zr, V, Mo and O signals can be clearly observed. The Zr 3d, V 2p, Mo 3d and O 1s XPS spectra are shown in Fig. 2b–e. The Zr 3d, V 2p and Mo 3d peak values are in agreement with the existing reports,22–24 confirming the state of Zr4+, V5+ and Mo6+ in Zr0.70V1.33Mo0.67O6.73. We also calculated the atomic ratio of Zr, V, Mo and O by the relative sensitivity factor (RSF) method based on eqn (2) and (3).
| |
 | (2) |
| |
 | (3) |
where
Cx,
Ix,
Sx and
nx denote the relative content, characteristic spectra integral area, RSF and content of x element, respectively. The results were show in
Table 1. It can be clearly seen that the atomic ratio of Zr, V, Mo and O are about 0.7
:
1.33
:
0.67
:
6.73, which in good agreement with the molar ratio of starting materials.
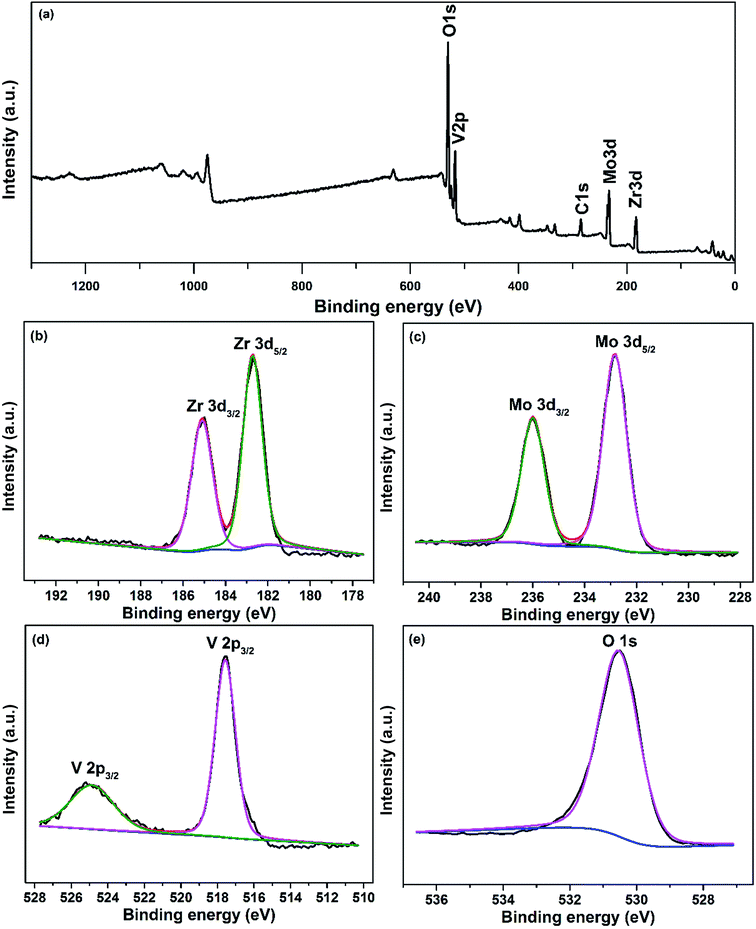 |
| | Fig. 2 The XPS spectra of sample: (a) the survey scan XPS spectrum; (b) Zr 3d; (c) V 2p; (d) Mo 3d; (e) O 1s. | |
Table 1 The integration and atomic ratio results of Zr 3d, V 2p, Mo 3d and O 1s
| Element |
RSF |
Area |
Area/RSF |
Atomic ratio |
| Zr 3d |
9.032 |
20893.893 |
2303.354 |
0.700 |
| V 2p |
9.280 |
40464.230 |
4360.370 |
1.325 |
| Mo 3d |
11.008 |
24716.019 |
2249.366 |
0.684 |
| O 1s |
2.881 |
64939.260 |
22540.528 |
6.850 |
3.2 Crystal structure
The crystal structure is refined by Rietveld analysis with software of Fullprof. Fig. 3 exhibit the Rietveld analysis for the RT XRD pattern. It must be highlighted that the refinement has reference the result of Sahoo et al. about ZrV2−xMoxO7+δ.25 The analysis shows that the sample adopts a cubic crystal structure with space group of Pa (no. 205). The cell lattice parameters and volume are calculated to be a = b = c = 8.93063 Å, V = 712.27316 Å3, respectively, with the acceptable values of, Rp = 17.6%, Rwp = 14.4% and Rexp = 11.17%.
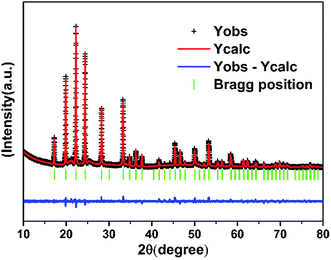 |
| | Fig. 3 XRD pattern of the sample at RT and the result of Rietveld analysis. | |
Fig. 4a presents the schematic diagram of Zr0.70V1.33Mo0.67O6.73 building block depending on the XRD refinement result. The crystal structures are characterized by linkages of corner shared VO4 or MoO4 tetrahedra and ZrO6 octahedra. The ZrO6 octahedra share all the oxygen atoms with the adjacent VO4 or MoO4 tetrahedra. On the other hand, the two VO4 tetrahedra share an oxygen atom and make a V2O7 group. Each MoO4 tetrahedron, however, share only three of its four oxygens with the neighboring ZrO6 octahedra, and consequently, has one unshared vertex. The ZrV2O7 crystallizes in the centrosymmetric Pa (no. 205),15 however, it undergoes a phase transformation from the space group P213 to Pa at 483 K. Whereas cubic ZrW2O8 crystallize in the noncentrosymmetric space group P213 (no. 198).8 As cubic ZrW2O8 is isostructural to cubic ZrMo2O8, we will compare the Zr0.70V1.33Mo0.67O6.73 with HT-ZrW2O8. Table 2 provides the atomic coordinates of the current compound of Zr0.70V1.33Mo0.67O6.73, ZrV2O7 and HT-ZrW2O8. A comparison of the asymmetric unit of Zr0.70V1.33Mo0.67O6.73 with ZrV2O7 is shown in Fig. 4b and c. It is clear that the formula derived from the XRD refinement result is Zr0.70V1.33Mo0.67O6.73 and the structure of Zr0.70V1.33Mo0.67O6.73 is a hybrid of ZrV2O7 and cubic ZrMo2O8. The incorporation of cubic ZrMo2O8 structure and partially occupied Zr atoms (4a) maybe the main reasons of the phase transition temperature decrease. And the NTE in Zr0.70V1.33Mo0.67O6.73 can be mainly attributed to the QRUMs, which will be discussed later.
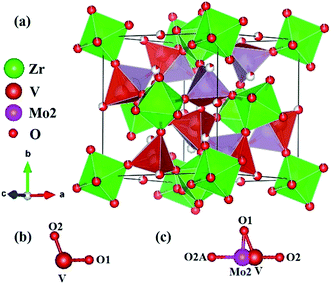 |
| | Fig. 4 Schematic diagram of Zr0.70V1.33Mo0.67O6.73. (a) Polyhedral representation of Zr0.70V1.33Mo0.67O6.73; (b) asymmetric unit of ZrV2O7; (c) asymmetric unit of Zr0.70V1.33Mo0.67O6.73. | |
Table 2 Atomic coordinates of Zr0.70V1.33Mo0.67O6.73, ZrV2O7 and HT-ZrW2O8
| |
Zr0.70V1.33Mo0.67O6.73 |
ZrV2O7 (ref. 15) |
HT-ZrW2O8 (ref. 8) |
| Atom |
Zr (4a) |
Zr (4a) |
Zr (4a) |
| x = y = z |
0 |
0 |
0 |
| Occupancy |
0.7 |
1 |
1 |
| Atom |
V (8c) |
V (8c) |
W1 (8c) |
| x = y = z |
0.40072 |
0.38174 |
0.33945 |
| Occupancy |
0.66667 |
1 |
0.5 |
| Atom |
Mo2 (8c) |
|
W2 (8c) |
| x = y = z |
0.34932 |
|
0.60355 |
| Occupancy |
0.33333 |
|
0.5 |
| Atom |
O2 (4b) |
O2 (4b) |
O3 (8c) |
| x = y = z |
0.5 |
0.5 |
0.50550 |
| Occupancy |
0.66667 |
1 |
0.5 |
| Atom |
O2A (8c) |
|
O4 (8c) |
| x = y = z |
0.23221 |
|
0.23224 |
| Occupancy |
0.16667 |
|
0.5 |
| Atom |
O1 (24d) |
O1 (24d) |
O1 (24d) |
| x |
0.45206 |
0.43634 |
0.05494 |
| y |
0.18844 |
0.20582 |
−0.20893 |
| z |
0.41926 |
0.40730 |
−0.06713 |
| Occupancy |
0.95556 |
1 |
1 |
3.3 Thermal expansion properties
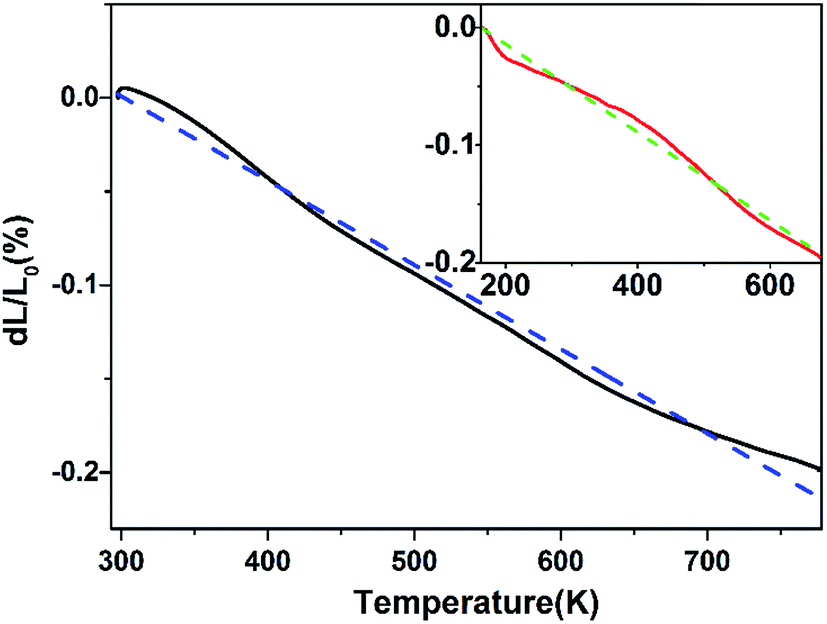
Fig. 5 shows the relative length (%) change of Zr0.70V1.33Mo0.67O6.73 ceramic with temperature measured by high-temperature dilatometer (RT–773 K) and low-temperature dilatometer (163–673 K), respectively. It shows that Zr0.70V1.33Mo0.67O6.73 ceramic exhibits the NTE from 163 to 773 K, and the average linear CTEs are calculated to be −3.75 × 10⁻⁶ K−1 (163–673 K) and −4.50 × 10⁻⁶ K−1 (RT–773 K).
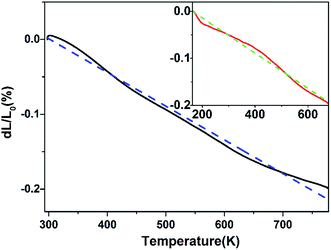 |
| | Fig. 5 Relative length (%) changes of the Zr0.70V1.33Mo0.67O6.73 ceramic with temperature from RT to 773 K and from 163 to 673 K (inset). The dotted lines are linear fits to the experimental data. | |
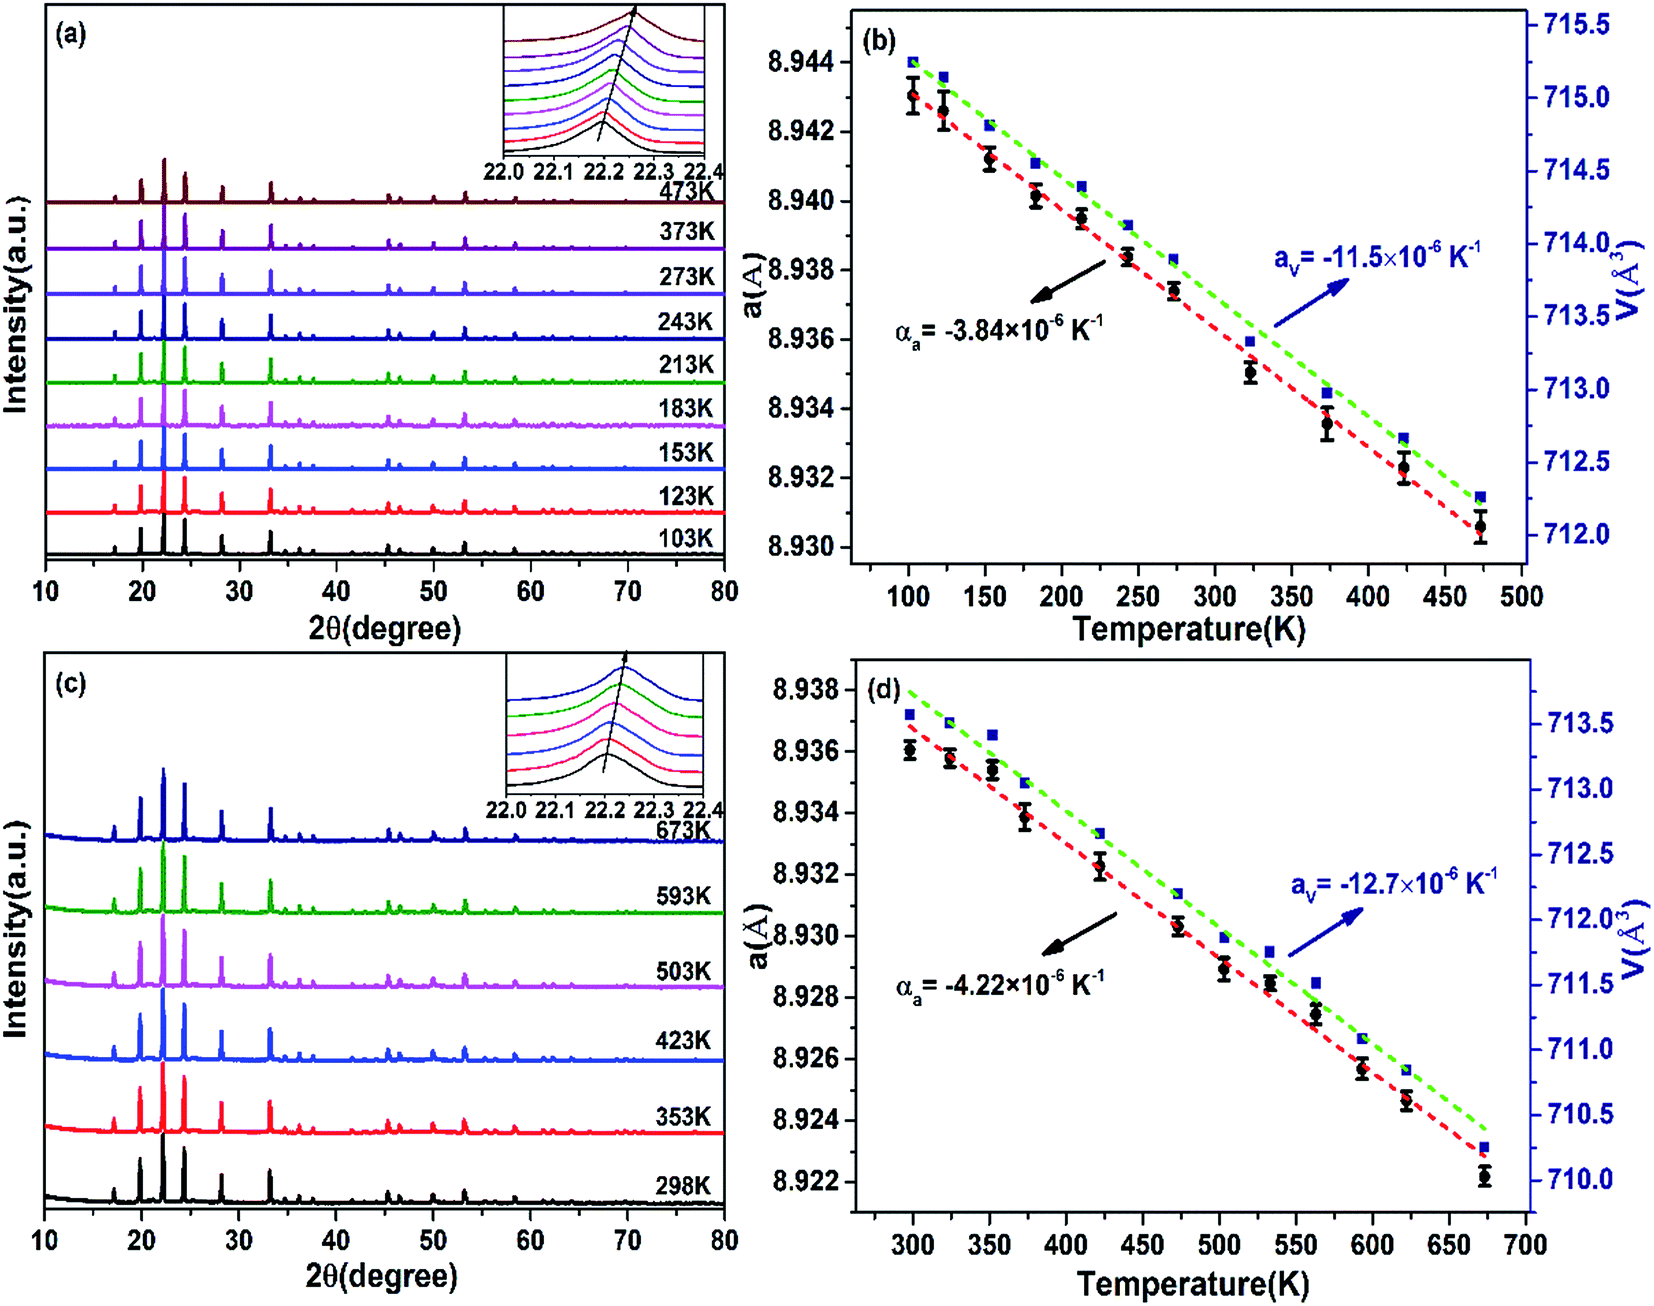
Fig. 6a and c show the low and high temperature XRD patterns of Zr0.70V1.33Mo0.67O6.73 ceramic. The XRD patterns remain unchanged from 103 to 473 K and from RT to 673 K except successful shifts of the diffraction peaks to higher angles, suggesting that Zr0.70V1.33Mo0.67O6.73 keeps the cubic structure from 103 to 673 K without phase transitions. The successive shifts of the diffraction peaks to higher angles reveals a contraction in lattice constants with increasing temperature in complete agreement with the result of Fig. 5. Fig. 6b and d exhibit the changes of the lattice constants along a, b, c axes (a = b = c) and lattice volume V with temperature which is calculated by PowderX. The intrinsic linear CTEs of a-, b-, and c-axes are calculated to be αa = αb = αc = −3.84 × 10⁻⁶ K−1 (103–463 K) and αa = αb = αc = −4.22 × 10⁻⁶ K−1 (RT–673 K). The volume CTEs are calculated to be αV = −11.5 × 10⁻⁶ K−1 (103–463 K) and αV = −12.7 × 10⁻⁶ K−1 (RT–673 K), which agree well with the results measured by dilatometry (see Fig. 5).
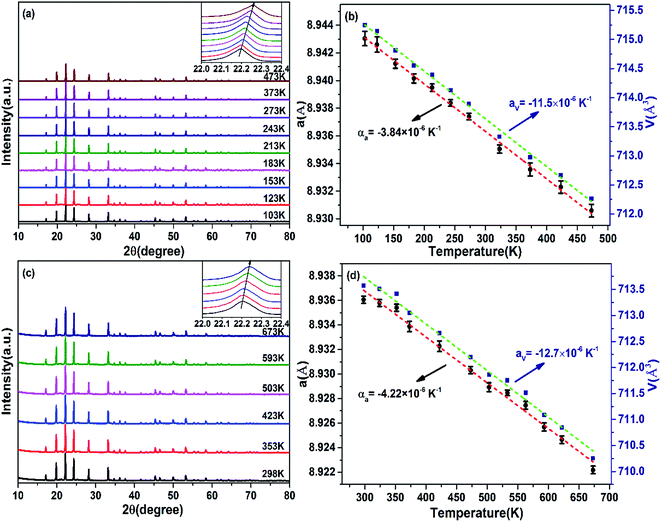 |
| | Fig. 6 Temperature dependent XRD. (a) Low temperature XRD patterns of Zr0.70V1.33Mo0.67O6.73 (the inset on right top is the enlarged view of the main peak between 22.0° and 22.4°); (b) change in lattice constant and cell volume of Zr0.70V1.33Mo0.67O6.73 of low temperature XRD; (c) high temperature XRD patterns of Zr0.70V1.33Mo0.67O6.73 (the inset on right top is the enlarged view of the main peak between 22.0° and 22.4°); (d) change in lattice constant and cell volume of Zr0.70V1.33Mo0.67O6.73 of high temperature XRD. | |
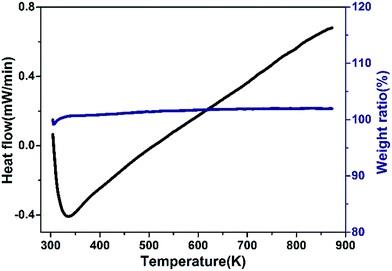
Fig. 7 shows the DSC and thermogravimetric plots of the Zr0.70V1.33Mo0.67O6.73. The mass increase and dip in DSC before 335 K are an instrumental artifact and thermal drift. Neither evident endothermic/exothermic peaks nor obvious weight loss from RT to 873 K appear, confirming that Zr0.70V1.33Mo0.67O6.73 possesses perfect thermal stability and does not exhibit phase transition from RT to 873 K.
 |
| | Fig. 7 Typical DSC and thermogravimetric plots for Zr0.70V1.33Mo0.67O6.73. | |
3.4 Thermal shrink mechanism discussed
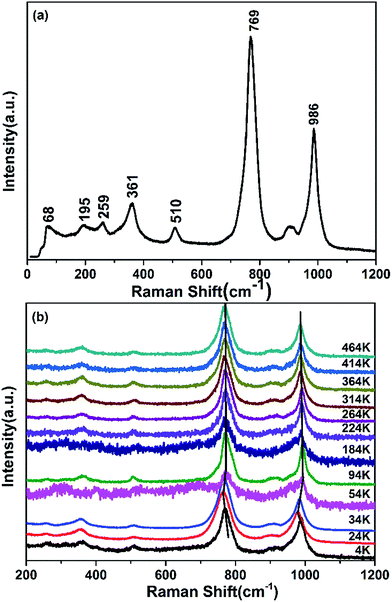
Fig. 8a shows the RT Raman spectrum of Zr0.70V1.33Mo0.67O6.73. The Raman modes in the ranges 310–400 cm−1, 480–550 cm−1, 700–850 cm−1 and 850–1050 cm−1 are identified as symmetric bending (ν2), asymmetric bending (ν4), asymmetric stretching (ν3) and symmetric stretching (ν1) modes of the MoO4 and VO4 tetrahedra, respectively. And those peaks below 300 cm−1 are vibration of Zr atomic and translational and librational modes of MoO4 and VO4 tetrahedra.14,19,26,27 Fig. 8b shows the temperature-dependent Raman spectra of ZrMoV2O10 from 4 to 464 K. It reveals that there are no distinct appear or disappear of Raman peaks. The Raman shifts occur successively redshift from 4 to 24 K and blue shift from 24 to 54 K, so it can be speculated that the temperature range of 24–54 K is the transition of superstructure.15,16 Meanwhile, the Raman shifts occur redshift from 54 to 464 K without changing the amount of Raman peaks, suggesting that Zr0.70V1.33Mo0.67O6.73 keeps the cubic structure from 54 to 464 K without phase transitions. It can be also confirmed by the result of DSC (Fig. 7). The rotations of MoO4 and VO4 tetrahedra with increasing temperature result in the change of symmetric bending (ν2), asymmetric bending (ν4), asymmetric stretching (ν3) and symmetric stretching (ν1) vibrational modes, which is the main reason for the redshift of Raman bands.
 |
| | Fig. 8 Raman spectra. (a) Room temperature Raman spectrum of Zr0.70V1.33Mo0.67O6.73; (b) low temperature Raman spectra of Zr0.70V1.33Mo0.67O6.73 from 4 to 464 K. | |
From the results of XRD refinement and temperature dependent Raman spectra, we deduced that Zr0.70V1.33Mo0.67O6.73 belongs to a 3 × 3 × 3 superstructure below 24 K then starts to transition from 3 × 3 × 3 superstructure to 1 × 1 × 1 cubic phase and completely transition to 1 × 1 × 1 cubic phase above 54 K. It exhibits stable NTE property above 54 K. Considered the similarities of structure and properties between Zr0.7V1.4Mo0.7O7 and ZrV2O7,15,17,27 we regard MoO4, VO4 tetrahedra and ZrO6 octahedra in Zr0.70V1.33Mo0.67O6.73 crystal as quasi-rigid, when the temperature is higher than 54 K, the polyhedra vibrate as the temperature increasing. The tilts and rotations of MoO4 and VO4 tetrahedra, will necessarily drag the ZrO6 octahedra along with it, and pull the rest of the structure in, giving a volume reduction. Since this tilts and rotations, and hence volume reduction, will be larger at higher temperature, there will be a NTE property. It is of interest to note that in ZrV2O7, the negative thermal expansion begins at 375 K. Nevertheless, in Zr0.70V1.33Mo0.67O6.73, it begins at 54 K. This indicates that the phase transition temperature has been reduced to 54 K. According to the preceding crystal structure analysis in 3.3 and the NTE property of cubic ZrMo2O8,8,15 we deduced that it may be attributed to the incorporation of cubic ZrMo2O8 structure and partially occupied Zr atoms (4a).
4 Conclusion
In summary, we developed a novel NTE material Zr0.70V1.33Mo0.67O6.73, which possesses excellent stable isotropic NTE property and keeps cubic crystal structure over a wide temperature range from 103 to 773 K. Structure analysis shows that Zr0.70V1.33Mo0.67O6.73 has a cubic structure with the space group Pa (no. 205). The average linear CTEs are calculated to be −3.75 × 10⁻⁶ K−1 (163–673 K) and −4.50 × 10⁻⁶ K−1 (RT–773 K). The intrinsic linear CTEs are calculated to be −3.84 × 10⁻⁶ K−1 (103–473 K) and −4.22 × 10⁻⁶ K−1 (RT–673 K). Zr0.70V1.33Mo0.67O6.73 belongs to a 3 × 3 × 3 superstructure below 24 K and 1 × 1 × 1 cubic phase above 54 K while it exhibits the stable isotropic NTE property. The NTE property can be attributed to the QRUMs. And the phase transition temperature of ZrV2O7 has been reduced below RT, this may be attributed to the incorporation of ZrMo2O8 structure and partially occupied Zr atoms (4a). The excellent NTE property integrated with the facile preparation method implies potential application of Zr0.70V1.33Mo0.67O6.73. This work could open up new opportunities for developing NTE materials.
Acknowledgements
The authors acknowledge the financial support given by the National Natural Science Foundation of China (11574276, 51503185), and the Key Natural Science Project of Henan Province (142102210073), China Postdoctoral Science Foundation (2015M580636, 2016T90637) and the Startup Research Fund of Zhengzhou University (1512317010).
References
- T. A. Mary, J. S. O. Evans, T. Vogt and A. W. Sleight, Science, 1996, 272, 90–92 CAS.
- Y. G. Cheng, Y. Liang, X. H. Ge, X. S. Liu, B. H. Yuan, J. Guo, M. J. Chao and E. J. Liang, RSC Adv., 2016, 6, 53657–53661 RSC.
- C. Zhou, Q. Zhang, S. Y. Liu, T. Zhou, J. R. Jokisaari and G. H. Wu, J. Alloys Compd., 2016, 670, 182–187 CrossRef CAS.
- X. H. Ge, Y. C. Mao, X. S. Liu, Y. G. Cheng, B. H. Yuan, M. J. Chao and E. J. Liang, Sci. Rep., 2016, 6, 24832 CrossRef CAS PubMed.
- G. Ernst, C. Broholm, G. R. Kowach and A. P. Ramirez, Nature, 1998, 396, 147–149 CrossRef CAS.
- R. Mittal and S. L. Chaplot, Phys. Rev. B: Condens. Matter Mater. Phys., 1999, 60, 7234 CrossRef CAS.
- D. Cao, F. Bridges, G. R. Kowach and A. P. Ramirez, Phys. Rev. Lett., 2002, 89, 215902 CrossRef CAS PubMed.
- J. S. O. Evans, T. A. Mary, T. Vogt, M. A. Subramanian and A. W. Sleight, Chem. Mater., 1996, 8, 2809–2823 CrossRef CAS.
- J. S. O. Evans, Z. Hu, J. D. Jorgensen, D. N. Argyriou, S. Short and A. W. Sleight, Science, 1997, 275, 61–65 CrossRef CAS PubMed.
- Y. Yamamura, N. Nakajima and T. Tsuji, Solid State Commun., 2000, 114, 453–455 CrossRef CAS.
- C. A. Perottoni and J. A. H. Da Jornada, Science, 1998, 280, 886–889 CrossRef CAS PubMed.
- S. Allen and J. S. O. Evans, Phys. Rev. B: Condens. Matter Mater. Phys., 2003, 68, 134101 CrossRef.
- A. K. Tyagi, S. N. Achary and M. D. Mathews, J. Alloys Compd., 2002, 339, 207–210 CrossRef CAS.
- E. J. Liang, H. L. Huo, J. P. Wang and M. J. Chao, J. Phys. Chem. C, 2008, 112, 6577–6581 CAS.
- N. Khosrovani, A. W. Sleight and T. Vogt, J. Solid State Chem., 1997, 132, 355–360 CrossRef CAS.
- Y. Yamamura, A. Horikoshi, S. Yasuzuka, H. Saitoh and K. Saito, Dalton Trans., 2011, 40, 2242–2248 RSC.
- R. L. Withers, J. S. O. Evans, J. Hanson and A. W. Sleight, J. Solid State Chem., 1998, 137, 161–167 CrossRef CAS.
- U. L. C. Hemamala, F. El-Ghussein, D. V. S. Muthu, A. K. Krogh Andersen, S. Carlson, L. Ouyang and M. Kruger, Solid State Commun., 2007, 141, 680–684 CrossRef CAS.
- J. S. O. Evans, T. A. Mary and A. W. Sleight, J. Solid State Chem., 1997, 133, 580–583 CrossRef CAS.
- T. Hisashige, T. Yamaguchi, T. Tsuji and Y. Yamamura, J. Ceram. Soc. Jpn., 2006, 114, 607–611 CrossRef CAS.
- V. Korthuis, N. Khosrovani, A. W. Sleight, N. Roberts, R. Dupree and W. J. Warren, Chem. Mater., 1995, 7, 412–417 CrossRef CAS.
- E. Magni and G. A. Somorjai, J. Phys. Chem., 1996, 100, 14786–14793 CrossRef CAS.
- Y. C. Mao, W. Li, X. F. Sun, Y. J. Ma, J. Xia, Y. F. Zhao, X. H. Lu, J. Y. Gan, Z. Q. Liu, J. Chen, P. Liu and Y. X. Tong, CrystEngComm, 2012, 14, 1419–1424 RSC.
- C. D. Wagner, Handbook of X-Ray photoelectron spectroscopy, ed. G. E. Muilenberg, Perkin-Elmer, 1979 Search PubMed.
- P. P. Sahoo, S. Sumithra, G. Madras and T. N. Guru Row, Inorg. Chem., 2011, 50, 8774–8781 CrossRef CAS PubMed.
- M. Maczka, W. Paraguassu, A. G. Souza Filho, P. T. C. Freire, J. Mendes Filho, F. E. A. Melo and J. Hanuza, J. Solid State Chem., 2004, 177, 2002–2006 CrossRef CAS.
- J. Z. Tao and A. W. Sleight, J. Solid State Chem., 2003, 173, 442–448 CrossRef CAS.
|
| This journal is © The Royal Society of Chemistry 2017 |
Click here to see how this site uses Cookies. View our privacy policy here. 
 Open Access Article
 This Open Access Article is licensed under a
  *,
Niu Zhang,
Mengjie Yang,
Xuhui Kong,
Xiaoshuai Kong and
Erjun Liang
*,
Niu Zhang,
Mengjie Yang,
Xuhui Kong,
Xiaoshuai Kong and
Erjun Liang