DOI:
10.1039/C6RA26911G
(Paper)
RSC Adv., 2017,
7, 7774-7779
Preparation of quantum dots-montmorillonite nanocomposites with strong photoluminescence for light-emitting diodes†
Received
17th November 2016
, Accepted 18th January 2017
First published on 23rd January 2017
Abstract
CdTe quantum dots (QDs)/montmorillonite (MMT)-Na+ nanocomposites with tunable fluorescence colors and stable photoluminescence quantum yields (PLQYs) are used as the color convertors in commercial light-emitting diodes (LEDs) for the first time. By controlling the size of the CdTe QDs, the fluorescence colors of the nanocomposites can cover the range from green to red. Because of the high reducibility of N2H4, the current CdTe QDs synthesized through the N2H4-promoted strategy possess improved PL stability compared with those through the conventional reflux growth method. Furthermore, a freeze-drying instead of a precipitation pathway is employed for the separation of the nanocomposites from solvent, which efficiently avoids the aggregation induced by centrifugation. Owing to the great photoluminescence (PL) properties of the CdTe QDs/MMT-Na+ nanocomposites, the as-fabricated LEDs exhibit promising potential.
Introduction
Due to advantages such as high efficiency, long lifetime, energy-saving and reliability, light-emitting diodes (LEDs) have already been considered as the next generation solid-state light sources.1,2 Particularly, the white LEDs (WLEDs) are the most competitive substitutes for the widely used incandescent lamps and fluorescent lamps.3–5 So far, the commercial LEDs are normally based on the blue-violet light-emitting InGaN/GaN chip with a color conversion layer.6–8 Under the working conditions, the color conversion layer absorbs the blue light emitted by the InGaN/GaN chip and then produces different colors of light through fluorescence. Therefore, the emission colors of LEDs are totally determined by the fluorescent materials in the color conversion layer. Until now, rare earths are the most popular materials used in the color conversion layer.8,9 However, the limited supply and increasing price significantly impede their future applicability. Quantum dots (QDs), owing to their unique shape- and size-dependent physicochemical characteristics, such as size-tunable optical properties, high photostability and photoluminescence quantum yield (PLQYs), wide absorption spectrum, superb resistance against photobleaching and narrow emission spectra, have been considered as the promising alternatives.10–12
Because of the nanosize effects, QDs have a strong tendency towards agglomeration upon their isolation from colloidal suspensions. This agglomeration is irreversible, which always leads to serious photoluminescence (PL) quenching and the red shift for both the optical absorption and emission.13,14 To be used in the color conversion layer, QDs are required in a solid powder format instead of the suspension colloidal format. Therefore, it is still a challenge to prepare the QD powders with the stable, intact PL properties. One strategy to solve this problem is introducing QDs into the dispersant media which can facilitate their uniform incorporation to enhance their stability and luminescence without aggregation.15–18 Montmorillonite (MMT), as a kind of low-cost, easily available, and most importantly, environmentally friendly material, has attracted more and more attention.19,20 By intercalating QDs into MMT, the QDs/MMT nanocomposites with various compositions are recently demonstrated.21–27 Due to the stable chemical and PL properties, the QDs/MMT nanocomposites have been successfully used for enhanced latent fingerprint detection.28 However, the utilization of QDs/MMT nanocomposites as the color conversion layer for LEDs has never been attempted.
In this paper, the CdTe QDs/MMT-Na+ nanocomposites are used as the color convertors in commercial LEDs for the first time. By introducing CdTe QDs with different sizes into MMT-Na+ clays through the electrostatic interaction, the fluorescence colors of nanocomposites can be tunable from green to red. Different from the conventional reflux growth, the CdTe QDs herein are synthesized through the N2H4-promoted strategy, which can efficiently protect the QDs from oxidation, leading to their improved PL stability.29 Moreover, the freeze-drying instead of the precipitation pathway is employed for the separation of nanocomposites from solvent. Thus the aggregation induced by the centrifugation process can be avoided efficiently. After mixing with polydimethylsiloxane (PDMS), the CdTe QDs/MMT-Na+ nanocomposites exhibit impressive potential in the field of LEDs.
Experimental
Materials
Tellurium powder (∼200 mesh, 99.8%), 3-mercaptopropionic acid (MPA, 99+%) were purchased from Aldrich. NaBH4 (96%), NaOH (99%), CHCl3, Na2TeO3 (98+%), CdCl2 (99%), 2-propanol (99%), MMT-Na+ clays, and N2H4·H2O (80%) were commercially available products and used as received. PDMS elastomer kits (Sylgard 184) were purchased from Dow Corning (Midland, MI).
N2H4-promoted synthesis of MPA-stabilized CdTe QDs
The synthesis of aqueous CdTe QDs decorated by MPA in the presence of N2H4 was performed according to our previous work.29 Briefly, 4 mL 100 mM CdCl2 aqueous solution, 48 mL water, 71 μL MPA, 4 mL 20 mM Na2TeO3 aqueous solution, 50 mg NaBH4, and 24 mL 80% N2H4·H2O were added in a conical flask in turn. The concentration of QDs was 5 mM referring to Cd2+, and the molar ratios of Cd2+/MPA/TeO32−/NaBH4/N2H4·H2O were 1/2.0/0.2/3.3/2000. The solution was stored at room temperature to maintain the growth of QDs. By changing the storage time, the PL emissions of QDs could be tunable from 520 to 690 nm, which were corresponding to the emission colors from green to red. For further characterization, the QD solutions were purified by centrifugation with the addition of 2-propanol.
Preparation of MPA-stabilized CdTe QDs through reflux method
Typically, MPA-modified CdTe precursors were prepared by injecting freshly prepared NaHTe aqueous solution into N2-saturated CdCl2 solution at pH = 9.5 in the presence of MPA.30 The concentration of the precursors was 5 mM with reference to the concentration of Cd2+, whereas the molar ratios of Cd2+/MPA/HTe were 1/2.0/0.2. The precursors were then subjected to a reflux to promote the growth of CdTe QDs.
N2H4-promoted synthesis of MPA-stabilized CdSe, CdS, CdSexTe1−x QDs
Typically, MPA-modified CdSe precursors were prepared by injecting freshly prepared NaHSe aqueous solution into N2-saturated CdCl2 solution at pH = 9.5 in the presence of MPA. The concentration of the precursors was 10 mM with reference to the concentration of Cd2+, whereas the molar ratios of Cd2+/MPA/HSe− were 1/2.0/0.2. N2H4·H2O was added into the precursors, where the molar ratio of CdSe/N2H4·H2O was 1![[thin space (1/6-em)]](https://www.rsc.org/images/entities/char_2009.gif) :2000. Following the similar procedure, except using Na2S or NaHSe0.25Te0.75 as the chalcogenide sources, CdS and CdSe0.25Te0.75 QDs were prepared.
:2000. Following the similar procedure, except using Na2S or NaHSe0.25Te0.75 as the chalcogenide sources, CdS and CdSe0.25Te0.75 QDs were prepared.
Measurement of the absolute PLQYs of the nanocomposite powders
The absolute PLQYs of nanocomposite powders were measured on Edinburgh FLS920 (excited at 400 nm) equipped with an integrating sphere. Before the measurement, the instrument was calibrated by the quinine in 0.5 mol L−1 H2SO4 aqueous solution. Then, the samples were placed on the sample holder in the integrating sphere for measuring their emission spectra. Finally, the PLQYs were calculated by the software supplied by the manufacturer according to the previous paper.31
Fabrication of the nanocomposites
Briefly, 1 g of MMT-Na+ clays were first suspended in 50 mL distilled water. Then magnetic stirring followed by the ultrasonic treatment were used to disperse the clays until them became the muddy colloidal suspension. In the next step, a certain amount of MPA–CdTe QDs synthesized by N2H4-promoted approach were added into the flask followed by an extra 30 min of ultrasonication. The resulting mixture was treated by liquid N2 under continuous stirring until it became an icy solid. Then the solid was placed into the freeze dryer and kept overnight to dry before it turned into powder. The concentration of QDs in nanocomposites could be easily adjusted through varying the content of the added QDs.
Other QDs-based nanocomposites were prepared through the similar procedure except using CdSe, CdS, and CdSexTe1−x QDs.
Fabrication of LEDs from the nanocomposites
InGaN LED chips without phosphor coating were purchased from Shen Zhen Hongcai Electronics CO., LTD. The emission and operating voltage of the LED chips were centered at 450 nm and 3.0 V, respectively. In the fabrication of the color conversion layer, CdTe–MMT-Na+ nanocomposites with different emission colors were foremost mixed under specific ratio and milled to the fine powder. Afterwards, the PDMS precursors were mixed with the nanocomposites at a ratio of 18:1 (w/w). The resulting mixture was vacuumized to remove the bubbles formed during mixing. Then, the mixture was loaded on the LED chips and thermally cured in a convection oven at 100 °C for 4 h. Finally, the LEDs from CdTe–MMT-Na+ nanocomposites were fabricated.
Characterization
UV-vis absorption spectra were obtained using a Lambda 800 UV-vis spectrophotometer. PL spectroscopy was performed with a Shimadzu RF-5301 PC spectrophotometer. The excitation wavelength was 400 nm. Transmission electron microscopy (TEM) was conducted using a Hitachi H-800 electron microscope at an acceleration voltage of 200 kV with a CCD camera. Scanning electron microscope (SEM) image was taken with a JEOL FESEM 6700F electron microscope with primary electron energy of 3 kV. Energy dispersive spectrum (EDS) and mapping were conducted with Inca X-Max instruments made by Oxford Instruments. Fourier transform infrared (FTIR) spectra were performed with a Nicolet AVATAR 360 FTIR instrument. X-ray photoelectron spectroscopy (XPS) was investigated using a VG ESCALAB MKII spectrometer with a Mg KR excitation (1253.6 eV). Binding energy calibration was based on C 1s at 284.6 eV. X-ray powder diffraction (XRD) investigation was carried out using Siemens D5005 diffractometer. The color of light was identified by the Commission Internationale de L'Eclairage (CIE) colorimetry system. Any color could be described by the chromaticity (x, y) coordinates on the CIE diagram. The absolute PLQYs of CdTe–MMT-Na+ nanocomposites were measured on Edinburgh FLS920 (excited at 365 nm). The spectra of the LEDs were measured by combining a Spectrascan PR-650 spectrophotometer. The freeze dryer was produced by SCIENTZ.
Results and discussion
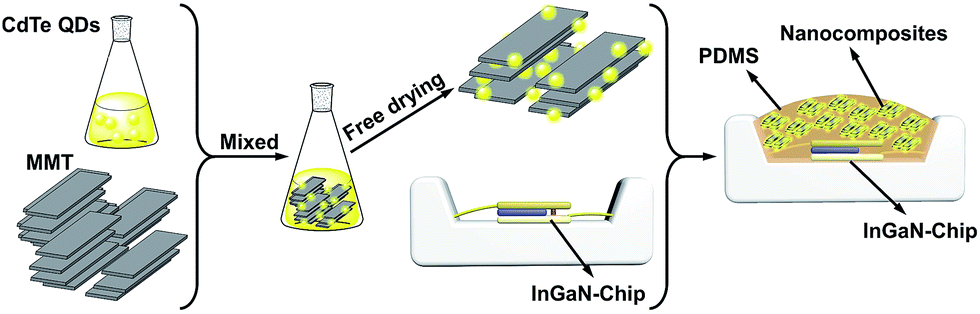
Negative-charged aqueous CdTe QDs are directly synthesized in the presence of N2H4. By changing the reaction time, the as-synthesized QDs possess strong and controllable PL from 520 to 620 nm, corresponding to the emission colors from green to red (Fig. S1†).29 Fig. S2† shows the TEM image and XRD pattern of CdTe QDs, from which it can be seen that the as-synthesized QDs are cubic crystal structures, monodispersed spheres with the average diameter of 2.1 nm.32 To fabricate QDs-based nanocomposites, the positive-charged MMT-Na+ clays are selected as the host media. Fig. 1 schematically illustrates the fabrication process of the nanocomposites: CdTe QDs and MMT-Na+ clays are incorporated together in an aqueous environment through the electrostatic interaction and then frozen to dry to remove water. Fig. 2 shows the PL photographs and PL spectra of the nanocomposite powders fabricated by mixing MMT-Na+ clays and CdTe QDs with different sizes. Under 365 nm ultraviolet, the nanocomposite powders exhibit almost the same PL properties as those of original CdTe QDs, which indicates the CdTe QDs are retained intactly during the fabrication process (Table 1). It is worth to mention that the current CdTe QDs are synthesized following the room-temperature N2H4-promoted strategy. Because of the great reducibility, N2H4 can offer a protective surrounding to avoid the oxidation of QDs and their ligands, which leads to the higher PLQYs than those through the conventional thermal growth.29 Furthermore, the QDs/MMT-Na+ nanocomposite powders herein are prepared through freeze-drying instead of the precipitation pathway using 2-propanol, thus the possible aggregation induced by centrifugation can be avoided efficiently (Fig. S3†). Besides CdTe, other QDs such as CdS, CdSe, and CdSexTe1−x can also be used for fabricating the nanocomposites. Fig. S4† shows the optical and PL photographs of nanocomposite powders containing CdS, CdSe, and CdSe0.25Te0.75 QDs respectively.
 |
| | Fig. 1 Schematic representation for the fabrication of CdTe QDs/MMT-Na+ nanocomposites and their further application in LEDs as color converters. | |
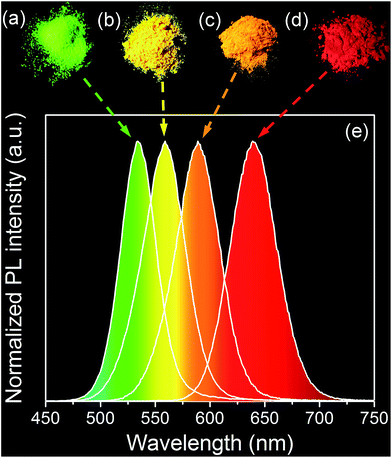 |
| | Fig. 2 PL images of CdTe QDs/MMT-Na+ nanocomposites with green (a), yellow (b), orange (c) and red (d) emissions. (e) Emission spectra of CdTe QDs/MMT-Na+ nanocomposites with different emission colors. | |
Table 1 PL properties of CdTe QDs/MMT-Na+ nanocomposites with different emissions
| Sample |
WQDs (%) |
Absolute PLQYs of nanocomposite powders (%) |
PL peak position of nanocomposites (nm) |
PL peak position of the original solution (nm) |
| 1 |
1.07 |
4.3 |
534 |
533 |
| 2 |
1.37 |
16.9 |
560 |
558 |
| 3 |
1.62 |
12.7 |
590 |
589 |
| 4 |
1.27 |
8.9 |
634 |
633 |
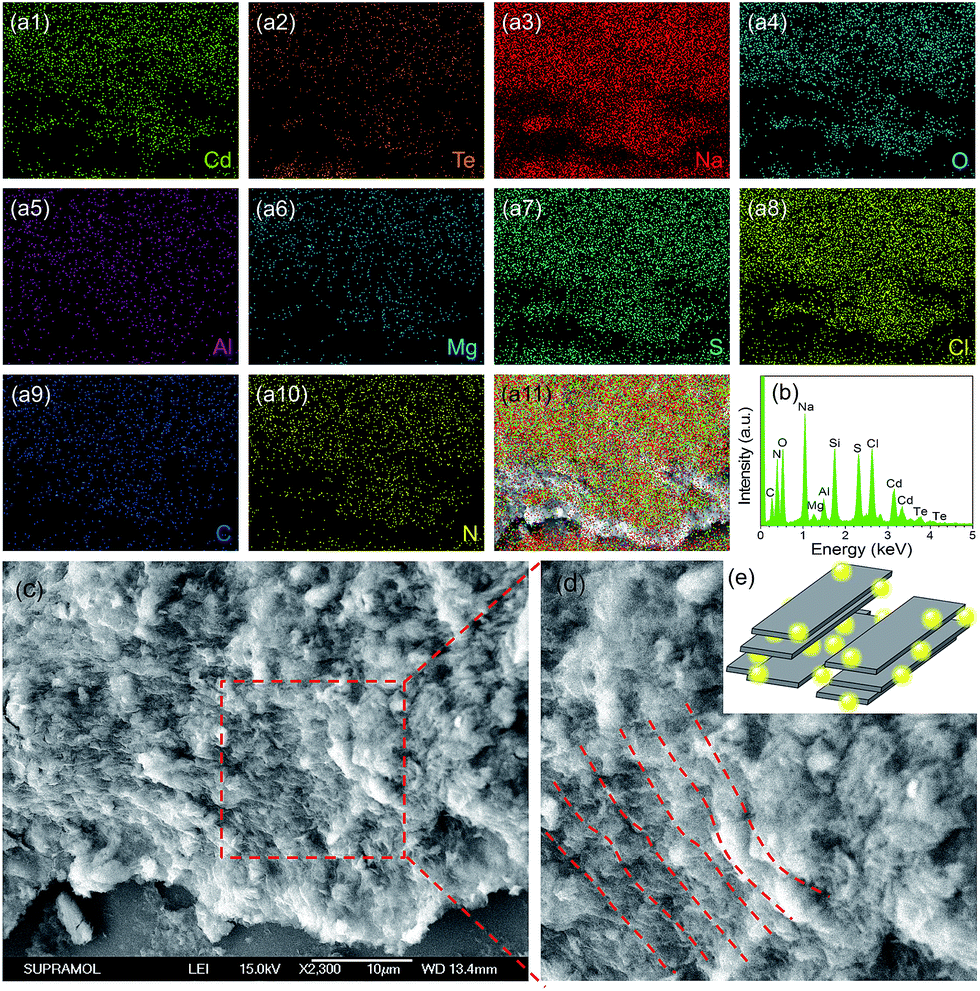
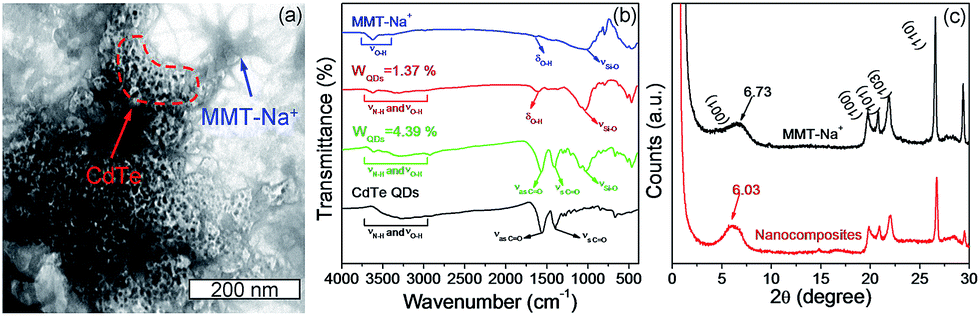
The structure and composition of QDs/MMT-Na+ nanocomposites are investigated. The SEM images in Fig. 3c and d clearly reveal that the nanocomposites are layered structures. Based on the EDS and XPS spectra, eleven kinds of elements including N, C, S, Cl, Cd, Te, Na, O, Mg, Al, and Si have been detected (Fig. 3a, b and S5†). Among these elements, N, C, S, Cl, Cd and Te can be attributed to the CdTe QDs and their ligands. Na, O, Mg, and Al are assigned to the MMT-Na+ clays.19,33 While the signal of Si mainly comes from the silicon wafer used as the substrate. By comparing the EDS mapping images and the corresponding SEM image, it can be seen that the CdTe QDs are uniformly incorporated with the MMT-Na+ clays. The TEM image in Fig. 4a reveals the same result that the CdTe QDs are well-dispersed in nanocomposites without obvious aggregation. The FTIR characterization further confirms the incorporation between CdTe QDs and MMT-Na+ clays. As shown in Fig. 4b, the FTIR spectrum of nanocomposites exhibits the characteristic bands of CdTe QDs and MMT-Na+ clays simultaneously. Among these bands, the absorption peaks in the region of 3700–3000 cm−1 belong to the bending vibration of N–H and stretching vibration of O–H. The absorption peaks at 1640 and 400––600 cm−1 are attributed to the bending vibration of O–H and Si–O. While the absorption peaks at 1568 and 1406 cm−1 are ascribed to the vibration of C![[double bond, length as m-dash]](https://www.rsc.org/images/entities/char_e001.gif) O.34–38 The XRD pattern of QDs/MMT-Na+ nanocomposites exhibits four diffraction peaks at 6.03°, 19.73°, 20.78°, and 21.93°, as same as the (001), (100), (101), and (103) crystallographic facets of MMT-Na+ clays (Fig. 4c).24,28 Based on the Bragg's equation, the basal spacing of (001) in nanocomposites is calculated to be equal with that in raw MMT-Na+ clays. This result indicates that the CdTe QDs are not intercalated into the layers but adhered on the surface of the MMT-Na+ clays.
O.34–38 The XRD pattern of QDs/MMT-Na+ nanocomposites exhibits four diffraction peaks at 6.03°, 19.73°, 20.78°, and 21.93°, as same as the (001), (100), (101), and (103) crystallographic facets of MMT-Na+ clays (Fig. 4c).24,28 Based on the Bragg's equation, the basal spacing of (001) in nanocomposites is calculated to be equal with that in raw MMT-Na+ clays. This result indicates that the CdTe QDs are not intercalated into the layers but adhered on the surface of the MMT-Na+ clays.
 |
| | Fig. 3 EDS mapping images (a1–11), EDS pattern (b) and SEM image (c and d) of CdTe QDs/MMT-Na+ nanocomposites. (d) Enlarged SEM image in (c). (e) Structural illustration of the nanocomposites. | |
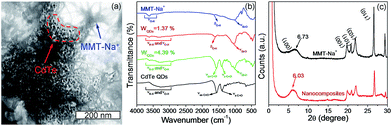 |
| | Fig. 4 (a) TEM image of CdTe QDs/MMT-Na+ nanocomposites. (b) FTIR spectra of raw MMT-Na+ clay (blue), CdTe QDs/MMT-Na+ nanocomposites (WQDs = 1.37%) (red), CdTe QDs/MMT-Na+ nanocomposites (WQDs = 4.39%) (green), CdTe QDs (black). (c) XRD patterns of raw MMT-Na+ clay (black), and CdTe QDs/MMT-Na+ nanocomposites (red). | |
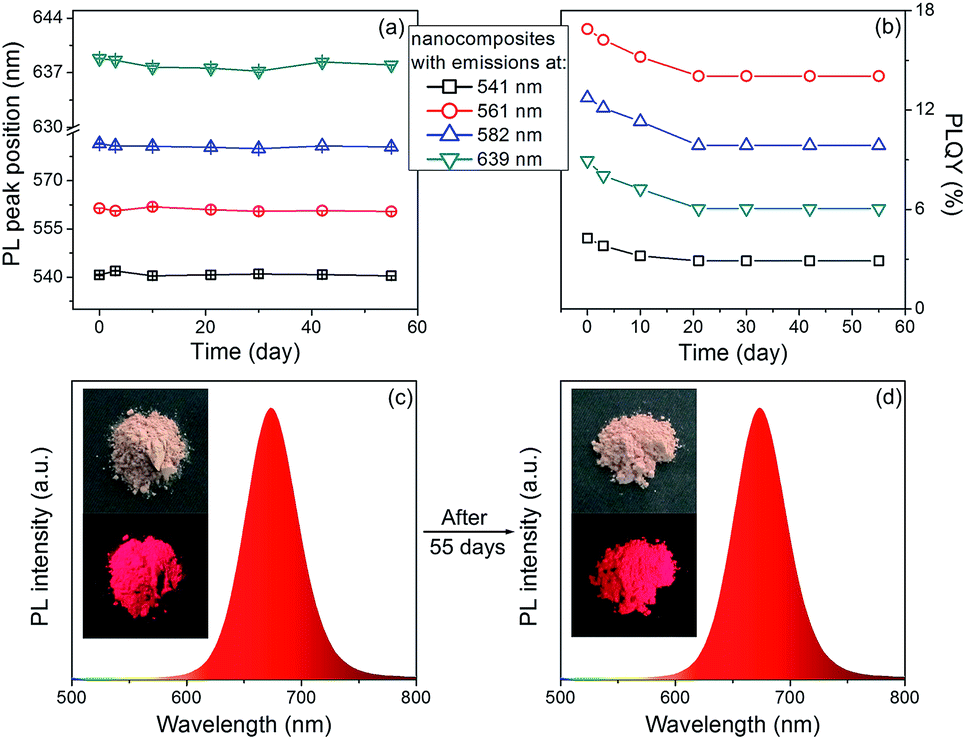
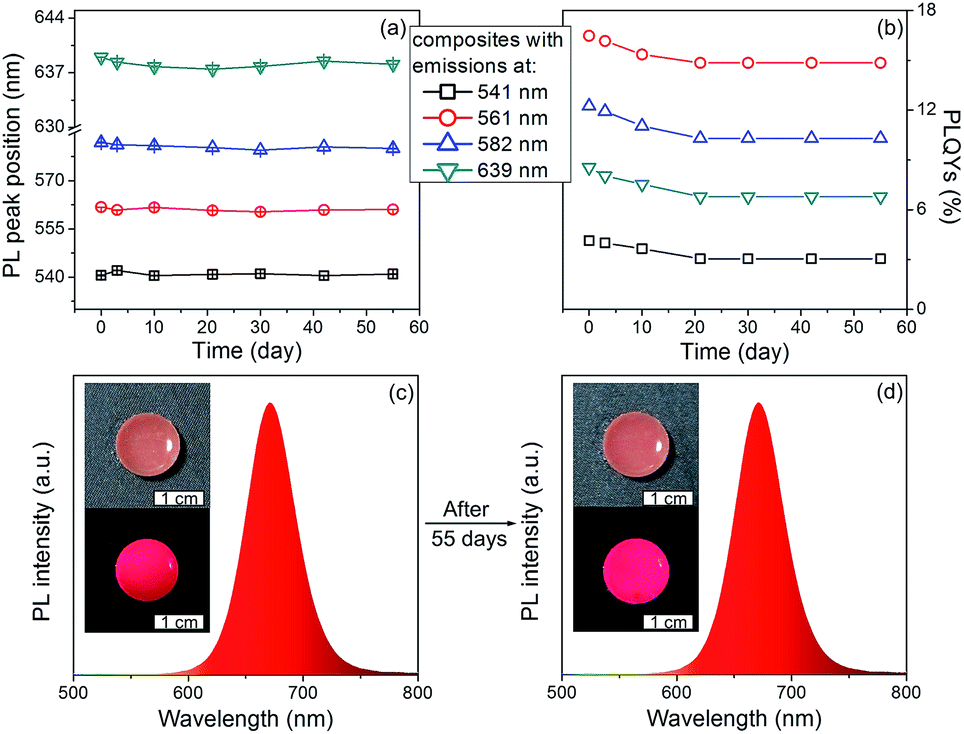
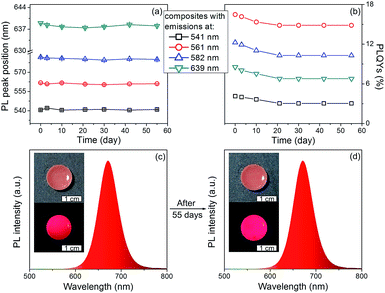
The PL stability of nanocomposites are studied. As shown in Fig. 5, the PL peak positions of the nanocomposites remain the same, only slight decrease on the PLQYs can be observed after storage for 55 days. In contrast, the PLQYs of QDs/MMT-Na+ nanocomposites using QDs synthesized by conventional reflux method decline dramatically (Fig. S6†). In addition, although the QDs/MMT-Na+ nanocomposites are prepared in aqueous solution, their PL emissions are unaffected in organic solvent (Fig. S7†). The excellent PL stability of the QDs/MMT-Na+ nanocomposites mainly comes from two factors. On one hand, the QDs are anchored on the surface of MMT-Na+ clays through the electrostatic interaction. As the host media, the MMT-Na+ clays can greatly prevent the aggregation of QDs. On the other hand, the QDs synthesized by current method are covered by N2H4, which could passivate QDs by saturating their surface dangling bonds. Because of the high PLQYs, photostability, solvent stability, and long-term stability, the as-prepared QDs/MMT-Na+ nanocomposites have been considered as the potential color conversion layer for LEDs.
 |
| | Fig. 5 PL peak positions (a) and corresponding PLQYs (b) of CdTe QDs/MMT-Na+ nanocomposites versus the storage duration at room temperature. PL spectra of CdTe QDs/MMT-Na+ nanocomposites before (c) and after (d) 55 days' sunlight irradiation. The insets in (c, d) are the photographs taken under sunlight and UV light. | |
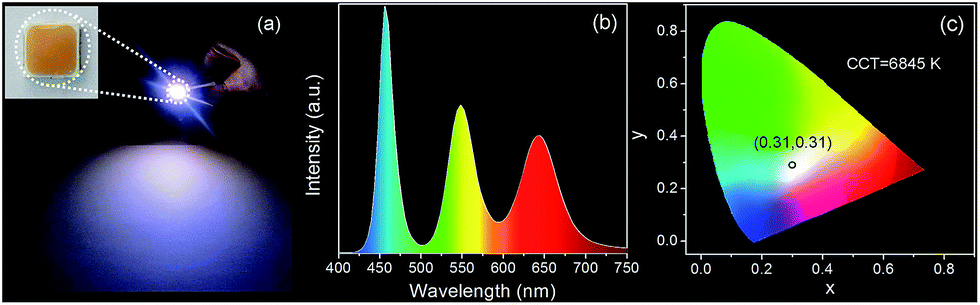
To fabricate color converters for LEDs, the QDs/MMT-Na+ nanocomposites need to be mixed with PDMS precursor solutions, then deposited on commercially available 0.2 WInGaN LED chip, and cured in an oven at 100 °C for 4 h. Notably, mixing with PDMS can further improve the PL stability of nanocomposites (Fig. 6). Following the strategy above, LEDs with green, yellow, orange, and red emissions are fabricated (Fig. 7a, d, g and j). Accordingly, their CIE chromaticity coordinates are (0.24, 0.46), (0.34, 0.38), (0.48, 0.34), and (0.51, 0.21) (Fig. 7c, f, i and l). The correlated color temperature (CCT) of these LEDs are also measured, which are 8238, 5238, and 1860 K, respectively. As an advantage, the FWHM of all the LED emissions are narrower than 42 nm (Fig. 7b, e, h and k). To fabricate high performance WLEDs, the nanocomposites with red and green emissions at a certain ratio are mixed with PDMS precursor solutions and deposited on a blue LED chip. However, the direct blending of nanocomposites with different emission colors will lead to serious light reabsorption from green-emitting QDs to red-emitting ones, which can make the apparent emission of the final LED uncontrollable. To overcome this limitation, a sequential deposition of two nanocomposites with 645 and 545 nm emission on InGaN chip are performed. That is to say, the red-emitting nanocomposites are firstly excited by InGaN chip, and then green-emitting ones. Therefore, the light reabsorption is efficiently avoided. The emission spectrum of the resulting WLED is shown in Fig. 8b. The CIE color coordinate of the WLED is located at (0.31, 0.31), which is very close to the white light region (0.33, 0.33) (Fig. 8c). The corresponding color rendering index (CRI) and CCT of the WLED are 74 and 6845 K, respectively. After continuous working for 24 hours, the CIE color coordinate of the WLED remain the same, which strongly indicates that the WLED possesses the great operational stability (Fig. S8†).
 |
| | Fig. 6 PL peak positions (a) and corresponding PLQYs (b) of the composite materials prepared by curing the mixture of CdTe QDs/MMT-Na+ nanocomposites and PDMS versus the storage duration at room temperature. PL spectra of the composite materials before (c) and after (d) 55 days' sunlight irradiation. The insets in (c and d) are the photographs taken under sunlight and UV light. | |
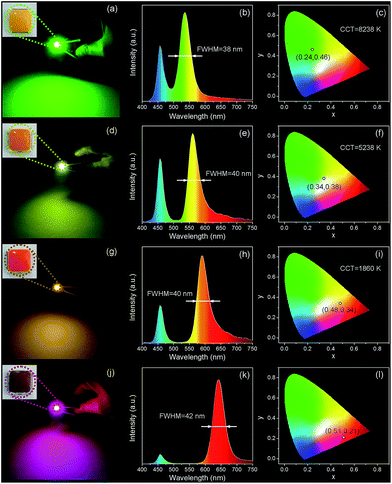 |
| | Fig. 7 LEDs with green (a), yellow (d), orange (g) and red (j) emissions. Insets in (a, d, g and j) are the photographs of those LEDs taken under sunlight. Luminescence spectra of those LEDs with green (b), yellow (e), orange (h) and red (k) emissions. (c, f, i and l) CIE chromaticity diagram showing the (x, y) color coordinates of LEDs and the corresponding CCT values. | |
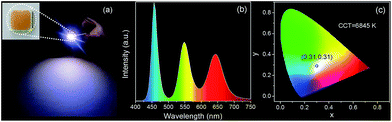 |
| | Fig. 8 (a) Photograph of WLEDs. The inset in (a) is the photograph of WLEDs taken under sunlight. Corresponding emission spectrum (b), and color coordinate (c) of the WLEDs. | |
Conclusions
In summary, the CdTe QDs/MMT-Na+ nanocomposites are used as the color convertors in commercial LEDs for the first time. By introducing CdTe QDs with different sizes into MMT-Na+ clays through the electrostatic interactions, the fluorescence colors of nanocomposites can be tunable from green to red. Different from the conventional reflux growth, the CdTe QDs herein are synthesized through the N2H4-promoted strategy, which can efficiently protect the QDs from oxidation, leading to their improved PL stability. Moreover, the freeze drying instead of the precipitation pathway is employed for the separation of nanocomposites from solvent. Thus the aggregation induced by the centrifugation process can be avoided efficiently. After mixing with PDMS, the CdTe QDs/MMT-Na+ nanocomposites exhibit impressive potential in the field of LEDs. LEDs with different emissions are prepared, and WLEDs with color coordinates of (0.31, 0.31) and the CRI of 74 are fabricated, which could potentially be adopted as the display.
Acknowledgements
This work was supported by the National key research and development program of China (2016YFB0401701), NSFC (51425303, 21374042), Natural Science Foundation of Jilin Province (20140101048JC), the Special Project from MOST of China, and China's General Administration of Quality Supervision, Inspection and Quarantine Bureau of Science and Technology Planning Project (2014IK135).
Notes and references
- M. H. Crawford, IEEE J. Sel. Top. Quantum Electron., 2009, 15, 1028–1040 CrossRef CAS.
- M. R. Krames, O. B. Shchekin, R. Mueller-Mach, G. O. Mueller, L. Zhou, G. Harbers and M. G. Craford, J. Disp. Technol., 2007, 3, 160–175 CrossRef CAS.
- S. Ye, F. Xiao, Y. X. Pan, Y. Y. Ma and Q. Y. Zhang, Mater. Sci. Eng., R, 2010, 71, 1–34 CrossRef.
- K. T. Kamtekar, A. P. Monkman and M. R. Bryce, Adv. Mater., 2010, 22, 572–582 CrossRef CAS PubMed.
- R. J. Xie and N. Hirosaki, Sci. Technol. Adv. Mater., 2007, 8, 588–600 CrossRef CAS.
- A. Laubsch, M. Sabathil, J. Baur, M. Peter and B. Hahn, IEEE Trans. Electron Devices, 2010, 57, 79–87 CrossRef CAS.
- J. K. Sheu, S. J. Chang, C. H. Kuo, Y. K. Su, L. W. Wu, Y. C. Lin, W. C. Lai, J. M. Tsai, G. C. Chi and R. K. Wu, IEEE Photonics Technol. Lett., 2003, 15, 18–20 CrossRef.
- C. C. Lin and R. S. Liu, J. Phys. Chem. Lett., 2011, 2, 1268–1277 CrossRef CAS PubMed.
- B. M. van der Ende, L. Aarts and A. Meijerink, Phys. Chem. Chem. Phys., 2009, 11, 11081–11095 RSC.
- Y. Shirasaki, G. J. Supran, M. G. Bawendi and V. Bulovic, Nat. Photonics, 2013, 7, 13–23 CrossRef CAS.
- A. J. Shields, Nat. Photonics, 2007, 1, 215–223 CrossRef CAS.
- Q. Sun, Y. A. Wang, L. S. Li, D. Y. Wang, T. Zhu, J. Xu, C. H. Yang and Y. F. Li, Nat. Photonics, 2007, 1, 717–722 CrossRef CAS.
- A. R. Clapp, I. L. Medintz, J. M. Mauro, B. R. Fisher, M. G. Bawendi and H. Mattoussi, J. Am. Chem. Soc., 2004, 126, 301–310 CrossRef CAS PubMed.
- D. Zhou, H. Y. Zou, M. Liu, K. Zhang, Y. Sheng, J. L. Cui, H. Zhang and B. Yang, ACS Appl. Mater. Interfaces, 2015, 7, 15830–15839 CAS.
- A. C. Balazs, T. Emrick and T. P. Russell, Science, 2006, 314, 1107–1110 CrossRef CAS PubMed.
- J. Lee, V. C. Sundar, J. R. Heine, M. G. Bawendi and K. F. Jensen, Adv. Mater., 2000, 12, 1102–1105 CrossRef CAS.
- X. T. Luo, J. S. Han, Y. Ning, Z. Lin, H. Zhang and B. Yang, J. Mater. Chem., 2011, 21, 6569–6575 RSC.
- H. Zhang, J. S. Han and B. Yang, Adv. Funct. Mater., 2010, 20, 1533–1550 CrossRef CAS.
- S. S. Ray and M. Okamoto, Prog. Polym. Sci., 2003, 28, 1539–1641 CrossRef CAS.
- S. S. Ray and M. Bousmina, Prog. Mater. Sci., 2005, 50, 962–1079 CrossRef CAS.
- H. Y. Xie, J. Yang, S. Y. Yang, C. F. Wang, L. Chen and S. Chen, Mater. Lett., 2011, 65, 1669–1671 CrossRef CAS.
- A. Ontam, N. Khaorapapong and M. Ogawa, J. Mater. Chem., 2012, 22, 20001–20007 RSC.
- Y. C. Cao, J. Colloid Interface Sci., 2012, 368, 139–143 CrossRef CAS PubMed.
- H. Y. Li, J. J. Liu, K. J. Wang, X. J. Yu, S. L. Zuo and B. S. Li, Mater. Lett., 2013, 107, 284–286 CrossRef CAS.
- R. C. Chikate, B. S. Kadu and M. A. Damle, RSC Adv., 2014, 4, 35997–36005 RSC.
- J. Kabilaphat, N. Khaorapapong, A. Ontam and M. Ogawa, Eur. J. Inorg. Chem., 2015, 1631–1637, DOI:10.1002/ejic.201403164.
- Y. W. Guo, X. S. Ge, J. Guan, L. Wu, F. H. Zhao, H. Li, X. D. Mu, Y. J. Jiang and A. B. Chen, Carbohydr. Polym., 2016, 145, 13–19 CrossRef CAS PubMed.
- F. Gao, C. F. Lv, J. X. Han, X. Y. Li, Q. Wang, J. Zhang, C. Chen, Q. Li, X. F. Sun, J. C. Zheng, L. R. Bao and X. Li, J. Phys. Chem. C, 2011, 115, 21574–21583 CAS.
- D. Zhou, M. Lin, Z. L. Chen, H. Z. Sun, H. Zhang, H. C. Sun and B. Yang, Chem. Mater., 2011, 23, 4857–4862 CrossRef CAS.
- H. Zhang, Y. Liu, J. Zhang, C. Wang, M. Li and B. Yang, J. Phys. Chem. C, 2008, 112, 1885–1889 CAS.
- J. C. de Mello, H. F. Wittmann and R. t. Friend, Adv. Mater., 1997, 3, 230–232 CrossRef.
- D. V. Talapin, A. L. Rogach, A. Kornowski, M. Haase and H. Weller, Nano Lett., 2001, 1, 207–211 CrossRef CAS.
- J. M. Goddard and J. H. Hotchkiss, Prog. Polym. Sci., 2007, 32, 698–725 CrossRef CAS.
- P. Bala, B. K. Samantaray and S. K. Srivastava, Bull. Mater. Sci., 2000, 23, 61–67 CrossRef CAS.
- L. M. Zhou, H. Chen, X. H. Jiang, F. Lu, Y. F. Zhou, W. M. Yin and X. Y. Ji, J. Colloid Interface Sci., 2009, 332, 16–21 CrossRef CAS PubMed.
- B. A. Bhanvase, D. V. Pinjari, P. R. Gogate, S. H. Sonawane and A. B. Pandit, Chem. Eng. J., 2012, 181, 770–778 CrossRef.
- J. M. Yeh, C. T. Yao, C. F. Hsieh, L. H. Lin, P. L. Chen, J. C. Wu, H. C. Yang and C. P. Wu, Eur. Polym. J., 2008, 44, 3046–3056 CrossRef CAS.
- M. C. Lai, K. C. Chang, J. M. Yeh, S. J. Liou, M. F. Hsieh and H. S. Chang, Eur. Polym. J., 2007, 43, 4219–4228 CrossRef CAS.
Footnotes |
| † Electronic supplementary information (ESI) available: The PL images, PL spectra, XRD pattern, and TEM image of aqueous CdTe QDs. The comparison of the PL properties of the nanocomposites and QDs powders. The optical and PL images of the nanocomposites. The XPS spectra of the nanocomposites. The stability of the nanocomposites. See DOI: 10.1039/c6ra26911g |
| ‡ These authors contributed equally to this work and should be considered co-first authors. |
|
| This journal is © The Royal Society of Chemistry 2017 |
Click here to see how this site uses Cookies. View our privacy policy here. 
 Open Access Article
 This Open Access Article is licensed under a Creative Commons Attribution-Non Commercial 3.0 Unported Licence
 *a,
Xun Zhangd,
Bai Yanga and
Hao Zhanga
*a,
Xun Zhangd,
Bai Yanga and
Hao Zhanga