 Open Access Article
Creative Commons Attribution 3.0 Unported Licence
pH-Responsive and pyrene based electrospun nanofibers for DNA adsorption and detection†
Cheng-Ting Yeh and
Ching-Yi Chen *
*
Department of Chemical Engineering, National Chung Cheng University, Chia-Yi County, 621, Taiwan. E-mail: chmcyc@ccu.edu.tw; Fax: +886-5-2721206; Tel: +886-5-2720411 ext. 33409
First published on 18th January 2017
Abstract
A facile and labeling-free DNA adsorption and detection method is developed by pH-responsive and luminescent electrospun (ES) nanofiber mats fabricated using poly((2-(dimethylamino)ethyl methacrylate)-co-(stearyl acrylate)-co-((1-pyrene)methyl 2-methyl-2-propenoate)) (poly(DMAEMA-co-SA-co-Py)). FE-SEM images show the ES nanofibers have good wettability and integrity in aqueous solution with smooth and bead-free morphology. A decrease in the excimer-to-monomer fluorescent intensity ratio of pyrene moiety from pH 7 to pH 5 indicates a deswelling–swelling transition behavior due to protonation of DMAEMA segment. However, an obvious increase of excimer-to-monomer ratio is observed in the presence of DNA because of the electrostatic interaction between cationic fibers and negative charged phosphate groups from DNA. The detachment of DNA could be modulated by adjusting the pH value to 7. These results indicate this new ES nanofibrous mat has the potential applications for DNA adsorption, detection and separation.
Introduction
Electrospinning (ES) is a well-known and simple technique that utilizes electrostatic forces to produce various functional and composite nanofibrous films.1–5 In this process, a high electrical field is applied to polymer solution or melts to create a polymer jet at spinneret, which is then elongated until reaching the collector to form a continuous and ultrafine fiber.1 Unlike conventional solution- and melt-spinning techniques, ES process is capable of generating fibers with a diameter ranging from tens of nanometers to a few microns.4 In addition, ES nanofibers with three-dimensional scaffolds have been proved to possess high porosity and large surface area that is approximately 1 to 2 orders of magnitude larger than that of the continuous thin films.6 These unique characteristics render ES nanofibers feasible for adsorption/separation of various heavy metal ions,6,7 pollutants,8 microorganism9 and biomolecules (e.g. DNA,10 and large proteins11,12).Deoxyribonucleic acid (DNA) is a biopolymer containing genetic information that plays an important role in many applications ranging from medical, genetic, diagnostic, environmental, agriculture and food sciences. Immobilized DNA is demanded for development of DNA chips and arrays, DNA sensors and gene therapy. Although surface-modified substrate (e.g. cationic polymer coated surface) or continuous thin films have been reported,13,14 low adsorption/binding capacity is still main disadvantages due to their low surface area. ES nanofibers with high surface area-to-volume ratio are favorable for DNA detection/immobilization. However, little attention has been devoted to utilizing ES nanofibers as solid supports for DNA detection/immobilization. Uyar et al. reported surface modification of ES cellulose acetate nanofibers with cationic polymer brush was used for DNA adsorption.10 They demonstrated the enhanced DNA adsorption capacity and reusability of the nanofibers, which provided a facile method for DNA immobilization. Kong et al. reported a fibrous membrane of polyethylene glycol-modified polyethylenimine via electrospinning was utilized to immobilize DNA onto it for effective gene delivery.15 They suggested the combination of non-viral gene therapy and ES nanofibrous scaffolds has potential applications in tissue regeneration. Chen et al. utilized a aligned ES fluorescent nanofibers via blends of cationic polyfluorene derivatives and poly(methyl methacrylate) for DNA detection.16 They showed micromolar DNA detection range of nanofibers. In addition to DNA detection/immobilization, ES nanofibers can be used as adsorptive membrane for purification or separation of DNA, which is favorable for gene therapeutic agent production.
Pyrene is a good candidate as a fluorescent probe because it shows high sensitivity to the micro-environment17,18 and has a strong tendency to form excimer via intermolecular π–π stacking,17,19 which exhibits a broad, structureless and red-shifted fluorescent emission with respect to that of monomeric pyrene. The unique monomer and excimer emissions at different wavelength are considerably dependent on the relative distance and geometry between pyrene molecules.20 In the past decades, several pyrene-based DNA sensors have been developed.21–23 For example, we reported the cationic charged amino moiety at the periphery of the dendrons with functional pyrene as fluorescent probe for DNA detection.23 Most of these pyrene-based DNA sensors are still operated in solutions that limit their applications. Recently, pyrene-labeled ES nanofibers have been developed via physical doping or covalent attachment of pyrene to nanofibers for TNT and metal ions detection.6,24 However, its applications for DNA detection have not been explored yet.
Herein, the aim of this study is to fabricate a fluorescent-labeled ES nanofiber mat that not only provides fluorescent signal to detect DNA, but adsorbs/detaches DNA for purification or separation. A series of pH-responsive and luminescent random copolymers poly((2-(dimethylamino)ethyl methacrylate)-co-(stearyl acrylate)-co-((1-pyrene)methyl 2-methyl-2-propenoate)) (P(DMAEMA-co-SA-co-Py), Pm1–Pm3) with different molar ratios of SA has been synthesized via free radical polymerization. The pH-responsive DMAEMA segment with a pKa around 7.3–7.5 25,26 is utilized to form cationic amino groups for DNA adsorption where the degree of ionization could be manipulated by pH ranging from 7 to 5. In addition, the physical cross-linkable SA segment plays an important role to maintain the integrity of nanofibers as immersed in aqueous environment. The chemical structures and properties of all copolymers were characterized by 1H-NMR, gel permeation chromatography (GPC), differential scanning calorimetry (DSC) and thermogravimetric analysis (TGA). The morphology of ES nanofibers with different SA content was investigated by field-emission scanning electron microscope (FE-SEM) and photoluminescence spectroscopy (PL) at pH ranging from 7 to 5, showing deswelling–swelling characteristics and change of pyrene excimer emission due to the different degree of ionization. DNA adsorption/detection on cationic nanofibers has been characterized in terms of FE-SEM, PL, and laser confocal microscope.
Experimental
Materials
Azobisisobutyronitrile (AIBN) (Aldrich, 98%) was recrystallized from acetone. 2-(Dimethylamino)ethyl methacrylate (DMAEMA) (Acros, 99%) and stearyl acrylate (SA) (Aldrich, 97%) were purified by passing through an aluminum oxide column to remove the antioxidant/inhibitor. Methacryloyl chloride (Alfa Aesar, 97%) was purified by distillation prior to use. (1-Pyrene)methyl 2-methyl-2-propenonate (Py) was prepared according to the previous report.27 Benzyl-triethylammonium chloride (Aldrich, 99%), sodium borohydride (Acros, 99%) and pyrene-1-carbaldehyde (Alfa Aesar, 99%) were used as received. Triethylamine (J. T. Baker, 99%) and tetrahydrofuran (Macron) were dried over CaH2 and then distilled under N2 before used. Deoxyribonucleic acid (DNA) sodium salt from salmon testes was purchased from Sigma-Aldrich and used as received. Common organic solvents were obtained commercially and used as received unless otherwise noted.Synthesis of poly(DMAEMA-co-SA-co-Py) copolymers
Poly(DMAEMA-co-SA-co-Py) (Pm1–Pm3) was synthesized by free radical polymerization with different monomer ratios of DMAEMA, SA and Py monomers as listed in Table 1. The concentration of AIBN used as the initiator was 0.003 M and the monomer to initiator ratio was fixed at 450/1. Typically for synthesis of Pm3, DMAEMA (3.99 g, 25.4 mmol), SA (2.21 g, 6.81 mmol), Py (573 mg, 1.91 mmol) and AIBN (12.4 mg) were added to Schlenk tube and dissolved in 24 mL benzene. Nitrogen was bubbled through the mixture for 30 min, and then degassed by three freeze–pump–thaw cycles. The reaction was stirred under positive nitrogen pressure and placed into an oil bath at 65 °C for 18 h. Then, the reaction solution was precipitated into hexane and filtered to remove residual monomers. The obtained copolymer was dried in vacuum oven at 40 °C to yield white powder 4.9 g with yield of 73%.| Samples | Feed molar ratio, DMAEMA![[thin space (1/6-em)]](https://www.rsc.org/images/entities/char_2009.gif) : :![[thin space (1/6-em)]](https://www.rsc.org/images/entities/char_2009.gif) SA SA![[thin space (1/6-em)]](https://www.rsc.org/images/entities/char_2009.gif) : :![[thin space (1/6-em)]](https://www.rsc.org/images/entities/char_2009.gif) Py Py |
Calculated ratio,a DMAEMA![[thin space (1/6-em)]](https://www.rsc.org/images/entities/char_2009.gif) : :![[thin space (1/6-em)]](https://www.rsc.org/images/entities/char_2009.gif) SA SA![[thin space (1/6-em)]](https://www.rsc.org/images/entities/char_2009.gif) : :![[thin space (1/6-em)]](https://www.rsc.org/images/entities/char_2009.gif) Py Py |
Mnb (g mol−1) | PDI | Td (°C) | Tg (°C) |
|---|---|---|---|---|---|---|
| a Molar ratio (%) estimated from 1H-NMR.b Determined by GPC with THF eluent.c Not determined. | ||||||
| Pm1 | 93.0![[thin space (1/6-em)]](https://www.rsc.org/images/entities/char_2009.gif) : :![[thin space (1/6-em)]](https://www.rsc.org/images/entities/char_2009.gif) 0 0![[thin space (1/6-em)]](https://www.rsc.org/images/entities/char_2009.gif) : :![[thin space (1/6-em)]](https://www.rsc.org/images/entities/char_2009.gif) 7.0 7.0 |
92.1![[thin space (1/6-em)]](https://www.rsc.org/images/entities/char_2009.gif) : :![[thin space (1/6-em)]](https://www.rsc.org/images/entities/char_2009.gif) 0 0![[thin space (1/6-em)]](https://www.rsc.org/images/entities/char_2009.gif) : :![[thin space (1/6-em)]](https://www.rsc.org/images/entities/char_2009.gif) 7.9 7.9 |
18![[thin space (1/6-em)]](https://www.rsc.org/images/entities/char_2009.gif) 800 800 |
2.54 | 256 | 24.8 |
| Pm2 | 86.8![[thin space (1/6-em)]](https://www.rsc.org/images/entities/char_2009.gif) : :![[thin space (1/6-em)]](https://www.rsc.org/images/entities/char_2009.gif) 6.7 6.7![[thin space (1/6-em)]](https://www.rsc.org/images/entities/char_2009.gif) : :![[thin space (1/6-em)]](https://www.rsc.org/images/entities/char_2009.gif) 6.5 6.5 |
87.3![[thin space (1/6-em)]](https://www.rsc.org/images/entities/char_2009.gif) : :![[thin space (1/6-em)]](https://www.rsc.org/images/entities/char_2009.gif) 5.3 5.3![[thin space (1/6-em)]](https://www.rsc.org/images/entities/char_2009.gif) : :![[thin space (1/6-em)]](https://www.rsc.org/images/entities/char_2009.gif) 7.4 7.4 |
14![[thin space (1/6-em)]](https://www.rsc.org/images/entities/char_2009.gif) 900 900 |
2.01 | 277 | 12.1 |
| Pm3 | 74.4![[thin space (1/6-em)]](https://www.rsc.org/images/entities/char_2009.gif) : :![[thin space (1/6-em)]](https://www.rsc.org/images/entities/char_2009.gif) 20 20![[thin space (1/6-em)]](https://www.rsc.org/images/entities/char_2009.gif) : :![[thin space (1/6-em)]](https://www.rsc.org/images/entities/char_2009.gif) 5.6 5.6 |
79.0![[thin space (1/6-em)]](https://www.rsc.org/images/entities/char_2009.gif) : :![[thin space (1/6-em)]](https://www.rsc.org/images/entities/char_2009.gif) 14.0 14.0![[thin space (1/6-em)]](https://www.rsc.org/images/entities/char_2009.gif) : :![[thin space (1/6-em)]](https://www.rsc.org/images/entities/char_2009.gif) 7.0 7.0 |
35![[thin space (1/6-em)]](https://www.rsc.org/images/entities/char_2009.gif) 500 500 |
1.89 | 286 | —c |
Preparation of electrospun nanofibers
Poly(DMAEMA-co-SA-co-Py) copolymers were dissolved in chloroform with polymer concentration of 250 mg mL−1 and 5 wt% benzyl triethylammonium chloride (BTEAC, corresponding to polymer) was added to enhance the conductivity of electrospun solution. The solution conductivity was 9.5 μs cm−1 measured by Clean CON500 conductivity meter. The mixture was stirred for one day to give a clear homogeneous solution before preparing the ES nanofibers. The ES nanofibers were prepared using a single-capillary spinneret. First, the polymer solution was fed into the syringe pump (Chemyx Fusion 100, USA) connected to a 22 gauge metallic needle, with feed rate of 0.3 mL h−1. The metallic needle was connected to a high voltage power supply (You-Shang Technical Corp., Taiwan) with voltage set at 11 kV, and a piece of aluminum foil or glass was placed 15 cm below the tip of the needle (working distance) to collect the ES nanofibers. All experiments were carried out at room temperature (27 °C) and around 43% relative humidity. The prepared nanofibers were sealed with nitrogen and stored under 0 °C in dark.Preparation of dip-coating films
For comparison with the properties of the ES nanofibers, the corresponding polymer films were prepared on glass substrate with the same concentration of copolymer (250 mg mL−1) mixture by dip-coating method. The glass substrate was dipped in the polymer solution for 3 min and then the substrate was drawn at the rate of 3 cm min−1 by the syringe pump. The prepared films were dried in an airflow hood and the thickness was 3.3 μm measured by FE-SEM (Hitachi S-4800). The prepared films were sealed with nitrogen and stored under 0 °C in dark.General characterization
1H NMR spectra were measured in CDCl3 by Bruker-DPX-400 instrument spectrometer. GPC analysis was performed with a Waters 1420 pump and a Waters 2410 refractive index detector, in reference with a series of PS standards and THF as the eluent at the flow rate of 1 mL min−1 at 35 °C. Thermogravimetric analysis was carried out by Dupont TA instrument TGA 2050 analyzer with heating range from 100 to 800 °C at a heating rate of 10 °C min−1 under dry nitrogen rate of 90 mL min−1. Differential scanning calorimetry was performed on a TA instruments-Modulated DSC 2910. DSC curve of each sample was obtained from the second heating run at a rate of 5 °C min−1 from −35 to 160 °C under dry nitrogen rate of 50 mL min−1. Lower critical solution temperature (LCST) and upper critical solution temperature (UCST) of prepared polymer solution was determined by monitoring the transmittance at 500 nm with a UV-vis spectrometer (JASCO V-650) equipped with an EHCS-760 Thermostat. The concentration of polymer in water was 4 mg mL−1. The temperature was raised from 15 to 60 °C in every 2.5 °C increment and all samples were equilibrated for 5 min before measurement. LCSTs and UCSTs of polymer solutions were determined at the temperature showing 50% optical transmittance of polymer solution.Morphological characterization
The morphologies of the ES nanofibers were characterized by field-emission scanning electron microscopy (FE-SEM, Hitachi S-4800). The images were taken using a microscope operated at an accelerating voltage of 15 kV. Before imaging, the samples were sputtered with Pt. The average diameter of nanofibers was estimated over fifty fibers in SEM images from each sample. For sample preparation, the ES nanofibers on aluminum foil were immersed in different pH or DNA solution for certain minutes and then quickly put into a flask containing liquid nitrogen. The frozen samples were lyophilized to maintain their original morphology. Fluorescent microscope images of the ES nanofibers were taken using Olympus FV1000 Confocal Microscope. A 405 nm laser diode was used to excite pyrene moiety.Photophysical properties
Photoluminescence spectra (PL) were recorded on a Hitachi F-4500 spectrophotometer at excitation wavelength of 341 nm. The ES nanofibers on glass substrate or dip-coating films were inserted diagonally in the cuvettes and fixed to ensure the detection at the same position during every measurement. 3 mL of aqueous solution with different pH value or DNA solution with different concentration was filled the cuvette and the fibers or films were incubated for 3 min before measurement.Results and discussion
Characterization of poly(DMAEMA-co-SA-co-Py) copolymers
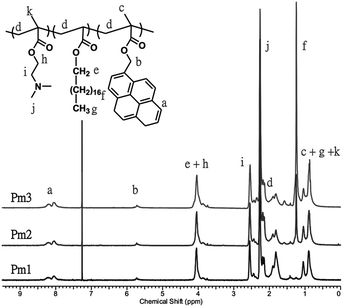
A series of pH-responsive and pyrene-based copolymers, poly((2-(dimethylamino)ethyl methacrylate)-co-(stearyl acrylate)-co-((1-pyrene)methyl 2-methyl-2-propenoate)) (poly(DMAEMA-co-SA-co-Py), Pm1–Pm3), was synthesized via free radical polymerization with feeding ratio of monomer to initiator fixed at 450/1. In addition, the feeding ratio of DMAEMA to Py was fixed at 40/3 in order to keep the copolymers to have the same ratio of fluorescent probes and pH-responsive properties, while varied with different SA content, which showed physical cross-linking function to prevent the dissolution of the ES nanofibers and regulate the volume change in different pH value. The obtained copolymers were fully characterized by gel permeation chromatography (GPC) and 1H-NMR spectra. Fig. 1 shows 1H-NMR spectra of the copolymers in CDCl3. The chemical compositions of the copolymers were determined by comparing the proton signal of aromatic ring on pyrene units observed at approximately 7.99–8.34 ppm (peak a), the methylene protons of DMAEMA at 2.54 ppm (peak i) to the protons of alkyl side chain from SA moiety at 1.25 ppm (peak f). The calculated copolymer compositions from the proton peak integration are consistent with the initial feed ratios, indicating the successful synthesis of the copolymers. The calculated molar fractions of SA moiety to Pm1–Pm3 copolymers are 0 mol%, 5.3 mol% and 14 mol%, respectively. The number-average molecular weights (Mn) of the Pm1–Pm3 copolymers evaluated by GPC are 18![[thin space (1/6-em)]](https://www.rsc.org/images/entities/char_2009.gif) 800, 14
800, 14![[thin space (1/6-em)]](https://www.rsc.org/images/entities/char_2009.gif) 900, and 35
900, and 35![[thin space (1/6-em)]](https://www.rsc.org/images/entities/char_2009.gif) 500 g mol−1, with the corresponding PDI of 2.54, 2.01, and 1.89, respectively. The chemical compositions, molecular weight, and thermal properties are summarized in Table 1. The thermal properties of the copolymers were investigated by TGA and DSC (Fig. S1 and S2 in the ESI†). The thermal decomposition temperature (Td) of the copolymers increased from 256 to 286 °C with increasing SA content. On the other hand, the glass transition temperature (Tg) of Pm1 and Pm2 copolymers was 24.8 and 12.1 °C, respectively. Pm1 has a higher Tg than reported PDMAEMA homopolymer (14 °C)28 because of the incorporation of rigid pyrene moiety. However, a broad endothermic peak was appeared at Pm3 copolymer, which had 14 mol% of SA content and the long alkyl chain caused formation of a crystalline aggregation structure. No obvious Tg was observed and thus we suggested its Tg was below 15 °C.
500 g mol−1, with the corresponding PDI of 2.54, 2.01, and 1.89, respectively. The chemical compositions, molecular weight, and thermal properties are summarized in Table 1. The thermal properties of the copolymers were investigated by TGA and DSC (Fig. S1 and S2 in the ESI†). The thermal decomposition temperature (Td) of the copolymers increased from 256 to 286 °C with increasing SA content. On the other hand, the glass transition temperature (Tg) of Pm1 and Pm2 copolymers was 24.8 and 12.1 °C, respectively. Pm1 has a higher Tg than reported PDMAEMA homopolymer (14 °C)28 because of the incorporation of rigid pyrene moiety. However, a broad endothermic peak was appeared at Pm3 copolymer, which had 14 mol% of SA content and the long alkyl chain caused formation of a crystalline aggregation structure. No obvious Tg was observed and thus we suggested its Tg was below 15 °C.
The temperature-responsive behaviors of Pm1–Pm3 copolymers in pH 7 and pH 5 aqueous solutions were evaluated by temperature-controlled UV-visible spectroscopy. The LCSTs (lower critical solution temperatures) and UCSTs (upper critical solution temperatures) were determined by observing the 50% optical transmittance of copolymer solutions at 500 nm as a function of temperature (Fig. 2). It was found that the change in solution pH affected the phase transition of the copolymers. At pH 7, the LCSTs were decreased from 40.2, 33.6, to 25.8 °C with increasing SA content due to its hydrophobic characteristic of long alkyl side chain that facilitated chain aggregation in aqueous solution and reduced the LCST. At pH 5, no LCST of Pm1 copolymer was observed in the studied temperature range from 15 to 60 °C, indicating their strong hydrophilicity due to the protonation of PDMAEMA segments. Interestingly, Pm2 and Pm3 exhibited UCST characteristics, which were found insoluble at low temperature and became soluble as temperature above 23.0 and 32.2 °C, respectively. This might be attributed to the physically crosslinking via hydrophobic interaction of the stearyl side chains,28,29 resulting in the aggregation of the copolymers in water at low temperature. However, when the temperature was raised, the intermolecular hydrophobic interactions no longer existed and hydrophilicity of protonated DMAEMA became dominant, leading the copolymers to rehydrate in aqueous solution.
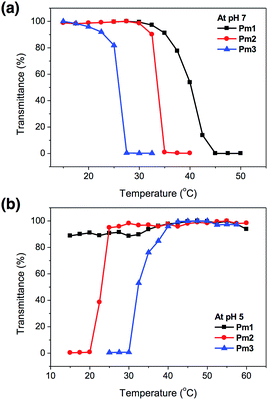 | ||
| Fig. 2 Phase transition of Pm1–Pm3 copolymers as a function of temperature in (a) pH 7 and (b) pH 5 solution. | ||
Morphology of poly(DMAEMA-co-SA-co-Py)
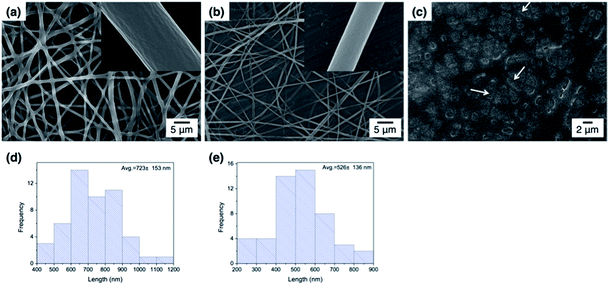
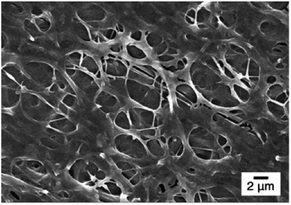
Fig. 3 shows the FE-SEM images of poly(DMAEMA-co-SA-co-Py) nanofibers fabricated by electrospinning with BTEAC salt added to increase the conductivity of the polymer solution in methanol. Pm1 and Pm2 nanofibers have average diameters of 723 ± 153 and 526 ± 136 nm in a dry state, respectively. The average diameter of nanofibers was estimated over fifty fibers from each sample. The inset SEM images show a smooth and nonporous surface of as-prepared Pm1 and Pm2 nanofibers. However, unclear and collapsed fibrous structures were observed on Pm3, because it has much lower Tg than room temperature. Nevertheless, stearyl acrylate has been reported to exhibit the shape memory effect and the formation of crystalline aggregates among the long alkyl side chains would locks its shape.30 Thus, we believe the fibers could maintain their cylindrical shape even at room temperature.Since the ionic interaction of the ES nanofibers are required for DNA adsorption, the cationic amino group of DMAEMA segments should be established under acidic environment. Although physical cross-linked SA moiety was introduced to improve the stability of those ES fibers, both thermo- and pH-responsive properties of DMAEMA segments might affect the fiber morphology at different pH solution. In this study, the effect of pH on fiber morphology was evaluated at pH 7 and pH 5, which were below the pKa of DMAEMA (around 7.3–7.5 in water).25,26 As shown in Fig. 4a, Pm1 without physical crosslinking moiety was dissolved in water and could not maintain the fibrous shape at pH 5 or 7 due to protonation of DMAEMA units that increased the hydrophilicity of the nanofibers. Moreover, the LCSTs of Pm1 at pH 5 or 7 were higher than room temperature, also resulting in hydrophilic characteristic of Pm1 fibers. Fig. 4b shows Pm2 nanofibers were also dissolved at pH 7, but a partial dissolution of fibers was observed at pH 5. The reasons that cause this phenomenon are still not clear, but we suggest three interactions, including (i) hydrogen-bonding interaction between DMAEMA and water molecules that influences the LCST, (ii) electrostatic repulsion from the protonation of DMAEMA, and (iii) hydrophobic interaction among the long alkyl side chain of SA, might compete to affect the hydrophilic/hydrophobic balance of the nanofibers. In pH 7 solution at room temperature, less protonation of DMAEMA segments rendered the hydrogen-bonding interaction between DMAEMA and water molecules dominant that caused the nanofibers soluble when temperature was below the LCST (33.6 °C). On the contrary, at pH 5, although more DMAEMA units were protonated (no LCST), the thermo-responsive behaviors discussed above proved the physically crosslinking via hydrophobic interaction of the stearyl side chains was significant at pH 5. Therefore, Pm2 became less soluble at pH 5 and exhibited fragmented fiber morphology.
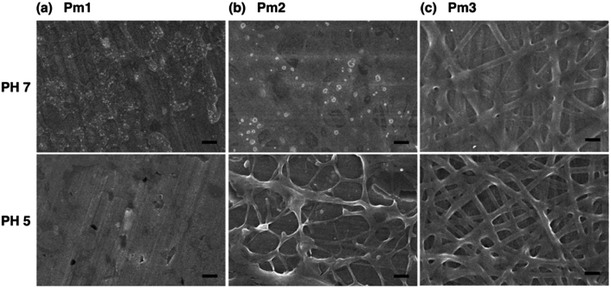 | ||
| Fig. 4 FE-SEM images of poly(DMAEMA-co-SA-co-Py) ES fibers immersed in pH 7 and pH 5 solution at room temperature: (a) Pm1, (b) Pm2, and (c) Pm3. Scale bar: 2 μm. | ||
Fig. 4c shows fibrous morphology of Pm3 at pH 7 and pH 5 solutions due to its high content of the cross-linkable SA moiety and proper thermal behavior. At room temperature (27 °C) which was higher than its LCST (25.8 °C) and lower than its UCST (32.2 °C), Pm3 became hydrophobic that stabilized the fiber structures in aqueous solution. The average diameters of nanofibers at pH 7 and pH 5 are 789 ± 240 and 858 ± 156 nm, respectively. Compared to Fig. 3c, the appearance of clear fiber structures in wet state relative to those in dry state might be due to penetration of water molecules into fibers as well as the electrostatic repulsion between cationic DMAEMA segments that swell the diameter of nanofibers. To test the morphological stability of nanofibers at pH 5 solution, Pm3 ES nanofibers were immersed in solution at different time. The results showed Pm3 nanofibers still maintained their well-defined fibrous structures, indicating they have excellent stability at pH 5 and are suitable for DNA detection (Fig. S3†). Pm3 nanofibers with good stability in different pH solution were chosen for DNA adsorption.
Photoluminescence of poly(DMAEMA-co-SA-co-Py) ES nanofibers
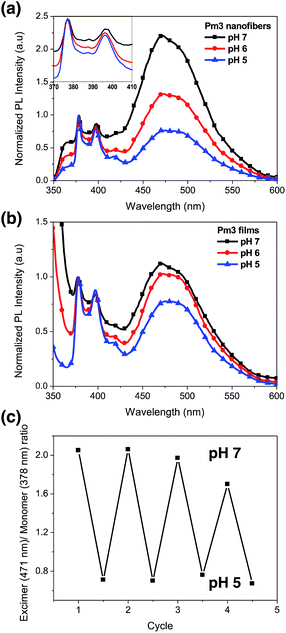
Fig. 5a shows the photoluminescence (PL) spectra of Pm3 ES nanofibers at different pH solution. The emission bands at 378, 386, and 396 nm are corresponded to the monomer emission of pyrene, while the broad emission band centered at 471 nm is ascribed to emission of pyrene excimer. The monomer emission of all PL spectra at 378 nm is normalized in order to distinguish the change of excimer emission. The emerged excimer emission in nanofibers indicates the pyrene molecules are in close proximity within nanofibers due to strong π–π interactions.31 As pH decreased from 7 to 5, a significant decrease in excimer emission was attributed to the separation of neighboring pyrenes from each other. The ratios of excimer to monomer (I471/I378) were substantial decreased from 2.24 (pH 7), 1.34 (pH 6) to 0.77 (pH 5). This result confirmed that the quaternized amine groups of DMAEMA under acidic environment caused intensive electrostatic repulsion between DMAEMA segments and swelling of the nanofibers (Scheme 1). Moreover, there was no pyrene emission detected in aqueous solution when nanofibers were immersed at pH 5, indicating the nanofibers were stable (Fig. S4†). Compared to dip-coating films (Fig. 5b), the I471/I378 ratios were slightly decreased from 1.14 (pH 7), 1.02 (pH 6) to 0.76 (pH 5). It indicates Pm3 ES nanofibers have a better pH-responsive performance and swelling–deswelling transition due to their high surface-to-volume ratio. | ||
| Scheme 1 Schematic drawing of swelling–deswelling transition of nanofiber, which correlates with formation of pyrene excimer and DNA detection using the quaternized nanofibers. | ||
The reversibility of pH induced swelling–deswelling transitions of Pm3 nanofibers, which correlated with protonation/deprotonation of DMAEMA segments, was evaluated by monitoring the I471/I378 ratios of pyrene during alternatively changing the pH of solution. Four successive cycles were performed (Fig. 5c). Pm3 nanofibers exhibited a notable change of excimer to monomer ratio when immersed in different pH solution. However, the excimer to monomer ratio at pH 7 slightly deviated from its initial value after three circles, suggesting the nanofibers could not completely shrink back to original state within experimental time and reduce π–π interaction between pyrene moieties.
Detection of DNA via poly(DMAEMA-co-SA-co-Py) ES nanofibers
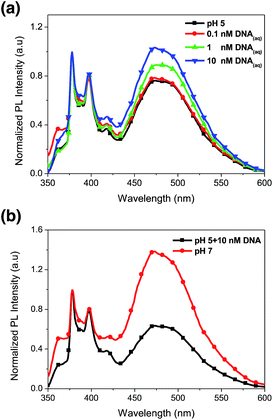
We have demonstrated PL characteristics were correlated with protonation/deprotonation of DMAEMA segments and could be controlled by pH. Because DNA molecules prefer to adsorb on cationic surface via electrostatic interaction, protonated DMAEMA segments of nanofibers under acidic pH would facilitate complexation with DNA that might change the morphology of nanofibers and further affect the excimer to monomer ratio of pyrene. Fig. 6a shows PL spectra of cationic Pm3 ES nanofibers under different concentration of DNA. A gradual increase in I471/I378 ratio from 0.77 (pH 5) to 1.04 upon addition of 10 nM DNA indicated the DNA adsorbed on the nanofibers, resulting in more pyrene moieties in close proximity and enhancing the excimer emission. However, the I471/I378 ratio of DNA complexed fibers was less than that of its original state at pH 7 (I471/I378 = 2.24). We suggested pyrene moieties might be intercalated into the DNA double helix that prevented the excimer formation.21 In addition, a photoinduced electron transfer process might occur between excited pyrene and nucleobases, resulting in fluorescent quenching of pyrene excimer32,33 (Scheme 1). DNA detachment could be carried out by adjusting the pH values from pH 5 to pH 7. The enhanced excimer emission indicated DNA released from nanofibers (Fig. 6b). At pH 7, the reduced charge density on DMAEMA segments significantly diminished the interaction between DNA and polymer chains, resulting in increase of excimer emission.Fig. 7 shows FE-SEM images of cationic Pm3 ES nanofibers (at pH 5) complexed with DNA molecules. As shown in the figure, the fibrous structures changed to filaments or flakes. This is mainly ascribed to the electrostatic interaction between cationic nanofibers and negatively charged DNA. In addition, π–π interaction between pyrene and heterocyclic base of DNA as well as hydrogen bonding resulting from the carbonyl groups of copolymers and amino groups of DNA might also cause to change the fiber shapes. Although the fibrous structures were changed, PL spectra demonstrated no dissociated polymer chains were detected in solution (Fig. S5†). Fig. 8 shows confocal microscope images of Pm3 ES nanofibers at different pH and complexed with DNA. The blue emission collected at a range of 430 to 530 nm represents the excimer formation. The intense blue fluorescent fibers were found at pH 7, while significantly fluorescent quenching was observed at pH 5. This confirmed the change in charge density of DMAEMA caused the nanofibers to exhibit swelling–deswelling transitions and affected excimer formation. On the other hands, when nanofibers were complexed with DNA, the increase of blue emission was found due to effectively adsorption of DNA onto the nanofibers. These results are consistent with PL measurement.
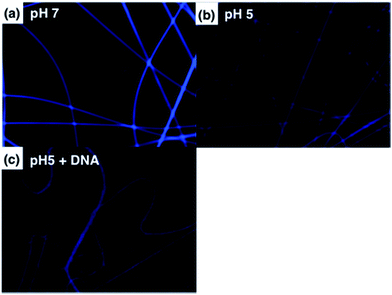 | ||
| Fig. 8 Confocal images of Pm3 ES nanofibers immersed at (a) pH 7, (b) pH 5, and (c) pH 5 with DNA complexed. | ||
Conclusions
In summary, we developed a new luminescent and pH-responsive poly(DMAEMA-co-SA-co-Py) nanofiber mat via free radical polymerization and electrospinning technique for adsorption and detection of DNA. Through the delicate adjustment of SA content, the prepared Pm3 ES nanofibers showed good wettability and integrity in different pH solution with smooth and bead-free morphology. The rapid swelling–deswelling transition of the nanofibers at different pH solution could be monitored by the excimer-to-monomer ratio (I471/I378) of pyrene. The decrease in excimer-to-monomer ratio under acidic environment confirms that the quaternized amine groups of DMAEMA cause intensive electrostatic repulsion between DMAEMA segments and swelling of the nanofibers that separate the pyrene excimer. The DNA detection was performed under pH 5 to protonate DMAEMA of the nanofibers. The increase in excimer to monomer ratios upon addition of DNA indicate adsorption of DNA on the nanofibers through electrostatic interaction causes more pyrene moieties in close proximity. From all the present results, it can be concluded that the poly(DMAEMA-co-SA-co-Py) nanofiber mat not only provides fluorescent signal to detect and adsorb DNA without dye-labeling, but open up a field of applications to detect other targets, such as ATP, ADP or protein etc. via electrostatic interaction for purification or bioseparation. Further effort will focus on systematic exploration on fluorescent and morphology characterizations of the attachment and detachment of DNA or other targets on the fibrous mats.Acknowledgements
The financial support from the Ministry of Science and Technology of Taiwan is highly appreciated. The authors thank Prof. Wen-Chang Chen, National Taiwan University for providing instruments for characterization.Notes and references
- D. Li and Y. Xia, Adv. Mater., 2004, 16, 1151 CrossRef CAS.
- R. Konwarh, N. Karak and M. Misra, Biotechnol. Adv., 2013, 31, 421 CrossRef CAS PubMed.
- S. Agarwal, J. H. Wendorff and A. Greiner, Polymer, 2008, 49, 5603 CrossRef CAS.
- Z. M. Huang, Y. Z. Zhang, M. Kotakic and S. Ramakrishna, Compos. Sci. Technol., 2003, 63, 2223 CrossRef CAS.
- S. Huan, L. Bai, W. Cheng and G. Han, Polymer, 2016, 92, 25 CrossRef CAS.
- X. Wang, C. Drew, S. H. Lee, K. J. Senecal, J. Kumar and L. A. Samuelson, Nano Lett., 2002, 2, 1273 CrossRef CAS.
- L. N. Chen, C. C. Kuo, Y. C. Chiu and W. C. Chen, RSC Adv., 2014, 4, 45345 RSC.
- D. Qi, X. Kang, L. Chen, Y. Zhang, H. Wei and Z. Gu, Anal. Bioanal. Chem., 2008, 390, 929 CrossRef CAS PubMed.
- R. Lalani and L. Liu, Biomacromolecules, 2012, 13, 1853 CrossRef CAS PubMed.
- S. Demirci, A. Celebioglu and T. Uyar, Carbohydr. Polym., 2014, 113, 200 CrossRef CAS PubMed.
- F. Song, X. L. Wang and Y. Z. Wang, Eur. Polym. J., 2011, 47, 1885 CrossRef CAS.
- A. F. Che, X. J. Huang and Z. K. Xu, J. Membr. Sci., 2011, 366, 272 CrossRef CAS.
- S. Demirci and T. Caykara, Mater. Sci. Eng., C, 2013, 33, 111 CrossRef CAS PubMed.
- X. Wang, F. He, F. Tang and L. Li, J. Mater. Chem., 2012, 22, 15303 RSC.
- J. Zhang, Y. Duan, D. Wei, L. Wang, H. Wang, Z. Gu and D. Kong, J. Biomed. Res., 2011, 96A, 212 CAS.
- C. C. Kuo, C. T. Wang and W. C. Chen, Macromol. Mater. Eng., 2008, 293, 999 CrossRef CAS.
- B. Valeur, Molecular fluorescence: principles and applications, Wiley-VCH Weinheim, 2002 Search PubMed.
- I. Carmichael and G. L. Hug, Handbook of photochemistry, Marcel Dekker, New York, 2nd edn, 1993 Search PubMed.
- H. S. Jung, M. D. Park, Y. Han, E. Kim, C. Lee, S. Ham and J. S. Kim, Org. Lett., 2009, 11, 3378 CrossRef CAS PubMed.
- F. M. Winnik, Chem. Rev., 1993, 93, 587 CrossRef CAS.
- R. Sheng, T. Luo, Y. Zhu, H. Li and A. Cao, Macromol. Biosci., 2010, 10, 974 CrossRef CAS PubMed.
- L. Yang, M. Zhao, R. Zhang, J. Dong, T. Zhang, X. Zhan and G. Wang, ChemPhysChem, 2012, 13, 4099 CrossRef CAS PubMed.
- C. Y. Chen, Y. Ito, Y. C. Chiu, W. C. Wu, T. Higashihara, M. Ueda and W. C. Chen, J. Polym. Sci., Part A: Polym. Chem., 2012, 50, 297 CrossRef CAS.
- X. Sun, Y. Liu, G. Shaw, A. Carrier, S. Dey, J. Zhao and Y. Lei, ACS Appl. Mater. Interfaces, 2015, 7, 13189 CAS.
- D. Fournier, R. Hoogenboom, H. M. L. Thijs, R. M. Paulus and U. S. Schubert, Macromolecules, 2007, 40, 915 CrossRef CAS.
- P. van de Wetering, E. E. Moret, N. M. E. Schuurmans-Nieuwenbroek, M. J. van Steenbergen and W. E. Hennink, Bioconjugate Chem., 1999, 10, 589 CrossRef CAS PubMed.
- J. Jiang, X. Tong and Y. Zhao, J. Am. Chem. Soc., 2005, 127, 8290 CrossRef CAS PubMed.
- Y. C. Chiu, C. C. Kuo, J. C. Hsu and W. C. Chen, ACS Appl. Mater. Interfaces, 2010, 2, 3340 CAS.
- H. Okuzaki, K. Kobayashi and H. Yan, Macromolecules, 2009, 42, 5916 CrossRef CAS.
- Y. Osada and A. Matsuda, Nature, 1995, 376, 219 CrossRef CAS PubMed.
- V. D. Deepak and S. K. Asha, J. Phys. Chem. B, 2009, 113, 11887 CrossRef CAS PubMed.
- M. Manoharan, K. L. Tivel, M. Zhao, K. Nafisi and T. L. Netzel, J. Phys. Chem., 1995, 99, 17461 CrossRef CAS.
- T. L. Netzel, K. Nafisi, J. Headrick and B. E. Eaton, J. Phys. Chem., 1995, 99, 17948 CrossRef CAS.
Footnote |
| † Electronic supplementary information (ESI) available: TGA and DSC of Pm1–Pm3 polymer. FE-SEM images of Pm3 ES fibers immersed in pH 5 solution with different time. Photoluminescence spectra of Pm3 ES nanofibers and nanofibers/DNA complex at pH 5 and aqueous solution. See DOI: 10.1039/c6ra26714a |
| This journal is © The Royal Society of Chemistry 2017 |

