
 Open Access Article
 This Open Access Article is licensed under a
 Creative Commons Attribution 3.0 Unported Licence
Phenolic content, antioxidant and antiproliferative activities of six varieties of white sesame seeds (Sesamum indicum L.)†
Xiaohui Lin a,
Lin Zhou*a,
Tong Lib,
Charles Brennanc,
Xiong Fua and
Rui Hai Liu*b
a,
Lin Zhou*a,
Tong Lib,
Charles Brennanc,
Xiong Fua and
Rui Hai Liu*b
aSchool of Food Science and Engineering, South China University of Technology, Guangzhou, 510640, People's Republic of China. E-mail: zhoulin@scut.edu.cn; Fax: +86-20-87113843; Tel: +86-20-87113843
bDepartment of Food Science, Cornell University, Ithaca, NY 14850-2824, USA. E-mail: rl23@cornell.edu; Fax: +1-607-255-4868; Tel: +1-607-255-6235
cCentre for Food Research and Innovation, Lincoln University, Lincoln 7648, New Zealand
First published on 17th January 2017
Abstract
Little work has been conducted on the evaluation of antioxidant and antiproliferative activities of different sesame seed varieties. This article compared the total phenolics, antioxidant contents, and the antiproliferative activities of six varieties of white sesame seeds. Total contents of phenolics and flavonoids ranged between 370.5–786.8 mg GAE/100 g, DW and 714.0–1354.7 mg CE/100 g, DW, respectively. Antioxidant activity was determined by oxygen radical absorbance capacity (ORAC), hydrogen peroxyl radical scavenging capacity (PSC) and cellular antioxidant activity (CAA) assays. According to the ORAC and PSC assays, the white sesame seeds showed high antioxidant values of 33.94 μmol Trolox equiv./g, DW and 9.39 μmol Vit. C equiv./g, DW, respectively. The free CAA values ranged from 55.66 to 224.45 μmol QE/100 g, DW in the no PBS wash protocol, and 21.88–57.36 μmol QE/100 g, DW in the PBS wash protocol. The proliferation of HepG2 human liver cancer cells were inhibited significantly after exposure to the white sesame seed extracts, with EC50 of antiproliferative activities ranging from 102.54 to 43.92 mg mL−1. Free phenolics make a major contribution to total phenolic content, antioxidant and antiproliferative activities. This study suggested that white sesame seeds are potential sources of functional food to prevent chronic diseases.
1. Introduction
Antioxidants, possibly from dietary phytochemicals, which scavenge reactive oxygen species to keep the balance between oxidants and antioxidants, may play a significant role in the prevention of numerous chronic diseases.1,2 There is increasingly convincing evidence indicating that the nutritional functions of phytochemicals in fruits, vegetables, legumes, and whole grains might be greater than is currently acknowledged against oxidative stress which is concerned with the etiology of various chronic diseases.2 Phenolics have been discovered to have many health benefits including antioxidant activity and anticarcinogenic properties.3 Flavonoids/polyphenols found in plants have received extensive attention among researchers as important natural antioxidants. Epidemiological studies have shown that a high dietary consumption of plant phenolics was beneficial to health and might provide protection against major chronic diseases.4Sesame (Sesamum indicum L.) is grown widely as oilseed crop in the world, and is cultivated mainly in subtropical, tropical, and southern temperate regions of the world.5 The sesame seed is not only an important material for edible oil production and food, but is also used as an ingredient in Traditional Chinese Medicine. Sesame seeds contain bioactive components including phenolics, vitamins, phytosterols, and polyunsaturated fatty acids, which provides a beneficial effect on human health.6 Sesame seed lignans have been reported to have high antioxidant activity both in vitro and in vivo experiments.7,8
However, current research focuses on the antioxidant of free phenolics in sesame seeds, while there is a lack of information regarding the antioxidant and antiproliferative activities of the bound phenolics.9,10 Therefore, present study was aimed to compare the antioxidant and antiproliferative activities among different varieties of white sesame seeds, and associate the contents of phenolics and flavonoids with the antioxidant and antiproliferative activities.
2. Material and method
2.1 Chemicals
Acetone, n-hexane, ethyl acetate, hydrochloric acid, ethanol, and tetrahydrofuran were purchased from Guanghua Sci-Tech Co., Ltd. (Guangdong, China). NaOH, Na2CO3, aluminum chloride, acetic acid, KH2PO4, K2HPO4, and KOH were purchased from Sangon Biotech Co., Ltd. (Shanghai, China). Folin–Ciocalteu reagent, 2,2′-azobis-amidinopropane (ABAP), gallic acid, chloranil, catechin hydrate, dichlorofluorescin diacetate (DCFH-DA), fluorescein disodium salt, and 6-hydroxy-2,5,7,8-tetramethylchroman-2-carboxylic acid (Trolox) were purchased from Sigma Chemical Co. (St. Louis, MO, USA). Sodium borohydride and vanillin were purchased from Aladdin Co. (Shanghai, China). Sesamol, sesamolin, and sesamin were obtained from Chengdu Pufei De Biotech Co., Ltd. (Sichuan, China). Octadecylsilane (ODS) gel (50 μm) was purchased from YMC Co. (Kyoto, Japan). Williams' medium E, Hank's balanced salt solution, insulin, and other cell culture reagents were purchased from Gibco Life Technologies Co. (Grand Island, NY, USA).2.2 Plant materials
Six varieties of white sesame seeds (A15-4, 143-3, 243-1, 253-2, 166-2, 188-1) were kindly donated by Shanxi Academy of Agricultural Science of China in 2014 and kept at −20 °C until use.2.3 Extraction of soluble free phenolics
Soluble free phenolics of the sesame seeds were extracted using the method reported previously,11 and modified in the present study. Briefly, 1 gram of the sesame seeds was homogenized with 10 mL of n-hexane for 3 min and centrifuged at 2850 g for 3 min, the solvent was decanted to recover a pellet. The defatted residue was homogenized with 10 mL of 80% acetone at 4 °C for 3 min and centrifuged at 2850 g for 3 min. Finally, the supernatant was collected and evaporated at 45 °C under vacuum until 1 mL solvent remained. The extract was brought to 10 mL with water and stored at −20 °C until use.2.4 Extraction of soluble bound phenolics
Soluble bound phenolics were extracted using the method reported previously,12 and modified in the present study. Briefly, the residue obtained from the extract of soluble free phytochemicals was flushed with nitrogen gas, digested with 10 mL of 4 M sodium hydroxide at room temperature and sealed for 90 min under shaking. The mixture was neutralized with hydrochloric acid and then extracted with ethyl acetate. The ethyl acetate fractions were evaporated at 45 °C under vacuum to remove solvent. The extract was re-suspended in 10 mL water and stored at −20 °C until analysis.2.5 Determination of total phenolics
The phenolic contents were determined using the modified Folin–Ciocalteu colorimetric method reported by previous study.13 Briefly, the sample extract or gallic acid was mixed with Folin–Ciocalteu reagent for 6 min, after which sodium carbonate was added into the test tube and allowed to stand for 90 min after thoroughly mixing. The absorbance was detected at 760 nm and the result was expressed as micrograms of gallic acid equivalents per 100 gram dry weight sample (mg GAE/100 g, DW).2.6 Determination of total flavonoids
The contents of flavonoids were measured using the method sodium borohydride/chloranil reported previously with modification.14 Briefly, 1 mL of extracts was added into glass test tubes and dried under nitrogen gas. The dry pellet was then reconstituted in 1 mL of THF/EtOH (1![[thin space (1/6-em)]](https://www.rsc.org/images/entities/char_2009.gif) :1, v/v). Catechin standards (0.1–10.0 mM) were prepared fresh in 1 mL of THF/EtOH (1:1, v/v). 0.5 mL of 50.0 mM NaBH4 solution and 0.5 mL of 74.6 mM AlCl3 solutions were added to test tubes and the mixtures were shaken at room temperature for 30 min. Another 0.5 mL of 50.0 mM NaBH4 solution was added into test tubes with shaking for 30 min at room temperature. Then, 2.0 mL of cold 0.8 M acetic acid solution was added to each test tube with shaking for 15 min at room temperature in dark. 1 mL of 20.0 mM chloranil was added to each tube, which was kept at 95 °C for 60 min. Then, the volume was brought to 4.0 mL volume with methanol after the tubes were cooled using tap water. 1 mL of 16% vanillin methanol solution was added to each tube and mixed. Then, 2 mL of 12 M HCl was added to test tubes, and the reaction solutions were kept in the dark for 15 min. Finally, the absorbance was measured at 490 nm after the mix solutions were centrifuged at 1450 g for 3 min. The results were expressed as mg catechin equivalents per 100 g dry weight sample (mg CE/100 g, DW).
:1, v/v). Catechin standards (0.1–10.0 mM) were prepared fresh in 1 mL of THF/EtOH (1:1, v/v). 0.5 mL of 50.0 mM NaBH4 solution and 0.5 mL of 74.6 mM AlCl3 solutions were added to test tubes and the mixtures were shaken at room temperature for 30 min. Another 0.5 mL of 50.0 mM NaBH4 solution was added into test tubes with shaking for 30 min at room temperature. Then, 2.0 mL of cold 0.8 M acetic acid solution was added to each test tube with shaking for 15 min at room temperature in dark. 1 mL of 20.0 mM chloranil was added to each tube, which was kept at 95 °C for 60 min. Then, the volume was brought to 4.0 mL volume with methanol after the tubes were cooled using tap water. 1 mL of 16% vanillin methanol solution was added to each tube and mixed. Then, 2 mL of 12 M HCl was added to test tubes, and the reaction solutions were kept in the dark for 15 min. Finally, the absorbance was measured at 490 nm after the mix solutions were centrifuged at 1450 g for 3 min. The results were expressed as mg catechin equivalents per 100 g dry weight sample (mg CE/100 g, DW).
2.7 Analysis of lignans by high-performance liquid chromatography analysis (HPLC)
Analysis of sesamol, sesamolin, and sesamin was performed by HPLC method reported previously,15 which was modified in current study. Briefly, the extracts and lignan standards were detected by Waters HPLC system (Waters Corp., Milford, MA) containing C18 phenomenex column (4.6 mm i.d. × 250 mm), a binary pump, an intelligent sampler and a diode-array detector. The mobile phase was a mixture of methanol-deionized water (75/25, v/v) at a flow rate of 0.8 mL min−1. Absorption at 290 nm was monitored. The contents of individual phenolic content were expressed as milligrams per 100 gram of dry weight sample (mg/100 g, DW) according to the standard curve. The calibration ranges of sesamol, sesamin, and sesamolin were 2.0–200.0 μg.2.8 Measurement of total antioxidant activity by PSC assay
The total antioxidant activities of extracts were analyzed by PSC assay as reported previously.14 Briefly, gallic acid was used as a standard and dissolved in 75 mM phosphate buffer (pH = 7.4). 100 μL of 13.26 μM DCFH was hydrolyzed with KOH to remove the diacetate moiety and was added into 100 μL of sample or standard. Finally, the 50 μL of 200 mM ABAP was added into the mixtures and the fluorescence was monitored dynamically at 485 nm excitation and 535 nm emission with a fluorescent spectrophotometer (Fluoroskan Ascent FL, Molecular Devices, USA). The PSC values were presented as micromole of vitamin C equivalents per gram dry weight sample (μmol Vit. C equiv./g, DW).2.9 Measurement of total antioxidant activity by ORAC assay
The total antioxidant activities of the sesame seed extracts were measured by ORAC assay reported before.14,16 The ORAC assay measured the extract ability to inhibit the fluorescein disodium salt from being oxidized by the radicals of ABAP compared to the Trolox. Briefly, 20 μL of test samples or Trolox were incubated at 37 °C for 10 min. 200 μL of 0.96 μM fluorescein was added in to both samples and Trolox and the mixtures were kept at 37 °C for 20 min. Afterwards, 20 μL of 119.4 mM ABAP was added to start the reaction and the fluorescence was monitored dynamically at 485 nm excitation and 535 nm emission with a fluorescent spectrophotometer (Fluoroskan Ascent FL, Molecular Devices, USA). The results were reported as μmol Trolox equivalents per gram dry weight sample (μmol Trolox equiv./g, DW).2.10 Measurement of total antioxidant activity by CAA assay
Human liver cancer cell line HepG2 (ATCC® HB-8065) were purchased from ATCC company (Manassas, VA, USA) and were grown in growth medium, supplemented with 0.05 μg mL−1 hydrocortisone, 50 units per mL penicillin, 50 μg mL−1 streptomycin, 2 mM L-glutamine, 10 mM Hepes, 5 μg mL−1 insulin, 100 μg mL−1 gentamicin, and 5% FBS and were incubated at 37 °C in 5% CO2. The CAA assay was conducted as described previously.17 HepG2 cells were seeded at a density of 6 × 10⁴ cells per well on a 96-well plate in 100 μL of growth medium per well. The medium was removed and the plate wells were washed with 100 μL of PBS after seeding approximately 24 h. Wells were treated in triplicate with different concentrations of extracts plus 50 M DCFH-DA for 1 h. Afterwards, the treatment medium was removed, and one plate was managed with a PBS wash protocol while the other one was managed with a no PBS wash protocol. Then, ABAP (600 μM) in 100 μL of Hank's balanced salt solution was added into the wells and the microplate was placed in Multi-Mode Microplate Reader (Molecular Devices) at 485 nm excitation and 535 nm emission. The fluorescence intensity was monitored every 5 min for 1 h. The quercetin was used as standard and CAA values were expressed as μmol quercetin equivalents per 100 gram dry weight sample (μmol QE/100 g, DW).2.11 Determination of antiproliferative activity
The antiproliferative effects of sesame seed extracts were performed by methylene blue method.18,19 Briefly, HepG2 cells were seeded at a density of 2.5 × 10⁴ cells per well in the wells of the 96-well plate. After incubating at 37 °C for 4 h, the medium was removed and various concentrations of sesame seed extracts were added in wells. The wells treated with growth medium minus extracts were used as controls. After 72 h of incubation, the growth medium was removed, and cells were stained with methylene blue for 1 h at 37 °C. The staining solution was removed, and the plate was washed in deionized water. Absorbance was measured using a microplate reader at 570 nm wavelength. The antiproliferative effects were calculated by the EC50 values, and expressed as milligrams of sesame seed extracts per milliliter (mg mL−1).2.12 Separation of crude extracts by column chromatography
The extraction of soluble free phenolics (1 g) was fractionated in an open column (1.6 cm i.d. × 50 cm) packed with ODS gel. The column was eluted with 500 mL portion of 10, 20, 50, 75, and 100% methanol in series, and eight fractions (S1–S8) were collected (ESI data 1†). The fractions were evaporated at 45 °C under vacuum and brought to 5 mL with water and stored at −20 °C until use. The phenolic contents and ORAC values of eight fractions were determined.2.13 UPLC-MS analysis of the separated fraction
The fraction containing the highest phenolic content and ORAC value was analyzed by UPLC-MS. UPLC-TOF MS (Acquity UPLC-Q/TOF micro; Waters, Milford, MA) was performed using a C18 column (2.1 mm i.d. × 50 mm; Waters). The eluents used were water (A) and methanol (B); the elution conditions were 0–1.6 min, 10% B; 1.6–3.6 min, 20% B; 3.6–4.6 min, 40% B; 4.6–8.6 min, linear gradient to 60% B; 8.6–11.6 min, 75% B; 11.6–12.6 min, 100% B. The flow rate was 0.208 mL min−1 and the injection volume was 2 μL. The negative ionization model ([M − H]−) was used to collect the mass data. The capillary voltage was 3.0 kV. Cone and desolvation gas flow rates were 60 and 500 L h−1, respectively, and the source and desolvation temperature was set at 100 and 300 °C, respectively.2.14 Statistical analysis
Data were collected in triplicate and reported as mean ± standard deviation. ANOVA and Duncan's comparison tests were performed using SPSS version 19.0 (IBM, USA) to identify the difference between values. Statistical significance was defined to be at a level of p < 0.05.3. Results
3.1 The total phenolic and flavonoid contents of sesame seed extracts
| Varieties | Total phenolics (mg GAE/100 g, DW) | Total flavonoids (mg CE/100 g, DW) | ||||
|---|---|---|---|---|---|---|
| Free | Bound | Total | Free | Bound | Total | |
| a Values with no letters in common are significantly different (P < 0.05).b Values in parentheses indicate percentage contribution to the total. | ||||||
| 243-1 | 278.6 ± 53.0d,a (75.19)b | 91.9 ± 12.7d (24.81) | 370.5 ± 60.1c | 502.4 ± 129.8b (61.96) | 308.4 ± 17.7b,c (38.04) | 810.9 ± 128.7c,d |
| 188-1 | 335.0 ± 19.6c,d (67.61) | 160.5 ± 20.0c (32.39) | 495.6 ± 14.0b | 501.6 ± 113.6b (70.26) | 212.4 ± 23.0c (29.74) | 714.0 ± 90.7d |
| 143-3 | 404.2 ± 52.5b,c (78.48) | 110.8 ± 20.4d (21.52) | 515.1 ± 65.1b | 744.1 ± 84.3a (54.93) | 610.5 ± 77.4a (45.07) | 1354.7 ± 145.8a |
| 166-2 | 408.7 ± 16.5b,c (66.10) | 209.6 ± 20.1b (33.90) | 618.3 ± 34.9b | 749.1 ± 73.2a (70.54) | 312.8 ± 64.6b,c (29.46) | 1061.9 ± 132.6b |
| A15-4 | 459.5 ± 33.8a,b (80.13) | 113.9 ± 15.8d (19.87) | 573.4 ± 22.5b | 667.7 ± 76.6a,b (61.47) | 418.5 ± 88.7b (38.53) | 1086.2 ± 22.3b |
| 253-2 | 517.4 ± 91.6a (65.76) | 269.4 ± 41.1a (34.24) | 786.8 ± 126.6a | 609.9 ± 31.1a,b (64.26) | 339.2 ± 70.5b (35.74) | 949.1 ± 98.9b,c |
Phenolic compounds comprising two main groups of non-flavonoids and flavonoids exert health beneficial properties and contribute to the prevention of various chronic diseases.2 In previous studies the total contents of phenolics of sesame seeds were found to range from 129.7 to 355.3 mg GAE/100 g.9,20 The total contents of phenolic compounds observed in this study were much higher than the previous studies. This difference might due to the diversity of variety studied or the methodology used for phenolic analysis, especially considering bond phenolics in our study, which contributed 27.70% to the total phenolics. These bound phenolics may be digested in the colon by bacteria to provide health benefits and to protect against chronic diseases.4 Previous research has shown that the bound phenolics are linked with cell wall structural components through ester bonds and may form the major portion of phenolics in rice, wheat, oat, and corn.21 Thus, the study of both free and bound phenolics provides accurate information on the effect of total phenolics in relation to total antioxidant activity potential.
The flavonoid contents of the white sesame seeds were observed to be higher compared to other plant sources, such as the adlay (41.5 mg CE/100 g, DW), edible nut seeds (234.42 mg CE/100 g, DW), and highland barley (199.7 mg CE/100 g, DW).3,22,23 As mentioned previously the dietary intakes of flavonoids have been reported to have health benefits including antioxidant activity and anticancer properties.16,24 Our research illustrates the potential beneficial use of sesame seed extracts in improving human nutrition.
3.2 Analysis of phenolic compounds
The contents of individual phenolic compound in six varieties of white sesame seeds are illustrated in Table 2. Three kinds of lignans of white sesame seeds, namely sesamol, sesamin, and sesamolin, were analyzed by HPLC. Contents of sesamol in the free fraction ranged from 7.04 ± 0.12 to 24.96 ± 0.78 mg/100 g, DW, with the average value of 56.30% percentage contribution to total lignans. The overall ranking of contents of free sesamol was in the decreasing order of 188-1, 243-1, 166-2, 143-3, 253-2, and A15-4. However, sesamol in the bound fractions were low ranging from 0.16 ± 0.02 to 3.10 ± 0.01 mg/100 g, DW, with the average value of 5.13% percentage contribution to total lignans. Variety A15-4 exhibited the highest content of bound sesamol among the six varieties of white sesame seeds, while the bound sesamol was not found in variety 188-1. Sesamin and sesamolin were only found in the free fraction by HPLC. The average percentage contribution of sesamin and sesamolin to the total lignans detected were 28.57 and 10.86%, respectively. Contents of sesamin and sesamolin in six varieties of white sesame seeds ranged from 2.36 ± 0.22 to 10.89 ± 0.38 and from 1.05 ± 0.02 to 4.72 ± 0.31 mg/100 g, DW, respectively. The six varieties of white sesame seeds exhibited sesamin contents in the decreasing order of 188-1, A15-4, 143-3, 166-2, 253-2, and 243-1. Similarly, the decreasing order of sesamolin contents was 188-1, 143-3, A15-4, 166-2, 243-1, and 253-2. Total contents of lignans ranged from 12.36 ± 0.33 to 40.57 ± 1.46 mg/100 g, DW, with decreasing order of 188-1, 243-1, 166-2, 143-3, A15-4, and 253-2. The orders of total lignan contents and free sesamol contents presented a similar pattern.| Varieties | Free | Bound | Total | ||
|---|---|---|---|---|---|
| Sesamol | Sesamin | Sesamolin | Sesamol | ||
| a Values with no letters in common are significantly different (p < 0.05).b Values in parentheses indicate percentage contribution to the total; ND means “not detected”. | |||||
| 243-1 | 19.82 ± 0.20b,a (83.51)b | 2.36 ± 0.22e (9.93) | 1.05 ± 0.05d (4.40) | 0.51 ± 0.02c (2.16) | 23.74 ± 0.49b |
| 188-1 | 24.96 ± 0.78a (61.52) | 10.89 ± 0.38a (26.84) | 4.72 ± 0.31a (11.64) | ND | 40.57 ± 1.46a |
| 143-3 | 7.12 ± 0.03d (41.05) | 6.64 ± 0.26b (38.28) | 2.92 ± 0.04b (16.81) | 0.67 ± 0.00b (3.86) | 17.35 ± 0.27d |
| 166-2 | 13.41 ± 0.43c (62.98) | 5.55 ± 0.34c (26.08) | 2.23 ± 0.12c (10.48) | 0.10 ± 0.00e (0.46) | 21.3 ± 0.89c |
| A15-4 | 5.52 ± 0.21e (31.82) | 6.42 ± 0.32b (37.01) | 2.30 ± 0.19c (13.28) | 3.10 ± 0.01a (17.89) | 17.34 ± 0.71d |
| 253-2 | 7.04 ± 0.12d (56.94) | 4.11 ± 0.20d (33.27) | 1.05 ± 0.02d (8.53) | 0.16 ± 0.02d (1.26) | 12.36 ± 0.33e |
The ranges of sesamin and sesamolin contents in the previous report were 324–553 and 295–372 mg/100 g, respectively.10 The sesamin range of 74–723 mg/100 g and sesamolin range of 32–225 mg/100 g were reported by the previous study.25 These relatively less lignan contents may be due to the process of defatting and the polar solvent used in present study. Sesamol, sesamin, and sesamolin are fat-soluble lignans in sesame seeds and therefore elute into the oil on extraction and extraction solvent system may therefore have an influence on lignan content.26
3.3 Separation and characterization of crude extracts
The phenolic contents and ORAC values of eight fractions of white sesame seeds are presented in Table 3. The highest phenolic content and highest ORAC value were found in fraction S5, which contributed 49.35 and 55.20% to the total phenolic contents and total ORAC values, respectively. Thus, the fraction S5 played a leading role in the antioxidant activities.| S1 | S2 | S3 | S4 | S5 | S6 | S7 | S8 | |
|---|---|---|---|---|---|---|---|---|
| a Values with no letters in common are significantly different (p < 0.05). | ||||||||
| Phenolics (mg GAE/100 g DW) | 8.32 ± 0.14c,a | 2.72 ± 0.43d,e | 14.03 ± 0.40b | 13.68 ± 0.09b | 50.66 ± 1.83a | 15.16 ± 0.93b | 4.13 ± 0.03d | 2.29 ± 0.18e |
| ORAC values (μmol Trolox equiv./g DW) | 1.68 ± 0.19d | 0.52 ± 0.08e | 2.99 ± 0.93b,c | 3.78 ± 0.19b | 12.90 ± 0.65a | 2.61 ± 0.65c | 0.39 ± 0.09e | 0.18 ± 0.02e |
To better understand this fraction, we investigated it with UPLC-MS analysis. The ESI-MS spectrum is presented in Fig. 1. A main peak was eluted at 6.88 min corresponding to sesaminol triglucoside. The fragment at m/z 855.21 was observed for ion [M − H]−,27 and the fragment at m/z 901.28 and 915.30 were indicated the ion presence of [M + HCOOH − H]− and [M + CH3COOH − H]−.
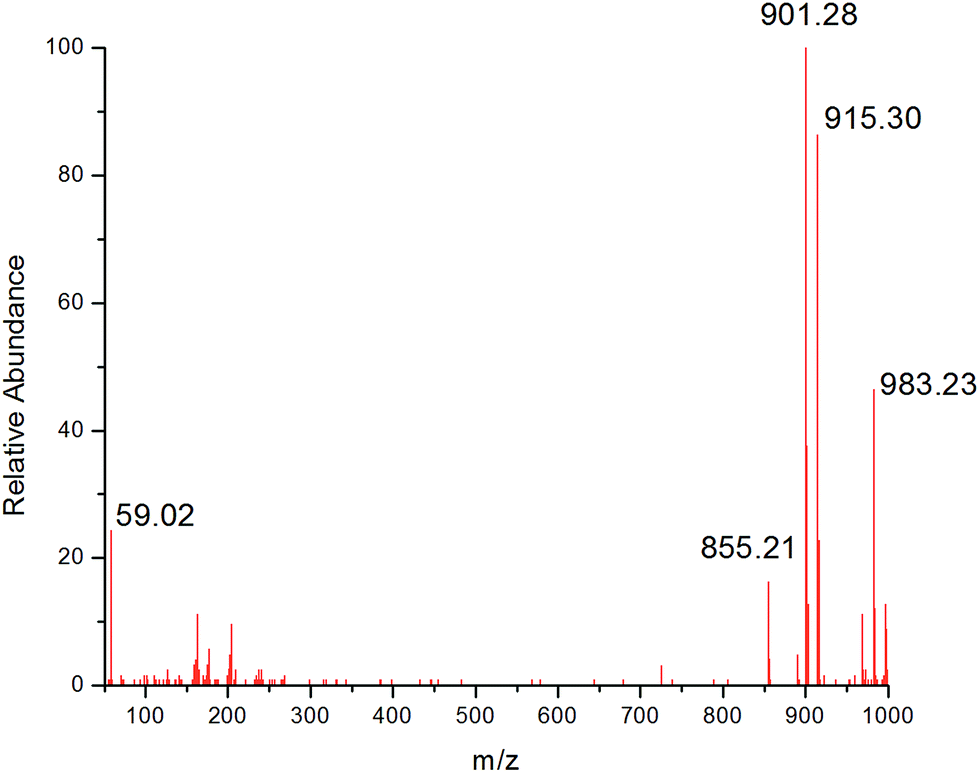 | ||
| Fig. 1 Mass spectra of sesaminol triglucoside. | ||
3.4 Total antioxidant activities measured by ORAC and PSC assays
The free, bound, and total antioxidant activities as determined by the ORAC assay are summarized in Fig. 2. The free ORAC values ranged from 68.5 ± 4.3 (243-1) to 126.6 ± 9.4 (A15-3) μmol Trolox equiv./g, DW, with the average value of 98.15 μmol Trolox equiv./g, DW. The bound ORAC values ranged from 21.1 ± 1.3 (243-1) to 51.4 ± 4.7 μmol (253-2) Trolox equiv./g, DW, with the average value of 33.94 μmol Trolox equiv./g, DW. The total ORAC values of the six varieties of white sesame seeds ranged from 89.5 ± 5.5 to 164.4 ± 15.9 Trolox equiv./g, DW, and the decreasing order of ORAC values was 253-2, A15-4, 166-2, 188-1, 243-1, and 143-3, which was similar to the pattern of the total phenolic contents.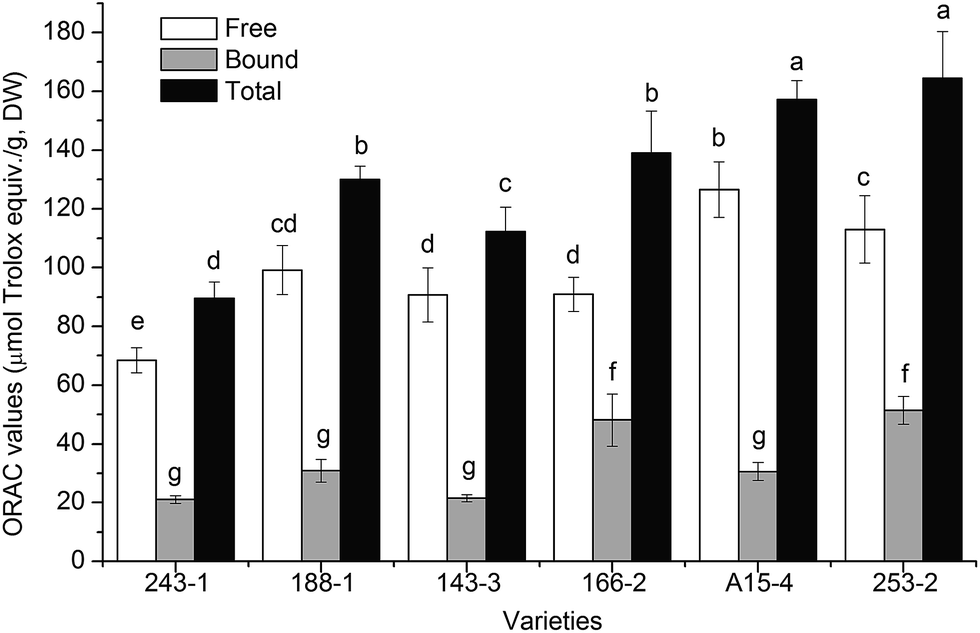 | ||
| Fig. 2 ORAC values of six varieties of white sesame seeds (mean ± SD, n = 3). Bars with no letters in common are significantly different (P < 0.05). | ||
As showed in Fig. 3, the values of free, bound, and total PSC values in six varieties of white sesame seeds ranged from 3.22 ± 0.08 to 8.69 ± 1.78, from 3.22 ± 0.22 to 5.91 ± 0.11, and from 6.44 ± 0.30 to 14.60 ± 1.67 μmol Vit. C equiv./g, DW, respectively, with the average values of 5.61, 3.77, and 9.39 μmol Vit. C equiv./g, DW, respectively. The variety A15-4 exhibited the highest free and total PSC values among the white sesame seeds investigated, followed by varieties of 253-2, 166-2, 143-3, 188-1, and 243-1. The orders of free and total PSC values were similar to that of total contents of phenolics.
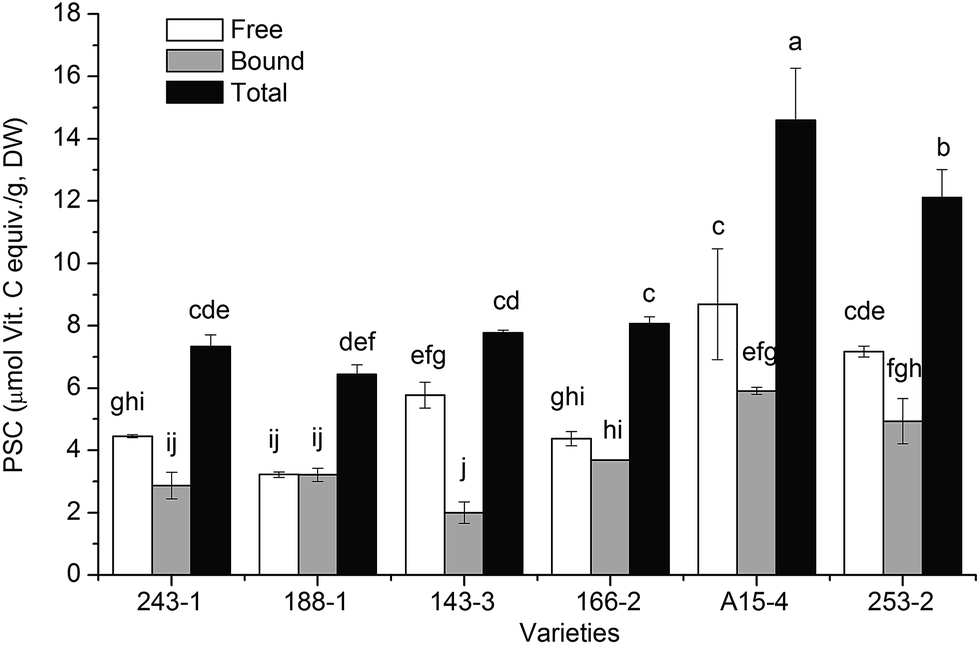 | ||
| Fig. 3 PSC values of six varieties of white sesame seeds (mean ± SD, n = 3). Bars with no letters in common are significantly different (p < 0.05). | ||
The ORAC and PSC assays are considered to be effective antioxidant activity assays as they utilize the biologically relevant free radicals, peroxylradicals. Although sesame seed extracts were found to possess good antioxidant activity by using diphenyl picrylhydrazyl (DPPH) radical scavenging activity assay in previous study,9 it is difficult to compare their results to present study which employed the PSC and OARC assays, which are widely used. The values of ORAC in current study are higher than highland barley (35.54–44.93 μmol Trolox equiv./g, DW) and yellow soybean (21.2–91.3 μmol Trolox equiv./g).23,28 Also, the values of PSC in the present study are higher than Brazilian tropical fruit juice (3.08 μmol Vit. C equiv./g, DW).29 However, the values of ORAC of white sesame seed extracts are lower than black rice bran (537.5–1876 μmol Trolox equiv./g, DW) and Chinese hawthorn (398.3–555.8 μmol Trolox equiv./g, DW).12,30 The values of PSC of the white sesame seed extracts are lower than Chinese hawthorn (299.1–370.9 μmol Vit. C equiv./g, DW) and corn (41.5–49.6 μmol Vit. C equiv./g, DW).12,31 Despite these variations the white sesame seed extracts reported in this study present a relatively high antioxidant activity among daily foods.
There were significant correlations between ORAC values and total phenolics (r = 0.878, p < 0.05), whereas the PSC values and total phenolics showed no significant correlations (r = 0.562, p > 0.05). These observations indicate that white sesame seeds had higher contents of phenolics and higher ORAC values. The positive correlation between the ORAC values and total phenolic contents was also observed in the dehulled highland barley.23 However, no significant correlations between total PSC or total ORAC values with flavonoid contents (p > 0.05) were found. Thus, the antioxidant activity determined by ORAC assay shows a positive correlation with the phenolic contents.
3.5 Cellular antioxidant activity measured by CAA assay
The cellular antioxidant activities of the free fraction were measured using the CAA assay with a no PBS wash protocol and a PBS wash protocol. As shown in Fig. 4, the CAA values in a no PBS wash protocol were almost 3 times higher than that observed in a PBS wash protocol. The range of antioxidant values in the no PBS wash protocol was from 55.66 ± 2.98 to 224.45 ± 33.48 μmol QE/100 g, DW. The variety 253-2 exhibited the highest CAA value, whereas the variety 166-2 had the lowest CAA value among the white sesame varieties tested. The CAA values for the remaining four varieties of white sesame seeds followed the order of A15-4, 243-1, 143-3, and 188-1. The CAA values in the PBS wash protocol ranged from 21.88 ± 2.39 (166-2) to 57.36 ± 2.04 (A15-4) μmol QE/100 g, DW. Variety A15-4 exhibited the highest activity followed by the varieties of 143-3, 253-2, 243-1, and 188-1.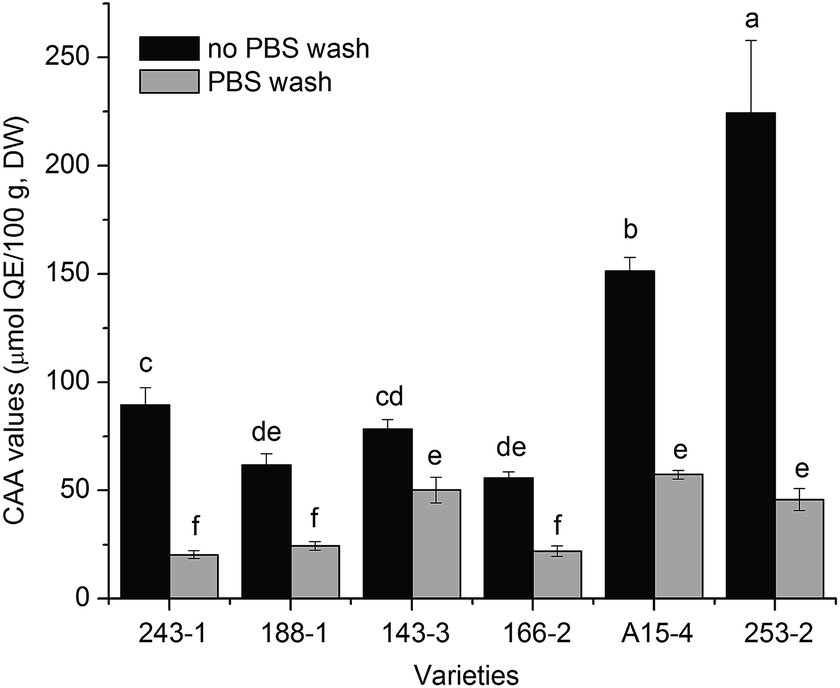 | ||
| Fig. 4 CAA values of the free extracts from six varieties of white sesame seeds (mean ± SD, n = 3). Bars with no letters in common are significantly different at p < 0.05. | ||
The CAA assay considers cellular uptake, distribution, and metabolism of the antioxidants.17,32 Compared to the traditional chemistry antioxidant assays, CAA is a more biologically relevant model. Furthermore, CAA is more suitable for initial antioxidant screening of foods and cheaper in contrast with animal models and human studies.17 Interestingly, the CAA values in the no PBS wash protocol were relatively higher than in the PBS wash protocol. This is due to the fact that the PBS wash protocol was designed to remove antioxidants in the medium which are not associated or are weakly bonded to cells membrane. The CAA results indicated that varieties of A15-4 and 253-2 had more effective antioxidant properties among the six varieties of white sesame seeds. Sesame seed extracts showed a better antioxidant activity values compared to some antioxidant rich fruits, such as blueberry, cranberry, apple, red grape, and green grape, whose CAA values in no PBS wash protocol and PBS wash protocol have been shown to range from 9.39 to 171 and from 9.67 to 47 μmol of QE/100 g, respectively.17 In order to compare the antioxidant quality of different foods, CAA values can be presented as μmol of QE/100 μmol of phenolics or μmol of QE/100 μmol of flavonoids, namely CAA quality. A higher CAA quality indicates better cellular availability of the phenolics or flavonoids. The ranges of CAA quality relative to the phenolic contents in no PBS and PBS wash protocols were 2.35–7.47 and 0.91–2.12 μmol of QE/100 μmol of phenolics, respectively. The ranges of CAA quality relative to the flavonoid contents in no PBS and PBS wash protocols were 2.16–10.68 and 0.85–3.33 μmol of QE/100 μmol of flavonoids, respectively. These results show that the CAA quality relative to the flavonoid contents tends to be higher than that relative to the phenolic contents, an observation which agrees with the previous finding.23 In contrast with fruits such as blueberry, cranberry, apple, red grape, and green grape, the present study suggests that white sesame seeds show high antioxidant quality. In the protocol without a PBS wash, the CAA quality of blueberry, cranberry, apple, red grape, and green grape ranged from 1.04 to 8.70 μmol of QE/100 μmol of phenolics. When a PBS wash was conducted, the quality ranged from 0.84 to 1.82 μmol of QE/100 μmol of phenolics.17 This difference may due to the diverse phenolic profiles of foods which contribute to different value to the antioxidant activity. However, in present study, CAA values showed no significant positive correlation with the total phenolics, with correlation coefficients 0.748 (p > 0.05) and 0.722 (p > 0.05) in no wash and wash protocol, respectively.
Previous study has indicated that the sesaminol triglucoside is the major component of lignan glucosides discovered in sesame seeds, which was hydrophilic antioxidant.33 In vitro studies reported that sesaminol triglucoside was an antioxidant for scavenging several free radical species.34,35 The fat-soluble lignans (sesamin, sesamol, sesamolin) presented in the extracts of white sesame seeds have been suggested to have antioxidant activities.36–38 In particular, water-soluble antioxidants are predicted to have a significant impact as they play an important role in assisting water-insoluble antioxidants in protection against ROS-induced oxidative damage.39 It is suggested that the fat-soluble lignans (sesamin, sesamol, sesamolin) and glycosylated water soluble lignan (sesaminol triglucoside) play a leading role in the antioxidant activities of the white sesame seeds investigated in current study.
3.6 Inhibition of proliferation in HepG2 cells
The antiproliferative activities are illustrated in Fig. 5. The inhibition of HepG2 cell proliferation by the free fraction appeared to follow a dose-dependent manner. Since a lower EC50 value indicates a higher antiproliferative activity, variety 143-3 exhibited the highest antiproliferative activity with the lowest EC50 value (43.92 ± 1.46 mg mL−1). On the contrary, variety 243-1 had the lowest antiproliferative activity with the highest EC50 value (102.54 ± 0.01 mg mL−1). The antiproliferative activities of remaining varieties were in the decreasing order of 253-2, 166-2, A15-4, and 188-1. Significantly, these concentrations of antiproliferative EC50 were not attributed to the cytotoxic effects (EC50 > 100 mg mL−1).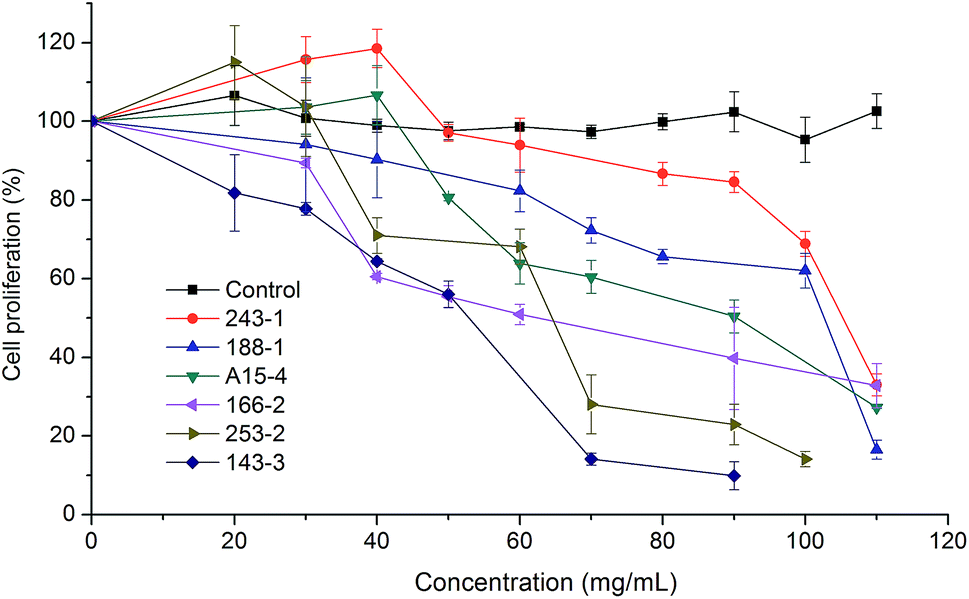 | ||
| Fig. 5 Antiproliferative activity of free fractions of six varieties of white sesame seeds against HepG2 human liver cancer cells (means ± SD, n = 3). | ||
Endogenous oxidative DNA damage has been taken into account to be a significant factor in the initiation of human cancer. The cancer-protective effect of foods is related to the ability of the antioxidants to scavenge free radicals, preventing DNA damage and subsequent mutation.40 In consideration of the premises, the white sesame seeds were evaluated for antiproliferative activity against HepG2 cells. The inhibition of cell proliferation presented a dose-dependent manner after exposure to the free soluble extracts of white sesame seeds. No significant correlation was found between EC50 of antiproliferative activities and phenolics (r = −0.667, p > 0.05). The antiproliferative effects of sesamol, sesamin, and sesamolin have been reported previously.41–43 The sesaminol triglucoside was found to have antiproliferative activity against HepG2 cells.44 It has been suggested that phytochemicals such as phenolics, flavonoids, and anthocyanin in vegetables, fruits, and grains could act as protective agents targeting tumor initiation and promotion.45 In current study, antiproliferative activity may be explained by the combination of the fat-soluble lignans (sesamol, sesamin, and sesamolin) and water soluble lignan (sesaminol triglucoside), which functioned additively or synergistically for the total antiproliferative activity of sesame seeds.
4. Conclusions
The present study indicates that white sesame seeds, with high total contents of phenolics and flavonoids, have significant antioxidant and antiproliferative activities. Interestingly, significant correlations between ORAC values and total phenolics were observed in the current study. A significant portion of phenolic compounds, antioxidant and antiproliferative activities of sesame seed extracts were found in the free fractions. In general, white sesame seeds have promising potential in the development of natural antioxidants and functional foods. Therefore, further studies on the mechanisms of action of antioxidant and antiproliferative activities of white sesame seed extracts are needed in the future.Acknowledgements
The authors are grateful for the financial support provided by the Leading Talent of Guangdong Province, the Science and Technology Program of Guangdong Province (No. 2013B090700008), the Fundamental Research Funds for the Central Universities (2015ZM126).References
- C. A. Rice-Evans and A. T. Diplock, Free Radical Biol. Med., 1993, 15, 77–96 CrossRef CAS PubMed.
- R. H. Liu, J. Food Sci., 2013, 78, A18–A25 CrossRef CAS PubMed.
- L. Wang, J. Chen, H. Xie, X. Ju and R. H. Liu, J. Agric. Food Chem., 2013, 61, 5103–5113 CrossRef CAS PubMed.
- R. H. Liu, J. Cereal Sci., 2007, 46, 207–219 CrossRef CAS.
- A. Sarve, S. S. Sonawane and M. N. Varma, Ultrason. Sonochem., 2015, 26, 218–228 CrossRef CAS PubMed.
- N. Pathak, A. K. Rai, R. Kumari and K. V. Bhat, Pharmacogn. Rev., 2014, 8, 147–155 CrossRef PubMed.
- T. Ide, A. Azechi, S. Kitade, Y. Kunimatsu, N. Suzuki, C. Nakajima and N. Ogata, J. Oleo Sci., 2015, 64, 211–222 CrossRef CAS PubMed.
- S. B. Othman, N. Katsuno, Y. Kanamaru and T. Yabe, Food Chem., 2015, 175, 306–314 CrossRef PubMed.
- A. A. A. Mohdaly, I. Smetanska, M. F. Ramadan, M. A. Sarhan and A. Mahmoud, Ind. Crops Prod., 2011, 34, 952–959 CrossRef CAS.
- J. H. Kim, W. D. Seo, S. K. Lee, Y. B. Lee, C. H. Park, H. W. Ryu and J. H. Lee, J. Funct. Foods, 2014, 7, 495–505 CrossRef CAS.
- Y. F. Chu and R. H. Liu, Life Sci., 2005, 77, 1892–1901 CrossRef CAS PubMed.
- L. Wen, X. Guo, R. H. Liu, L. You, A. M. Abbasi and X. Fu, Food Chem., 2015, 186, 54–62 CrossRef CAS PubMed.
- R. H. Liu and J. Sun, J. Agric. Food Chem., 2003, 51, 1718–1723 CrossRef CAS PubMed.
- H. Wang, J. Wang, X. Guo, C. S. Brennan, T. Li, X. Fu, G. Chen and R. H. Liu, Food Chem., 2016, 205, 170–177 CrossRef CAS PubMed.
- A. S. Bhatnagar, J. Hemavathy and A. G. Gopala Krishna, J. Food Sci. Technol., 2015, 52, 521–527 CrossRef CAS.
- B. Nayak, R. H. Liu, J. D. J. Berrios, J. Tang and C. Derito, J. Agric. Food Chem., 2011, 59, 8233–8243 CrossRef CAS PubMed.
- K. L. Wolfe and R. H. Liu, J. Agric. Food Chem., 2007, 55, 8896–8907 CrossRef CAS PubMed.
- D. L. Felice, J. Sun and R. H. Liu, J. Funct. Foods, 2009, 1, 109–118 CrossRef.
- X. Jiang, T. Li and R. H. Liu, J. Agric. Food Chem., 2016, 64, 1806–1816 CrossRef CAS PubMed.
- J. R. Sarkis, I. Michel, I. C. Tessaro and L. D. F. Marczak, Sep. Purif. Technol., 2014, 122, 506–514 CrossRef CAS.
- K. K. Adom and R. H. Liu, J. Agric. Food Chem., 2002, 50, 6182–6187 CrossRef CAS PubMed.
- J. Yang, R. H. Liu and L. Halim, LWT--Food Sci. Technol., 2009, 42, 1–8 CrossRef CAS.
- Y. Zhu, T. Li, X. Fu, A. M. Abbasi, B. Zheng and R. H. Liu, J. Funct. Foods, 2015, 19, 439–450 CrossRef CAS.
- R. H. Liu, Adv. Nutr., 2013, 4, 384S–392S CrossRef CAS PubMed.
- N. Rangkadilok, N. Pholphana, C. Mahidol, W. Wongyai, K. Saengsooksree, S. Nookabkaew and J. Satayavivad, Food Chem., 2010, 122, 724–730 CrossRef CAS.
- F. F. Liu, C. Y. W. Ang and D. Springer, J. Agric. Food Chem., 2000, 48, 3364–3371 CrossRef CAS PubMed.
- H. Katsuzaki, S. Kawakishi and T. Osawa, Phytochemistry, 1994, 35, 773–776 CrossRef CAS PubMed.
- B. Xu and S. K. C. Chang, J. Agric. Food Chem., 2008, 56, 9102–9113 CrossRef CAS PubMed.
- L. B. de Carvalho-Silva, A. P. Dionisio, A. C. D. Pereira, N. J. Wurlitzer, E. S. de Brito, G. A. Bataglion, I. M. Brasil, M. N. Eberlin and R. H. Liu, LWT--Food Sci. Technol., 2014, 59, 1319–1324 CrossRef.
- M. W. Zhang, R. F. Zhang, F. X. Zhang and R. H. Liu, J. Agric. Food Chem., 2010, 58, 7580–7587 CrossRef CAS PubMed.
- C. de la Parra, S. O. Serna Saldivar and R. H. Liu, J. Agric. Food Chem., 2007, 55, 4177–4183 CrossRef CAS PubMed.
- K. L. Wolfe and R. H. Liu, J. Agric. Food Chem., 2008, 56, 8404–8411 CrossRef CAS PubMed.
- A. A. Moazzami, R. E. Andersson and A. Kamal-Eldin, J. Agric. Food Chem., 2006, 54, 633–638 CrossRef CAS PubMed.
- K. P. Suja, A. Jayalekshmy and C. Arumughan, J. Agric. Food Chem., 2004, 52, 912–915 CrossRef CAS PubMed.
- S. Ben Othman, N. Katsuno, Y. Kanamaru and T. Yabe, Food Chem., 2015, 175, 306–314 CrossRef CAS PubMed.
- A. Kamal-Eldin and L. Å. Appelqvist, J. Am. Oil Chem. Soc., 1994, 71, 149 CrossRef CAS.
- W.-H. Wu, Food Chem., 2007, 104, 341–344 CrossRef CAS.
- B. Liu, X. Guo, K. Zhu and Y. Liu, Food Chem., 2011, 129, 799–803 CrossRef CAS PubMed.
- K. Ajisaka, S. Agawa, S. Nagumo, K. Kurato, T. Yokoyama, K. Arai and T. Miyazaki, J. Agric. Food Chem., 2009, 57, 3102–3107 CrossRef CAS PubMed.
- R. H. Liu, Am. J. Clin. Nutr., 2003, 78, 517S–520S CAS.
- Y. Miyahara, H. Hibasami, H. Katsuzaki, K. Imai and T. Komiya, Int. J. Mol. Med., 2001, 7, 369–371 CAS.
- C. Mahendra Kumar, U. V. Sathisha, D. Shylaja, A. G. Appu Rao and A. S. Sridevi, Biochimie, 2011, 93, 562–569 CrossRef CAS PubMed.
- P. Deng, C. Wang, L. Chen, C. Wang, Y. Du, X. Yan, M. Chen, G. Yang and G. He, Biol. Pharm. Bull., 2013, 36, 1540–1548 CAS.
- X. Zhu, PHD, Nanjing Agricultural University, 2013.
- J. Liu, H. Dong, B. Chen, P. Zhao and R. H. Liu, J. Agric. Food Chem., 2009, 57, 297–304 CrossRef CAS PubMed.
Footnote |
| † Electronic supplementary information (ESI) available. See DOI: 10.1039/c6ra26596k |
| This journal is © The Royal Society of Chemistry 2017 |