
 Open Access Article
 This Open Access Article is licensed under a Creative Commons Attribution-Non Commercial 3.0 Unported Licence
Improving the activity of endoglucanase I (EGI) from Saccharomyces cerevisiae by DNA shuffling
Xu Wang ab,
Liang Rongc,
Mingfu Wanga,
Yingjie Pana,
Yong Zhao*a and
Fang Tao*b
ab,
Liang Rongc,
Mingfu Wanga,
Yingjie Pana,
Yong Zhao*a and
Fang Tao*b
aCollege of Food Science and Technology, Shanghai Ocean University, Shanghai, China. E-mail: yzhao@shou.edu.cn
bSchool of Life Sciences, Anhui Agricultural University, Anhui, China. E-mail: taofang007@126.com
cUSC School of Pharmacy, University of Southern California, Los Angeles, 1985 Zonal Ave, USA
First published on 29th September 2017
Abstract
To enhance the specific endo-β-1,4-glucanase activity (EGI) of three mixed substances: Trichoderma sp. (Trichoderma reesei, Trichoderma longibrachiatum, and Trichoderma pseudokoningii), we optimized the efficiency of the encoding gene, eg1, using DNA shuffling and Saccharomyces cerevisiae INVSc1 as a host. One variant, SEGI8 (the high activity protein encoded by eg1 gene using DNA shuffling) was found through screening approximately 1000 variants. The extracellular enzyme work of SEGI8 reached its highest level when cultured for 96 h, at 50 °C and a pH of 5.6, akin to the wild types. Clone harboring of the best mutant SEGI8 (selected via first-round mutagenesis) produced 169–257% more activity than transformants with three wild-type EGIs. Mutant SEGI8 produced by the clone showed broad pH stability (5.6–6.6) while performing comparable thermotolerance (60–70 °C) compared to wild EGIs; it also showed a high homology of 95%, 96%, and 97%, identical to the EGI of T. reesei, T. longibrachiatum, and T. pseudokoningii, respectively. Analysis of the sequences indicated that four point mutations causing amino acid substitution (V10A/G100S/F192L/S318G) were replaced. The major structure of the active site in SEGI8 was comprised of loop regions, with the same location as β-helix in NTEGI (the protein encoded by eg1 genes in T. reesei). It has been suggested that the mutation S318G might affect substrate binding and improved actions based on an analysis of the predicted 3D structural-modeling of SEGI8. Overall, this novel system could facilitate cellulose activity and create a foundation for constructing an efficient cellulose degradation system.
1. Introduction
Cellulose, the most abundant polysaccharide, has the largest number of renewable resources in nature. There are about 10 billion tons of dry vegetal products produced in the world every year, of which more than half are cellulose or hemicellulose.1 However, the majority of agricultural products are discarded, and only a small portion is utilized. Thus, it is important to develop efficient ways to utilize these renewable resources. A process of cellulose degradation would provide a significant contribution toward solving these environmental and ecological problems.2The degradation of cellulose by microorganisms has been considered a major step in Earth's carbon cycle. According to the most widely accepted view, the hydrolysis of cellulose provides an ideal way to achieve this degradation with minimal contamination. It is known that the enzymatic hydrolysis of cellulose is a complex heterogeneous reaction and that cellulose can be degraded by three major types of enzyme components acting synergistically at the substrate level: endoglucanases (endo-β-1,4-glucanases; EG), cellobiohydrolases (exo-β-1,4-glucanase; CBH), and β-1,4-glucosidase (BG).3–6 Endoglucanases catalyze the hydrolysis of internal bonds inside the cellulose chains and randomly yield new small-molecular cellulose. Cellobiohydrolases especially attack the nonreducing chain ends, releasing cellobiose, and β-glucosidase active on the cellobiose releasing glucose monomer units from it.2,7 Contributing to the first step of bioconversion, endoglucanases play an important role in degrading cellulose. Four endoglucanases, EGI (Cel7B), EGII (Cel5A), EGIII (Cel12A), and EGV (Cel45A), represent, respectively, approximately 15%, 10%, 1%, and <1% of the total cellulase content.8,9 Importantly, EGI consists of two distinct domains connected by an O-glycosylated flexible-linker region, namely a cellulose-binding domain (CBD) and a larger catalytic domain (CD). EGI also has the most efficient hydrolysis capacity for crystalline cellulose in the fungal cellulase systems known as glycosyl hydrolase family 7 according to the classification by Henrissat et al.10,11 For example, EGI is the major endoglucanase in Trichoderma reesei, which accounts for 510% of the total amount of cellulolytic enzymes produced by this important fungus.12 Therefore, research on EGI by protein engineers can greatly help in creating a way to degrade cellulose efficiently.
Many organisms can digest cellulose, including insects, microbes, actinomycetes, fungi, and animals.13–15 One novel endoglucanase that has been reported is encoded by the Ba-ega gene in Bacillus spp., and although it has a high temperature stability, its activity is low. In other words, the majority of endoglucanases in Bacillus spp. have no activity on cellulose.16 Many cellulase genes have also been cloned from animal origins such as termites, nematodes, longicorn beetles, and others.17,18 However, because of the complex post-translational modification state, the cellulases from animal origins have lower expression levels. Therefore, the utilization of cellulases from fungi is considered an international hot spot, especially those from Trichoderma spp.19,20
Many studies in the past have reported on cellulase genes from Trichoderma spp. being successfully expressed in Saccharomyces cerevisiae and Escherichia coli.21,22 The technique was recently used to screen cellulases in directed-mutagenesis mutants for increased enzymatic activity. Directed evolution is regarded as a powerful alternative to other methods that optimize for enzyme properties by generating random genetic libraries and screening for specific characteristics.23,24 Oligonucleotide-directed mutagenesis, error-prone PCR, and DNA shuffling are the primary screening systems for directed evolution to generate highly recombined genes and evolved enzymes.25,26 DNA shuffling has a novel ability to rapidly recombine homologous genes in vitro, making it a convenient and effective method for site-directed mutagenesis.27 Thus far, only error-prone PCR and oligonucleotide-directed mutagenesis have been applied to improve the activity of endoglucanases. Nakazawa et al. showed that the specific activity of EGIII in T. reesei was enhanced by the directed evolution of its encoding gene (egI3) using error-prone PCR and screening for activity in E. coli.28 Lin et al. obtained two endoglucanase Cel8M mutations by screening approximately 1000 directed-evolution variants in E. coli.29 The endoglucanase I and II genes (eg1 or Cel7B and eg11 or Cel5A) of T. reesei QM6a were cloned and successfully expressed in S. cerevisiae under the transcriptional control of yeast ENO1 through random mutagenesis of the plasmid.30 However, no studies have reported engineering EGI by using DNA shuffling for directed evolution.
In this study, we first tried to perform the directed evolution trial on endoglucanase I (EGI) from three Trichoderma sp. (T. reesei, T. pseudokoningii and T. longibrachiatum) to improve cellulose hydrolysis, by employing DNA shuffling and screening. One EGI variant was found to higher enzymatic compared to the wild type versions when both the transformant variants and wild types were expressed in the yeast strain S. cerevisiae INVSc1 and extracellular activity displayed by this host. We reported here that this research by focused mutagenesis could gain new insights in the relationship between whole EGI protein and enzymatic activity.
2. Material and methods
2.1 Strains, media, and cultivation
The three Trichoderma spp. strains (Trichoderma reesei, Trichoderma pseudokoningii, and Trichoderma longibrachiatum) were purchased from the China General Microbiological Culture Collection Center (Beijing, China) (Table 1). Escherichia coli DH5α was used as the cloning host for the recombinant DNA manipulations and plasmid propagation. The strain was cultivated in Luria–Bertani broth supplemented with 100 μg mL−1 ampicillin at 37 °C.31 Saccharomyces cerevisiae INVSc1 (Thermo Fisher Scientific, Lafayette, Co.) was used as the expression host for the cellulases and was cultured in YPD medium (10 g L−1 yeast extract, 20 g L−1 peptone, and 20 g L−1 glucose) on a rotary shaker (150 rpm) at 30 °C in 200 mL Erlenmeyer flasks. The yeast strains were maintained on YPD agar (15 g L−1) plates. The yeast transformants were selected on synthetic complete medium that lacked uracil (SC-U) with 2% glucose and were grown at 30 °C for 24–48 h.32 Two percent galactose was added to SC-U to screen for positive transformants following the introduction of the recombinant DNA. Enzymatic activity was detected on SC-U agar (20 g L−1) plates containing 2% galactose.| Strain or plasmid | Genotype | Source/reference |
|---|---|---|
| a China General Microbiological Culture Collection Center (Beijing, China). | ||
| Strains | ||
| Trichoderma reesei (AS3.3711) | Wild type | C.G.M.C.C.Ca |
| Trichoderma pseudokoningii (AS3.3002) | Wild type | C.G.M.C.C.C. |
| Trichoderma longibrachiatum (AS3.1029) | Wild type | C.G.M.C.C.C. |
| Escherichia coli DH5α | supE44 ΔlacU169 (Φ80lacZΔM15) hsdR17 recA1 endA1gyrA96 thi-1 relA1 | 31 |
| Saccharomyces cerevisiae INVSc1 | (C810-00) MATa his3D1 leu2 trp1-289 ura3-52 MAT his3D1 leu2 trp1-289 ura3-52 | Thermo Fisher corporation |
![[thin space (1/6-em)]](https://www.rsc.org/images/entities/char_2009.gif) |
||
| Plasmids | ||
| pMD-18T | Clone vector | Takara corporation |
| pYES-α-factor | Expression vector (pYES2.0 with α-factor signal peptide) | This laboratory |
2.2 Plasmid construction
Genomic DNA from the Trichoderma spp. was extracted by the standard protocols provided with the MiniBEST Plant Genomic Extraction Kit (Takara, Japan). The enzymes used for the restriction digests and ligations were purchased from Takara Biotechnology (Takara, Japan). Polymerase chain reactions (PCR) were performed with a Biometra TGradient PCR System using Takara Premix Taq™ version 2.0 polymerase (Takara, Japan) according to the supplier's specifications. The primers used in this study are listed in Table 2. A sketch of the splice overlap extension (SOE)-PCR process is shown in Fig. 1. First, the complete eg1 gene (named Feg1) was PCR amplified from T. reesei AS3.3711 genomic DNA using P1 and P2. Second, exon 1 in Feg1 was obtained using gene splicing by overlap extension PCR (SOE-PCR) with P1 and P3 as the primers. Exon 2 + 3 was amplified by SOE-PCR using P4 and P5, and exon 1 + 2 + 3 was amplified by SOE-PCR using P1 and P5. Exon 1 + 2 + 3, which lacks two introns, additionally contained the signal peptide sequence from the FTeg1 gene. Exon 1 + 2 + 3 was subsequently cloned into the pMD-18T vector (Takara, Japan) and confirmed by sequencing. This plasmid was named pMD-exon 1 + 2 + 3. Finally, the no-signal peptide sequence named Neg1 was amplified from the plasmid pMD-exon 1 + 2 + 3 by PCR using P1 and P8 (EcoRI and BamHI sites are underlined). The Neg1 gene was cloned into the expression vector pYEα, which contained the α-factor promoter. The coding region for the α-factor signal was amplified by PCR using the pPIC9K vector (Invitrogen Corporation, Carlsbad, CA) as a template, which carries the α-factor secretion signal to target recombinant proteins to the growth medium.33 The construction methods for the expression plasmids derived from T. pseudokoningii and T. longibrachiatum were the same as those used for T. reesei. In summary, we obtained the expression plasmids pYEα-NTeg1 (from T. reesei), pYEα-NPeg1 (from T. pseudokoningii), and pYEα-NLeg1 (from T. longibrachiatum).| Primer name | Sequence (5′–3′) | Restriction digestion site |
|---|---|---|
| eg1 (T. ressei) | ||
| P1 | TGGAATTCATGGCGCCCTCAGTTACACTGC | EcoRI |
| P2 | GCGGATCCCTAAAGGCATTGCGAGTAGTC | BamHI |
| P3 | TCCGGGGCCGTAGTAGCTTTTGTAGCCGCTGC | |
| P4 | GCAGCGGCTACAAAAGCTACTACGGCCCCGGA | |
| P5 | GGCAAGCTTCTAAAGGCATTGCGAGTAGTAGTCGTTGCTATACTG | HindIII |
| P7 | TTGAATTCCAGCAACCGGGTACCAGCAC | EcoRI |
| P8 | GCGGATCCCAGCAACCGGGTACCAGCAC | BamHI |
|
||
| eg1 (T. pseudokoningii and T. longibrachiatum) | ||
| LP1 | TAGAATTCATGGCGCCCTCAGCTACACTGC | EcoRI |
| LP2 | GCGGATCCCTAGAGGCATTGCGAGTAGT | BamHI |
| LP3 | TCCGGGGCCGAAGTAGTTCGGGTAGCCGCTGC | |
| LP4 | GCAGCGGCTACCCGAACTACTTCGGCCCCGGA | |
| PP5 | CTAGAGGCATTGCGAGTAGTAATCATTGCCATACTG | |
| PP6 | TAGAATTCCAGCAACCGGGCACCAGCAC | EcoRI |
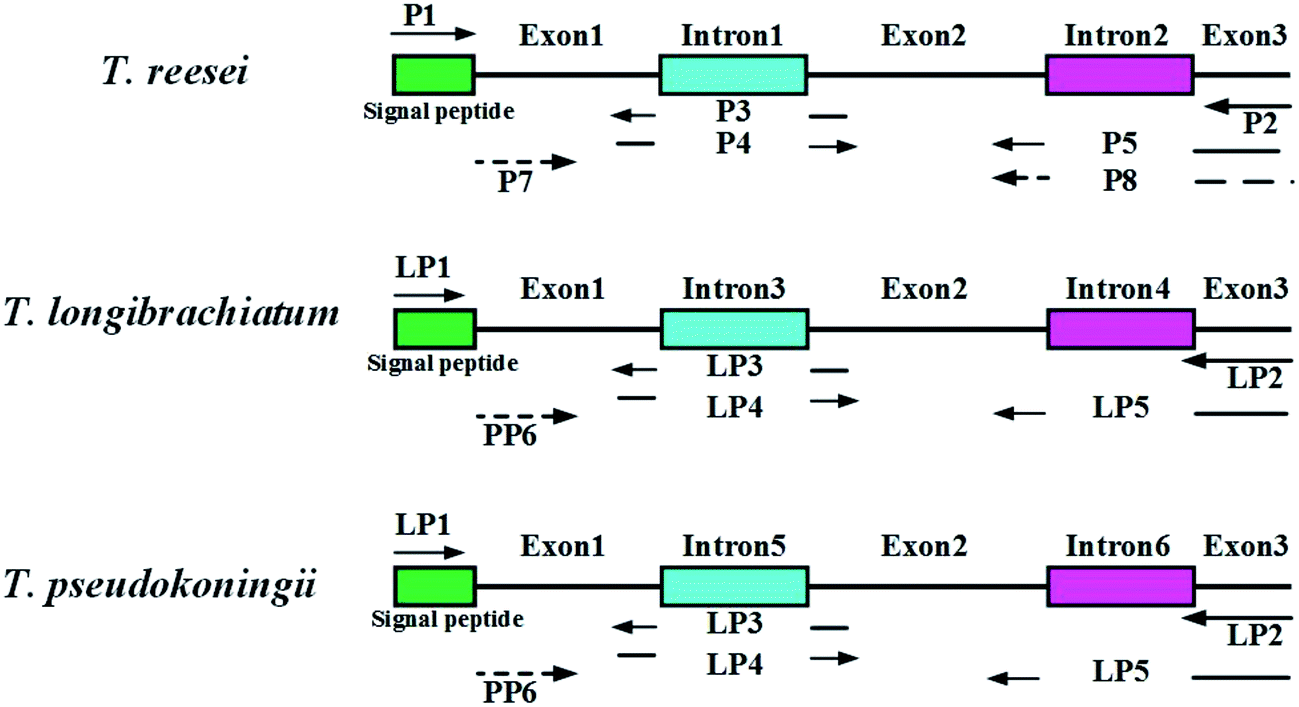 | ||
| Fig. 1 Construction of endoglucanase I (EGI) mature peptide of three wild type Trichoderma sp. Two introns and one signal peptide of eg1 gene were removed by SOE-PCR. | ||
2.3 DNA shuffling
DNA shuffling is a method for the in vitro homologous recombination of selected mutant genes by random fragmentation and PCR reassembly. To screen for a highly active EGI, we used DNA shuffling generated by a modified method found in the literature.34 The recombinant plasmids pYEα-NTeg1, pYEα-NPeg1, and pYEα-NLeg1 were used as templates to amplify the Neg1 fragments separately with the primers P7/P8, PP6/LP2, and PP6/LP2, respectively. Following purification, 8 μg of the three PCR products were mixed and randomly fragmented by DNaseI for 5 min at 16 °C. The purified fragments of 50–100 bp were used in primerless PCR reactions to reassemble into full-length genes using the following the program: 90 s at 96 °C; 35 cycles of 94 °C for 30 s, 65–0.7 °C per cycle for 90 s, 90 s + 3 s per cycle at 72 °C; and 10 min at 72 °C. The reassembled genes of the correct size were obtained by using the primerless PCR reaction products (1/10 dilution) as template with P7/P8 and PP6/LP2 as specific primers.35 The program for the PCR reactions with primers was as follows: 94 °C for 2 min; 25 cycles of 30 s at 94 °C, 55 s at 45 °C, 90 s at 72 °C; and 72 °C for 5 min. The resulting recombinants were transformed into S. cerevisiae INVSc1 (Matα, his3-Δ1, leu2, trp1-289, ura3-52; Invitrogen) competent cells to screen for the evolved mutants.2.4 Yeast transformation
Saccharomyces cerevisiae INVSc1 cells were grown in YPD-galactose prior to transformation, then plated directly onto SC medium containing galactose and lacking uracil (SC-U-GL) to select for transformants.36 The three purified wild-type Neg1 genes and the primer PCR reaction product Seg1 from the DNA shuffling were digested with BamHI and EcoRI and ligated into the pYEα expression vector that had been digested with the same enzymes. The pYEα plasmid contains the ampicillin resistance gene (for selection in E. coli) and URA3 (for uracil prototrophy selection in INVSc1 cells), with expression of the target gene controlled by the GAL1 promoter and induced by galactose. The recombinant plasmids were transformed into the S. cerevisiae INVSc1 cells using the lithium acetate/DMSO method described by Hill et al.37 The transformants were selected for growth on SC-U-GL plates.2.5 Screening EGI mutants with improved activities by Congo red staining method
The transformed clones containing the wild EGI genes and mutated EG I genes were picked up and spotted on the SC-U-CMC-G plates [SC-U-GA with 1% carboxymethyl cellulose (CMC), D-galactose and 2% agar]. After incubation at 30 °C for 72 h, the plates were stained with 0.1% Congo red (Amresco, USA) solution for 30 min. The Congo red solution was poured off and the plates were rinsed with 1 M of NaCl for 30 min for the sake of displaying the halos generated from the hydrolysis of the CMC substrate in the plates by the all EGI wild types and variants.29 The EGI variants showing the larger halos than that of the wild types was chosen for the further research.2.6 Characterization of EGI and its variant SEGI8
The carboxymethyl cellulase (CMCase) activities of the three EGIs and SEGI8 were determined by measuring the amount of glucose released from carboxymethyl cellulose sodium (CMC-Na) using the 3,5-dinitrosalicylic acid (DNS) method with glucose as a standard.38 The reaction mixtures contained 2 mL of 10 g L−1 CMC-Na in 0.05 M citrate buffer (pH 4.8) and 1 mL of each enzyme solution appropriately diluted with the same buffer. As a control, an aliquot of each diluted enzyme solution was first heat-inactivated in a boiling-water bath for 5 min. After a short incubation at 50 °C for 10 min, the control reactions were terminated by adding 1.5 mL of DNS, while the sample reactions were incubated at 50 °C for 1 h before being terminated. All of the sample mixtures were also heat-inactivated by mixing well and incubating in a boiling-water bath for 5 min before cooling to room temperature. A microplate reader (BioTeck, HTX, USA) was used to measure the absorbance of the reaction solutions at 540 nm.The International Unit (IU) of activity is defined as the amount of enzyme that liberates 1 μmol of glucose per minute in a standard assay.39 The optimum culture times for NTEGI (protein encoded by Neg1 genes), NLEGI (protein encoded by Leg1 genes), NPEGI (protein encoded by Peg1 genes), and SEGI8 were determined by measuring the IU of CMCase activity at different culture times (48–168 h) with CMC-Na. The optimal working temperatures for NTEGI, NLEGI, NPEGI, and SEGI8 were determined by evaluating their activities at temperatures ranging from 30 °C to 70 °C. The optimal working pHs for NTEGI, NLEGI, NPEGI, and SEGI8 were determined by evaluating their maximal activities in buffer conditions (Na2HPO4–NaH2PO4) ranging from pH 3.2 to 6.6.
2.7 Sequence analysis
Phyre 2.0 server (http://www.sbg.bio.ic.ac.uk/phyre) was employed to create the homology model of SEGI8 using NTEGI structure (PDB code: 1EG1) as a template.40 Multiple protein sequence alignment was performed using Clustal X41 and ESPript 3.0 web tool (http://espript.ibcp.fr/ESPript/cgi-bin/ESPript.cgi). Structure visualization and analysis were achieved by using the PyMOL (http://www.pymol.org/).423. Results
3.1 Cloning and sequence analysis of the wild type eg1
The complete eg1 genes (FTeg1, FLeg1, and FPeg1) were amplified by using genomic DNA as the template. The FTeg1, FLeg1, and FPeg1 fragments contained 1507 bp, 1566 bp, and 1566 bp, respectively. Based on a sequence homology analysis conducted with the ClustalW program, FTeg1 showed very high identities with FLeg1 (90%) and FPeg1 (90%).43,46 Specifically, FLeg1 had a very high similarity to FPeg1 (99%). Following SOE-PCR, exon 1 + 2 + 3 fragments (mature peptide) from FTeg1, FLeg1, and FPeg1 (1380 bp in FTeg1, 1386 bp in FLeg1, and 1386 bp in FPeg1) were obtained (Table 3, Fig. 1). None of the single peptide sequences (NTeg1, NLeg1 and NPeg1) amplified from the three exon 1 + 2 + 3 fragments contained 1314 bp, 1320 bp, or 1320 bp, respectively.| Kinds of Trichoderma sp. | Primers | DNA fragment for PCR | Description |
|---|---|---|---|
| T. reesei | P1/P2 | 1507 bp full sequence | FTeg1 |
| P1/P3 | 770 bp exon 1 | ||
| P4/P5 | 610 bp exon 2 + 3 | ||
| P1/P5 | 1380 bp exon 1 + 2 + 3 | ||
| P7/P8 | No signal peptide sequence | NTeg1 | |
| T. longibrachiatum | LP1/LP2 | 1566 bp full sequence | FLeg1 |
| LP1/LP3 | 770 bp exon 1 | ||
| LP4/LP5 | 616 bp exon 2 + 3 | ||
| LP1/LP5 | 1386 bp exon 1 + 2 + 3 | ||
| PP6/LP2 | No signal peptide sequence | NLeg1 | |
| T. pseudokoningii | LP1/LP2 | 1566 bp full sequence | FPeg1 |
| LP1/LP3 | 770 bp exon 1 | ||
| LP4/LP5 | 616 bp exon 2 + 3 | ||
| LP1/LP5 | 1386 bp exon 1 + 2 + 3 | ||
| PP6/LP2 | No signal peptide sequence | NPeg1 |
3.2 DNA shuffling and screening variants with the most improved activities by Congo red staining
We used the Congo red staining method to screen EGI variants expressed from the mutated eg1 gene library that was generated to improve activity. After screening approximately 1000 transformants, 8 were found to have considerably larger halos than the EGI wild types (data not shown). The protein variants expressed by these transformants were considered to have improved activities compared to the three wild types, NTEGI, NLEGI and NPEGI. One protein variant, SEGI8, repeatedly produced larger halos than the other transformants and wild-type EGIs in multiple tests, and it was chosen for further analysis (Fig. 2).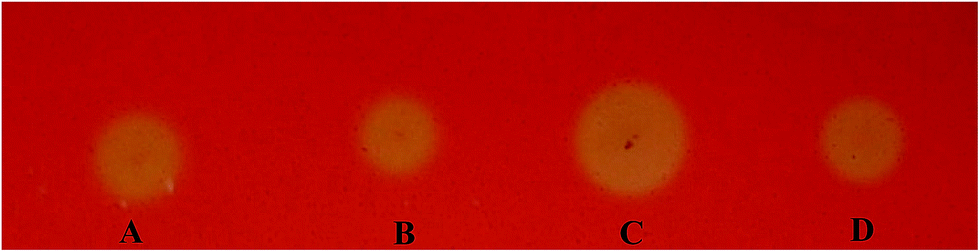 | ||
| Fig. 2 Halos formed by variants with improved activities detected by Congo red staining assay. (A) INVSc1 harboring the plasmid pYEα-NLeg1 transformants; (B) INVSc1 harboring the plasmid pYEα-NlegI transformants; (C) INVSc1 harboring the plasmid pYEα-SegI8 transformants; (D) INVSc1 harboring the plasmid pYEα-NPegI transformants. | ||
3.3 Sequence analysis of SEGI8
Based on the sequence homology analysis, SEGI8 was assigned to glycosyl hydrolase family 7, showing very high identities with the EGIs from T. reesei (95%, NTEGI), T. longibrachiatum (96%, NLEGI), and T. pseudokoningii (97%, NPEGI).44 The multiple sequence alignment was performed using the ClustalX program and ESPript 3.0 (Fig. 3). The results showed that SEGI8 had four residues with point mutations that caused amino acid substitutions, with Ala10, Ser100, Lys192, and Gly318 substituting for the Val10, Gly100, Phe192, and Ser318, respectively, present in the three wild type EGIs (marked with yellow background). V10A and F192L did not change the hydrophobicity, while G100S and S318G changed the hydrophilicity. In addition, SEGI8 had 19 residues (including the four residues with point mutations) that differed from those in NTEGI (PDB Code: 1EGI), which are shadowed with white.45 Sixteen active-site residues are labeled with pink asterisks.8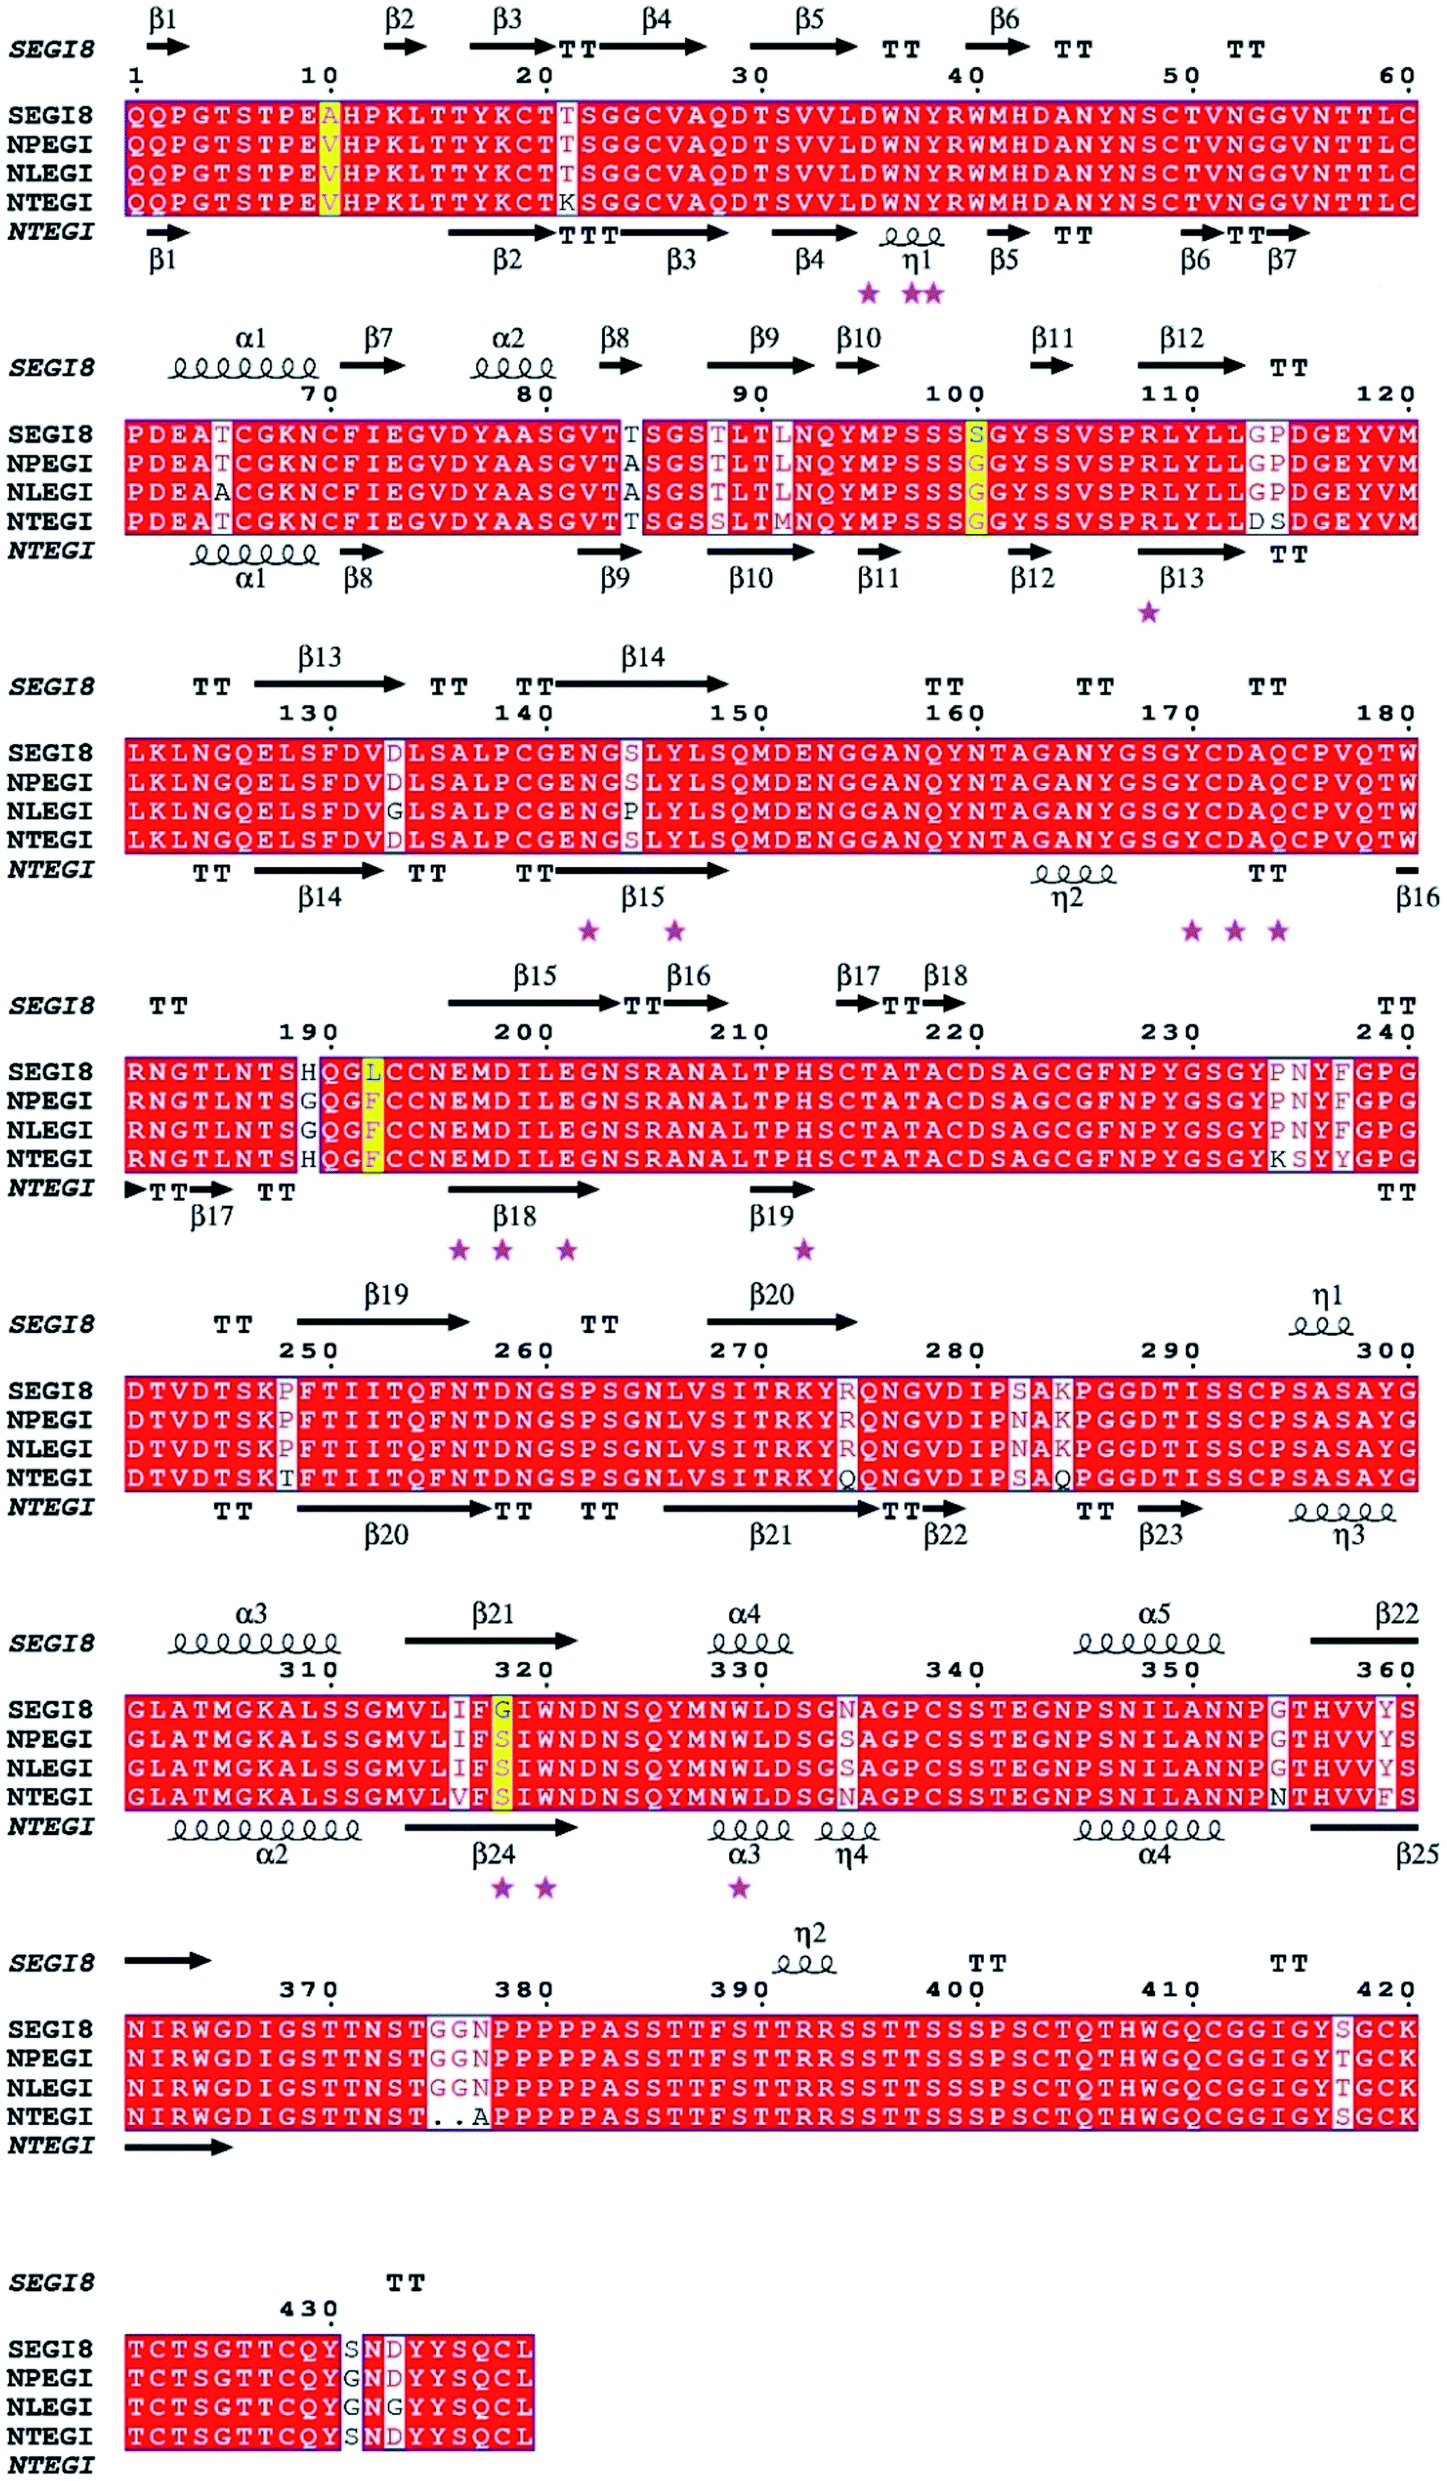 | ||
| Fig. 3 Multiple sequence alignment of EGI with similar endoglucanases between SEGI8 and three wild types. The red letters in yellow background indicate four point mutant residues (V10A/G100S/F192L/S318G). Partial different residues were shaded in white background. The white letters in white boxes indicate similarity. The active-site referring to T. reesei are indicated by pink pentagrams (★). The multiple sequence alignment was performed using ClustalX program and ESPript 3.0 (http://www.espript.ibcp.fr). | ||
3.4 Analysis of EGI enzymatic activity
The enzyme activities of NTEGI, NPEGI, NLEGI, and SEGI8 are shown in Fig. 4. All four EGIs had maximal activity at pH 5.6. The activity levels of these four EGIs increased from pH 3.3 to pH 5.6 and then rapidly decreased from pH 5.6 to pH 6.0. However, the activity levels of NLEGI and SEGI8 increased again from pH 6.0 to pH 6.6, although they were less than that at pH 5.6. NTEGI, NPEGI, NLEGI, and SEGI8 exhibited activity at temperatures ranging from 30 °C to 50 °C as shown in Fig. 4B, with optimal activities at 50 °C. Additionally, the activity levels of the four EGIs increased from 30 °C to 50 °C, decreased from 50 °C to 60 °C, and weakly increased again from 60 °C to 70 °C. Importantly, SEGI8 showed a higher activity level than the wild-type NEGIs at all times. As shown in Fig. 4C, NLEGI, NTEGI, and SEGI8 reached their maximal activity levels at 96 h, while the activity of NPEGI was at a maximum at 72 h. The extracellular enzyme activity of SEGI8 approached its highest level of 1.97 U mL−1 when cultured for 96 h, which is about 1.9 times higher than the average of the three wild-type NEGIs. Specifically, SEGI8 showed 1.99-fold, 2.22-fold, and 1.69-fold increases in activity over NTEGI, NPEGI, and NLEGI, respectively.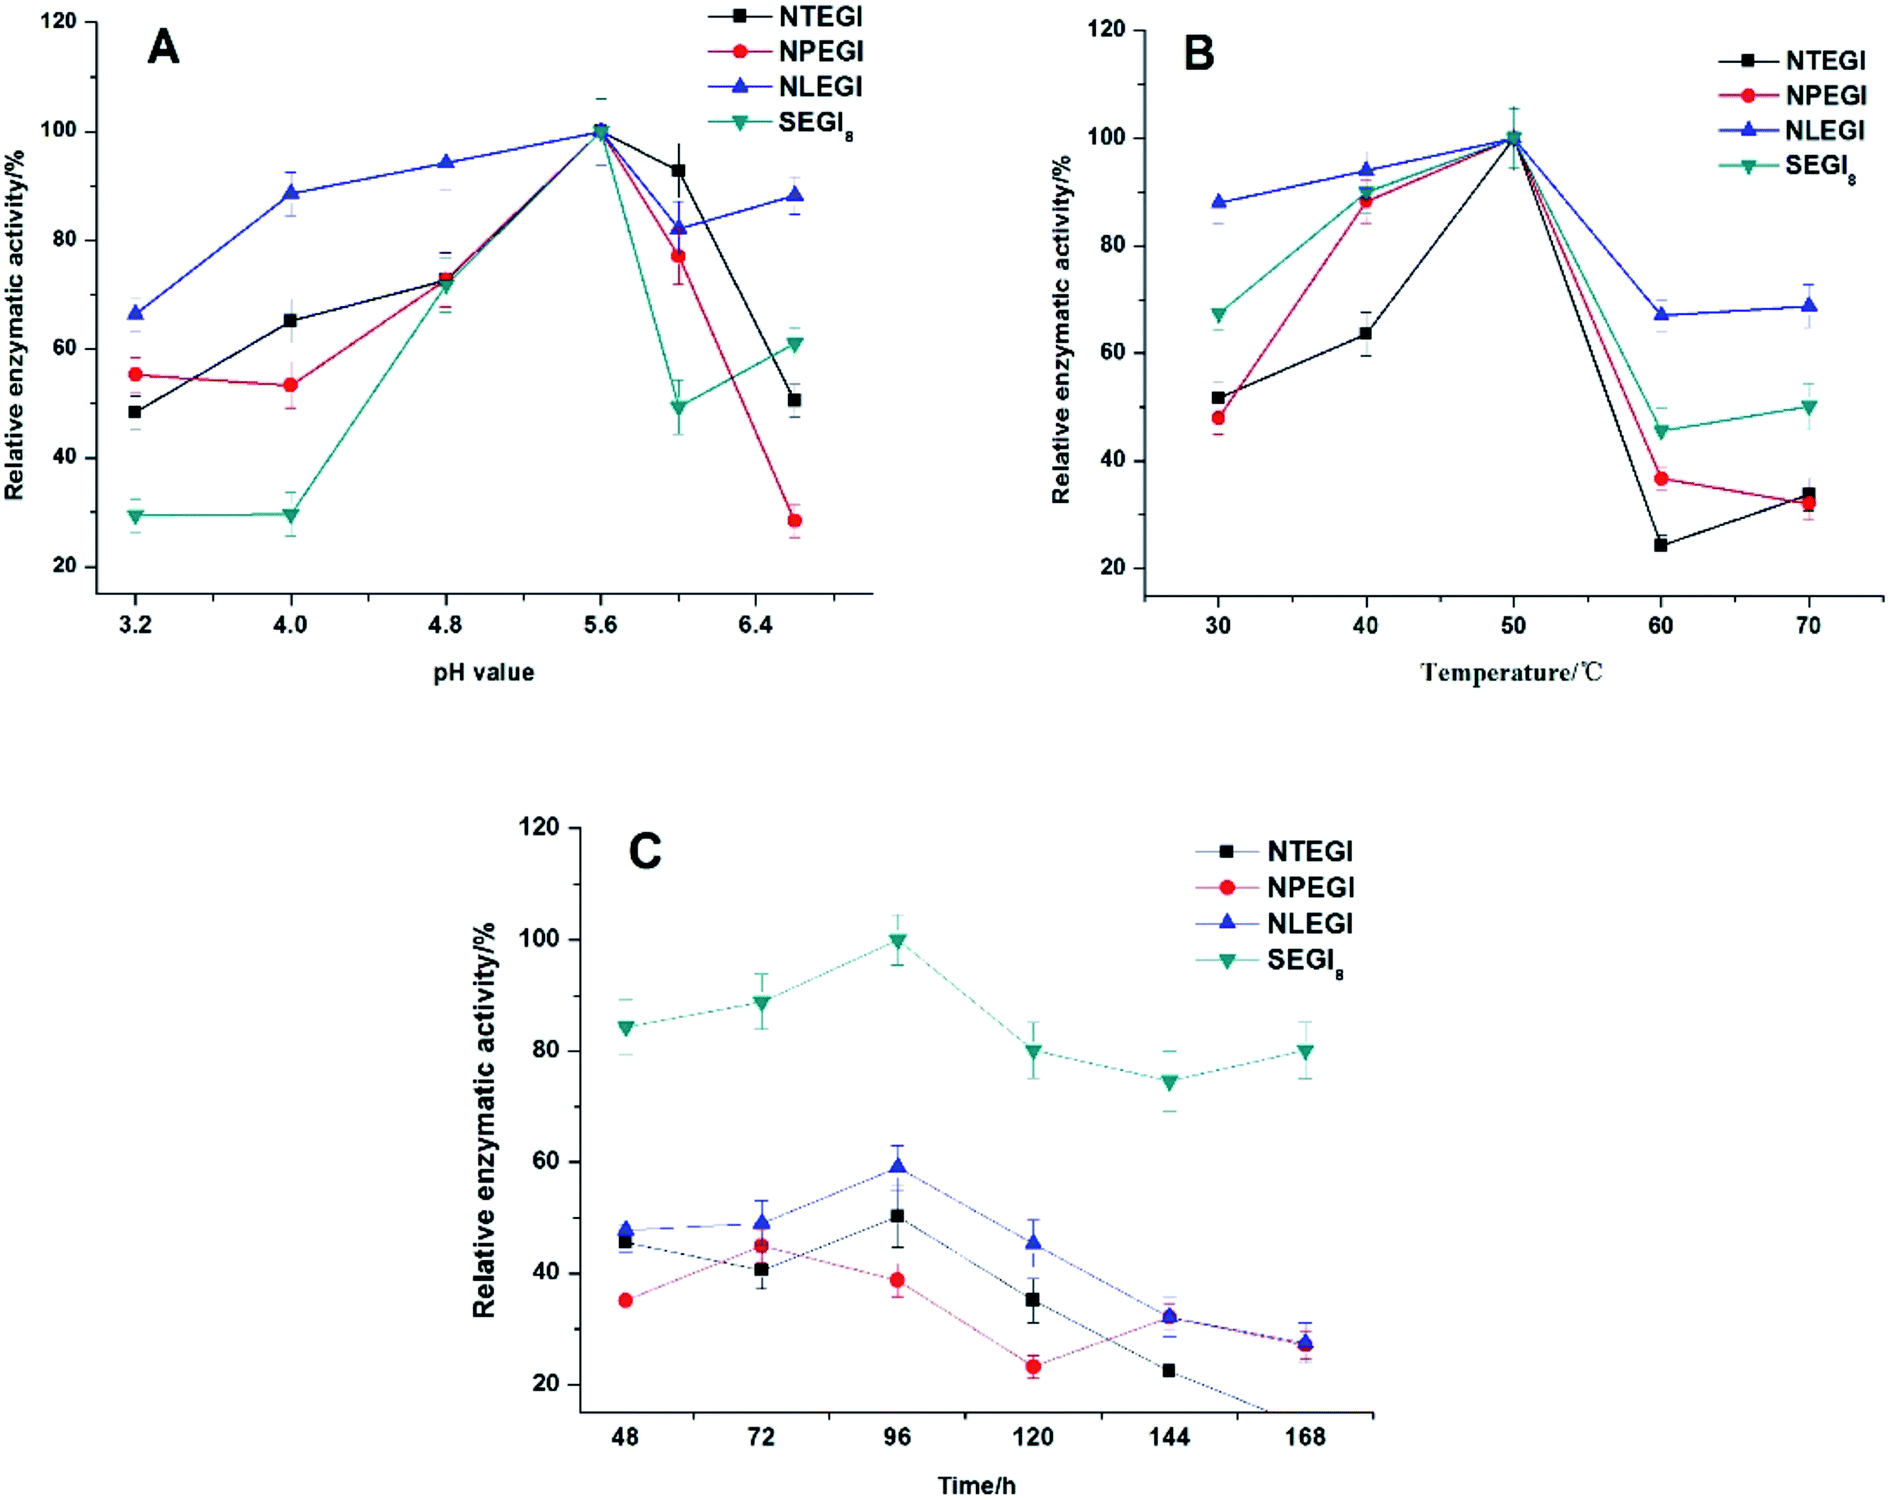 | ||
| Fig. 4 Effect of pH, temperature and time on enzyme activity. (A) Effect of pH value on enzyme activity. Enzyme activity was measured in the different buffers with pH ranging from 3.2 to 6.6 at 50 °C for 120 min. The maximum activity observed was taken as 100%. (B) Effect of temperature on enzyme activity. The reaction was carried out at the temperatures ranging from 30 °C to 70 °C. The maximum activity observed was taken as 100%. (C) Effect of time on enzyme stability. The samples was measured at different times ranging from 48 h to 168 h at 50 °C. The maximum activity observed was taken as 100%. Error bars represent the means and standard deviations based on three replicates. | ||
3.5 3D structural modeling analysis
The relative locations of the substituted amino acid residues could be located in the modeled 3D structure (Fig. 5). The predicted structure of SEGI8 (colored brown) was similar to that of NTEGI (colored green; PDB code: 1EGI). After alignment, the position of three residues, the substitutions V10A, G100S, and F192L, were located in three different loop regions on the surface of SEGI8. Substitution S318G was positioned in a center β-sheet, which was located in the β-sandwich core. Importantly, a comparison of the β-sandwich cores of NTEGI and SEGI8 revealed that they have different substrate-binding grooves, with both proteins having their active site located in an open cleft (red color in NTEGI and from 194C to 207N in SEGI8). However, the major structure of the active site in SEGI8 was a loop region, while the same location was a β-sandwich in NTEGI. Moreover, a similar change occurred at the bottom of the substrate-binding grooves (purple color in NTEGI and from 207N to 211P in SEGI8). Another obvious difference between the models for SEGI8 and NTEGI was the predicted structure of a flexible linker region and a CBD (blue color in SEGI8).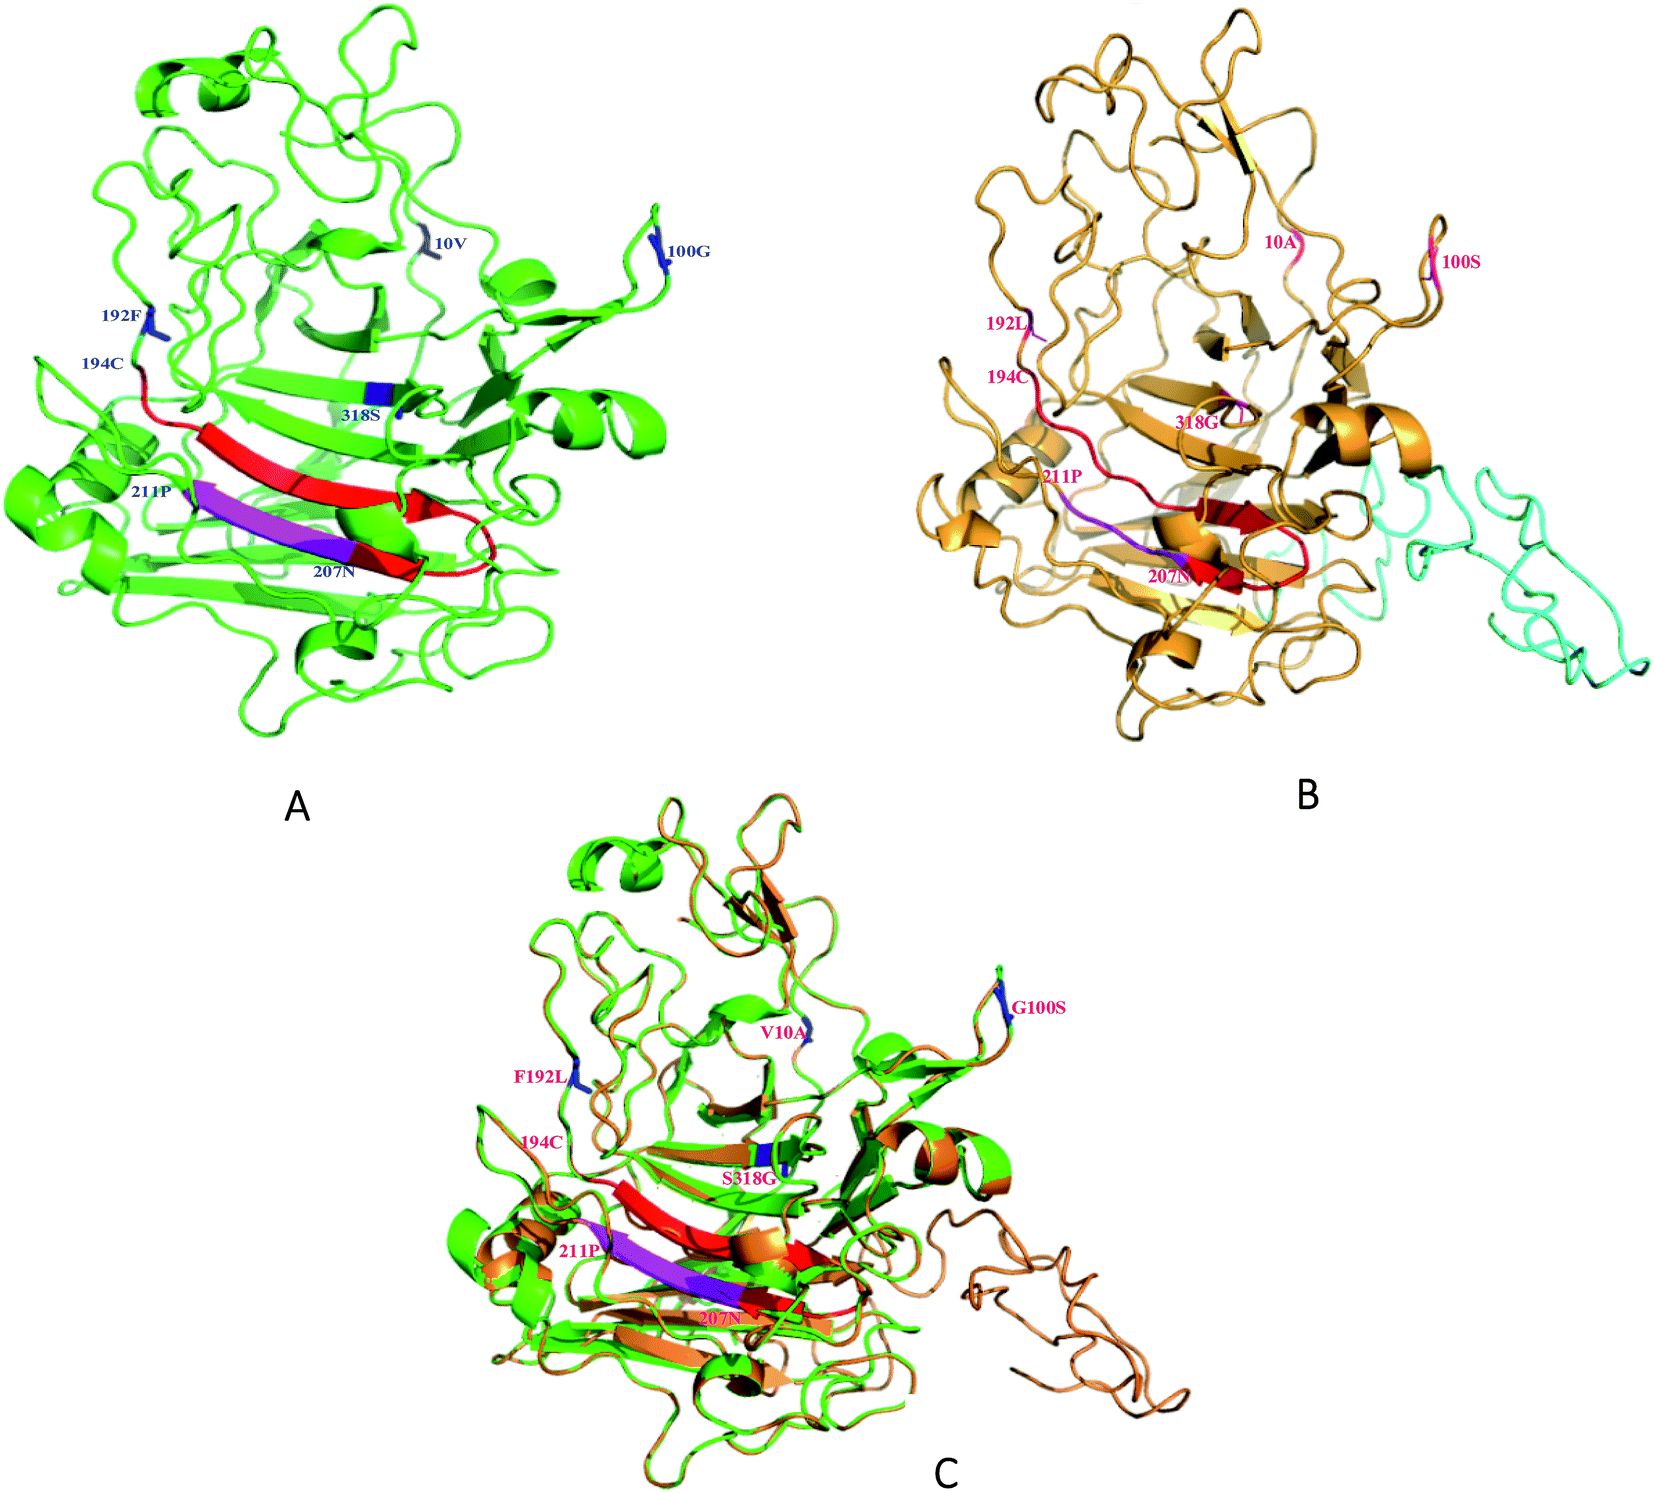 | ||
| Fig. 5 Three-dimensional modelling of EGI in T. reesei and SEGI8. (A) Modeling structure of NTEGI, (B) modeling structure of SEGI8, (C) alignment of two modeling structures. Modeling structure of SEGI8 and NTEGI, highlighted according to different segments of secondary structure. The red part in four point mutations represented carbonyl and hydroxyl. The blue and pink parts represented amidogen and Cα backbone. | ||
4. Discussion
In this study, we succeeded in constructing a secretory expression system for whole EGI protein in S. cerevisiae INVSc1 and directed the evolution of eg1 genes from three wild type Trichoderma spp. by DNA shuffling. One protein variant (SEGI8) was screened out that had approximately 169% to 257% increased enzymatic activity in comparison to the wild types. The locations of four point mutations (V10A, G100S, F192L, and S318G) in SEGI8 were identified through a 3D structural modeling analysis, which found that the β-helix in NTEGI was transformed into a loop region in SEGI8. This novel assay overcame the limitations of other cellulase expression systems and common molecular methods,29,30,46 and it could be widely applied to different cellulases. Therefore, it could serve as a reliable system to degrade cellulose and be utilized in bioenergy production.The new method proposed in this system includes a new and extremely efficient technique for screening cellulases. Although previous studies have demonstrated that fungal endoglucanases are important for the biomass degradation of lignocellulose, display synergistic effects with cellobiohydrolases and β-1,4-glucosidase during enzymatic hydrolysis,47 and that many endoglucanase genes can be expressed in E. coli, the new approach in this study was performed by eukaryotic expression in S. cerevisiae.22,30,48,49 It is known that the EGI CD is joined to the CBD by an extended O-glycosylated interdomain-linker peptide with an abundant serine/threonine-rich hinge.3 But no structure has been determined for an intact multi-domain EGI, which consists of the catalytic core, linker, and CBD.50 Although EGI was expressed in E. coli, the expression product of the inclusion body could not be obtained due to the O-glycosylated interdomain-linker peptide and N-glycosylations in the asymmetric unit. A previous study showed that the EGI CD obtained from T. reesei contained a truncated eg1 gene (residues 1 to 371).51 This was provided to us by E. Margolles-Clark et al. The CBD from T. reesei is necessary to efficiently attach to crystalline cellulose and facilitates the breakdown of the crystalline structure.52 Therefore, segmentation expression and evolving EGI are not conducive to understanding the whole protein function. Our eukaryotic expression in S. cerevisiae provided a feasible method for understanding the function of the whole mature EGI peptide. In addition, we expressed the eg1 gene from three Trichoderma spp. in yeast under the control of the prepro α-factor secretion signal sequence.44,53 This α-factor will be helpful in studying secreted proteins as well as for elucidating the mechanisms involved in producing extracellular expression.54 In practice, it is convenient to directly observe the behavior by means of the EGI enzyme, and in our study, α-factor allowed S. cerevisiae INVSc1 to secrete it extracellularly.
During the process of DNA shuffling, we constructed a large library (about 7 × 10³) because we used the primer PCR reaction products and the yeast expression vector pYEα to directly transform S. cerevisiae (data not shown). In our previous work, we used two other methods to construct the library. One of the methods we used previously is to ligate the PCR products to the pMD-19T vector and transform E. coli. After digestion of the recombinant plasmid, the target fragment was ligated to the pYEα vector in the transformation of yeast. The other method is to ligate PCR products to the pYEα vector and transform E. coli, similar to the process of Plessis et al.30 Although we can obtain many positive transformants by using these two methods, the results appear to indicate that the number of identical transformants and the screening process need more work. Therefore, the new gene was amplified with the colony PCR method from the efficient transformants that were obtained by screening clones. Additionally, this method results in a low repetition rate of the transformants but few libraries, which could improve the successful probability of screening a highly activity enzyme. However, we increased the enzyme activity slightly because we wanted to use one round of DNA shuffling. Subsequently, we focused on optimizing the process of DNA shuffling and using several rounds of DNA shuffling or error-prone PCR to screen for the better mutant.
We demonstrated the improved activity of SEGI8 with CMC/Congo-red plate assays. To understand how the changed amino acid residues in SEGI8 contributed to the improved activity, the structure of a 3D model of SEGI8 was predicted using Phyre 2.0 using S. cerevisiae as the template, because it has a hydrolase showing 95% identity with the NTEGI amino acid sequence.55,56 We found that the change of amino acid Ser318 into Gly closed the active site located on the β-sheet of the sandwich core in the SEGI8 variant. Obviously, the β-sheet in the sandwich core of SEGI8 was shorter than that of NTEGI (Fig. 5C). According to previous research, glycine residues may provide more flexibility than other amino acids, which is necessary for enzyme active sites (such as position 318) to change conformation.57 For the catalytic event, the chain remains trapped inside the active-site tunnel of the endoglucanases. The loops closest to the active site were essential in the EGI structures. As shown in Fig. 5, the 3D modeling of the active-site tunnel in SEGI8 (colored red) was different from that in NTEGI (colored blue), which has been previously analyzed in a study performed by G. J. Kleywegt.55 The change in the loop regions in SEGI8 may enlarge the substrate-binding space. It is possible that S318G affects the substrate binding and contributes to the improved activity of SEGI8. The same change occurred with residues 208A to 212H (colored purple) in SEGI8. This might explain how the amino acid change could extend the capacity for substrate binding to the active center of the sandwich structure, and therefore lead to the 1.99-fold improved activity.55,58 In addition, as indicated by the structure of the SEGI8 model, position Leu192 before the active-site residues from Glu194 to Asn207 in EGI is involved in substrate binding.55 Therefore, the leucine amino acid, which lacks a benzene ring, might change the backbone configuration of the β-sheet in the sandwich core.
SEGI8 displayed the important characteristic of enzymatic stability, because the conformational changes influenced both its thermo- and pH stability. Much work has been done on the mechanism for alkalinity tolerance with the alkaline cellulase produced by bacteria.59 The pH stability of NLEGI and SEGI8 in the 5.6 to 6.6 range was related to the two alterations at 144P and 100S, respectively. Previous reports suggest that the introduction of proline provided stability at physiological pH, and then the serine modified the proline residue.28,60 This was the most effective single substitution to enhance CMCase activity.28 In other research, a mutation-guided approach for improving thermostability was used to engineer variants of endoglucanase I (Cel7B) from four EGIs that are able to hydrolyze cellulosic substrates at temperatures ranging from 50–70 °C, as shown in Fig. 4B. Chokhawala indicated that the B-factors grouped at seven sites [site A (aa 284–287), site B (aa 301–302), site C (aa 113, 115), site D (aa 238), site E (aa 230), site F (aa 323), site G (aa 291)] were chosen for site-saturation mutagenesis, and that it could improve the thermostability of EGI.56 In our study, sites A, C, and D in NLEGI, NPEGI, and SEGI8 were all different from the NTEGI control. This may be one of the reasons for the increased activity. Moreover, the glycosylation of NTEGI enzymes renders them more thermostable, which is consistent with other reports showing the importance of glycosylation in protein thermostability. The cyclization of N-terminal glutamine to a pyroglutamate in S. cerevisiae expressing NTEGI resulted in more thermostability.61,62 The S318G mutation and nearby N321T have a similar structure–activity relationship in SEGI8. Hikaru Nakazawa also indicated that changes in the activity center could increase thermo- and pH stability.28
In summary, we used DNA shuffling to screen for mutants with higher activity, thermo-stability, and pH stability, and found one, SEGI8, that we characterized. The 3D modeling of the O-glycosylated flexible linker region and CBD (residues 372 to 439) were predicted by using PyMOL (Fig. 5). These two regions were shown with strips of loop, which is important for substrate binding.55 Further research is needed to confirm whether the loops in the linker and CBD regions affect the activity of SEGI8.
Furthermore, it should be pointed out that there were two amino acid residues (M91L and F359Y) of SEGI8 different from NTEGI, which were highly conserved across the glycoside hydrolase family 7 as shown by multiple sequence alignment.55 In the future, we will devote to research whether charge of these conserved amino acids in other endoglucanase could result in the improved activities.
5. Conclusion
In summary, a library of mutant endoglucanase EGI from three mixed Trichoderma sp. was constructed using DNA shuffling, and one mutants SEGI8 promoting the enzyme activity was obtained using screening by CMC/Congo-red plate assays among approximately 1000 variants. The variant SEGI8 were found to show 1.99, 2.22 and 1.69 fold improved activities compared to T. reesei, T. pseudokoningii and T. longibrachiatum, respectively. Although improved activities were observed, the SEGI8 variants showed very similar pH and temperature with three wild type strain, which could be a better choice to apply in the same industrial condition. Mutant SEGI8 produced by the clone showed broad pH stability (5.6–6.6), while performed the similar thermotolerance (60−70 °C) compared with three wild-type EGIs. Based on the sequence analysis, it was found that SEGI8 had four point mutants, with the residues Ala10, Ser100, Leu192 and Gly318 respectively substituting the residues Val10, Gly100, Phe192 and Ser318 in NTEGI. Through 3D-structural modelling, the major structure of active site in SEGI8 was loop regions while the same location was β-helix in NTEGI. It was suggested the substitution Ser318 in SEGI8 might directly affect the substrate binding and activity-site, and therefore contribute to their improved activities. In all, we have demonstrated that DNA shuffling can be applied to improve the activities of enzymes from glycoside hydrolase family 7, which should provide available information for engineering of all endoglucanases from this family.Conflicts of interest
The authors declare that the research was conducted in the absence of any commercial or financial relationships that could be construed as a potential conflict of interest.Acknowledgements
This research was financially supported by the Key project of Natural Science Research of Anhui Provincial Education Department (KJ2009A75), Science and Technology Commission of Shanghai Municipality (14DZ1205100, 14320502100), Key Project of Shanghai Agriculture Prosperity through Science and Technology (Grant: 2017, 4-4), the “Dawn” Program of Shanghai Education Commission (15SG48), and Shanghai Engineering Research Center of Aquatic-Product Processing & Preservation. This work was also supported by the program granted by Funding program for outstanding dissertations of Shanghai Ocean University.References
- S. B. Leschine, Annu. Rev. Microbiol., 1995, 49, 399–426 CrossRef CAS PubMed.
- R. Kumar, S. Singh and O. V. Singh, J. Ind. Microbiol. Biotechnol., 2008, 35, 377–391 CrossRef CAS PubMed.
- M. Claeyssens, T. H. Van, P. Tomme, T. M. Wood and S. I. Mcrae, Biochem. J., 1989, 261, 819–825 CrossRef CAS PubMed.
- P. Béguin and J. P. Aubert, FEMS Microbiol. Rev., 1994, 13, 25–58 CrossRef.
- J. R. Cherry and A. L. Fidantsef, Curr. Opin. Biotechnol., 2003, 14, 438–443 CrossRef CAS PubMed.
- E. A. Bayer, H. Chanzy, R. Lamed and Y. Shoham, Curr. Opin. Struct. Biol., 1998, 8, 548–557 CrossRef CAS PubMed.
- M. Anbar, R. Lamed and E. A. Bayer, Chemcatchem, 2010, 2, 997–1003 CrossRef CAS.
- M. Penttilä, P. Lehtovaara, H. Nevalainen, R. Bhikhabhai and J. Knowles, Gene, 1986, 45, 253–263 CrossRef.
- S. J. Horn, G. Vaajekolstad, B. Westereng and V. G. H. Eijsink, Biotechnol. Biofuels, 2012, 5, 89–93 CrossRef PubMed.
- B. Henrissat, Biochem. J., 1991, 293(Pt 3), 781–788 Search PubMed.
- B. Henrissat and A. Bairoch, Biochem. J., 1993, 293(Pt 3), 781–788 CrossRef CAS PubMed.
- J. Kolbe and C. P. Kubicek, Appl. Microbiol. Biotechnol., 1990, 34, 26–30 CrossRef CAS PubMed.
- H. J. Gilbert and G. P. Hazlewood, J. Gen. Microbiol., 1993, 139, 187–194 CrossRef CAS.
- H. Watanabe and G. Tokuda, Cell. Mol. Life Sci., 2001, 58, 1167–1178 CrossRef CAS PubMed.
- H. Watanabe and G. Tokuda, Annu. Rev. Entomol., 2010, 55, 609–632 CrossRef CAS PubMed.
- S. Zhang, Q. Y. Yin, Y. H. Li, M. Ding, G. J. Xu and F. K. Zhao, Appl. Microbiol. Biotechnol., 2007, 75, 1327–1334 CrossRef CAS PubMed.
- H. Watanabe, H. Noda, G. Tokuda and N. Lo, Nature, 1998, 394, 330–331 CrossRef CAS PubMed.
- M. Sugimura, H. Watanabe, N. Lo and H. Saito, Eur. J. Biochem., 2003, 270, 3455–3460 CrossRef CAS PubMed.
- D. Sternberg, Biotechnol. Bioeng., 1976, 18, 1751–1760 CrossRef CAS.
- S. W. Kang, Y. S. Park, J. S. Lee, S. I. Hong and S. W. Kim, Bioresour. Technol., 2004, 91, 153–156 CrossRef CAS PubMed.
- M. J. Bailey, M. Siika-Aho, A. Valkeajarvi and M. E. Penttila, Biotechnol. Appl. Biochem., 1993, 17(Pt 1), 65–76 CAS.
- C. Cummings and T. Fowler, Curr. Genet., 1996, 29, 227–233 CAS.
- F. H. Arnold and G. Georgiou, Curr. Opin. Biotechnol., 2001, 12, 545–551 CrossRef.
- H. Zhao, K. Chockalingam and Z. Chen, Curr. Opin. Biotechnol., 2002, 13, 104–110 CrossRef CAS PubMed.
- J. F. Reidhaarolson and R. T. Sauer, Science, 1988, 241, 53–57 CAS.
- W. P. Stemmer, Nature, 1994, 370, 389–391 CrossRef CAS PubMed.
- Y. An, L. Chen, S. Sun, A. Lv and W. Wu, New Biotechnol., 2011, 28, 320–325 CrossRef CAS PubMed.
- H. Nakazawa, K. Okada, T. Onodera, W. Ogasawara, H. Okada and Y. Morikawa, Appl. Microbiol. Biotechnol., 2009, 83, 649–657 CrossRef CAS PubMed.
- L. Lin, C. Fu and W. Huang, Enzyme Microb. Technol., 2016, 86, 52–58 CrossRef CAS PubMed.
- L. D. Plessis, S. H. Rose and W. H. van Zyl, Appl. Microbiol. Biotechnol., 2010, 86, 1503–1511 CrossRef CAS PubMed.
- J. Sambrook, E. F. Fritsch and T. Maniatis, Molecular Cloning: A Laboratory Manual, Cold Spring Harbor Laboratory, New York, 2012 Search PubMed.
- D. E. G. A. Adams, C. A. Kaiser and T. Stearns, Methods in Yeast Genetics, Cold Spring Harbor Laboratory Press, 1998 Search PubMed.
- J. J. Clare, M. A. Romanes, F. B. Rayment, J. E. Rowedder, M. A. Smith, M. M. Payne, K. Sreekrishna and C. A. Henwood, Gene, 1991, 105, 205–212 CrossRef CAS PubMed.
- W. P. C. Stemmer, Proc. Natl. Acad. Sci. U. S. A., 1994, 91, 10747–10751 CrossRef CAS.
- T. Zhan, K. Zhang, Y. Chen, Y. Lin, G. Wu, L. Zhang, P. Yao, Z. Shao and Z. Liu, PLoS One, 2013, 8, 724e–734e Search PubMed.
- C. Kaiser, S. Michaelis and A. Mitchell, Methods In Yeast Genetics: A Cold Spring Harbor Laboratory Course Manual, Cold Spring Harbor Laboratory Press, 2000 Search PubMed.
- J. Hill, K. A. G. Donald and D. E. Griffiths, Nucleic Acids Res., 1991, 19, 5791 CrossRef CAS PubMed.
- IUPAC, Pure Appl. Chem., 1987, 59, 257–268 Search PubMed.
- X. H. Li, H. J. Yang, B. Roy, E. Y. Park, L. J. Jiang, W. Dan and Y. G. Miao, Microbiol. Res., 2010, 165, 190–198 CrossRef CAS PubMed.
- L. A. Kelley, S. Mezulis, C. M. Yates, M. N. Wass and M. J. Sternberg, Nat. Protoc., 2015, 10, 845–858 CrossRef CAS PubMed.
- J. D. Thompson, T. J. Gibson and D. G. Higgins, Current Protocols in Bioinformatics, Wiley, USA, 2002, ch. 2, pp. 2.3.1–2.3.22 Search PubMed.
- W. L. Delano, The PyMOL Molecular Graphics System (v. 1.5.0.1), Schrödinger LLC, New York, USA, 2013 Search PubMed.
- M. A. Larkin, G. Blackshields, N. P. Brown, R. Chenna, P. A. McGettigan, H. McWilliam, F. Valentin, I. M. Wallace, A. Wilm, R. Lopez, J. D. Thompson, T. J.Gibson and D. G. Higgins, Bioinformatics, 2007, 23, 2947–2948 CrossRef CAS PubMed.
- X. Wang, J. Fan, S. W. Zhu, B. J. Cheng and F. Tao, Acta Laser Biol. Sin., 2012, 21, 245–251 CAS.
- G. Banerjee, S. Car, J. S. Scott-Craig, M. S. Borrusch, N. Aslam and J. D. Walton, Biotechnol. Bioeng., 2010, 106, 707–720 CrossRef CAS PubMed.
- C. Liang, M. Fioroni, F. Rodríguez-Ropero, Y. Xue, U. Schwaneberg and Y. Ma, J. Biotechnol., 2011, 154, 46–53 CrossRef CAS PubMed.
- M. H. Momeni, C. M. Payne, H. Hansson, N. E. Mikkelsen, J. Svedberg, Å. Engström, M. Sandgren, G. T. Beckham and J. Ståhlberg, J. Biol. Chem., 2013, 288, 5861–5872 CrossRef CAS PubMed.
- I. Kwon, K. Ekino, M. Goto and K. Furukawa, Biosci., Biotechnol., Biochem., 2014, 63, 1714–1720 CrossRef PubMed.
- B. Tang, H. Pan, Q. Zhang and L. Ding, Bioresour. Technol., 2009, 100, 6129–6132 CrossRef CAS PubMed.
- P. J. Kraulis, G. M. Clore, M. Nilges, T. A. Jones, G. Pettersson, J. Knowles and A. M. Gronenborn, Biochemistry, 1989, 28, 7241–7257 CrossRef CAS PubMed.
- C. Divne, I. Sinning, J. Ståhlberg, G. Pettersson, M. Bailey, M. Siika-Aho, E. Margolles-Clark, T. Teeri and T. A. Jones, J. Mol. Biol., 1993, 234, 905–907 CrossRef CAS PubMed.
- T. T. Teeri, T. Reinikainen, L. Ruohonen, T. A. Jones and J. K. C. Knowles, J. Biotechnol., 1992, 24, 169–176 CrossRef CAS.
- F. Tao, X. Wang, H. Y. Jiang, J. Fan, S. W. Zhu and B. J. Cheng, Acta Laser Biol. Sin., 2011, 20, 809–814 CAS.
- W. Duntze, V. Mackay and T. R. Manney, Science, 1970, 168, 1472–1473 CAS.
- G. J. Kleywegt, J. Y. Zou, C. Divne, G. J. Davies, I. Sinning, J. Ståhlberg, T. Reinikainen, M. Srisodsuk, T. T. Teeri and T. A. Jones, J. Mol. Biol., 1997, 272, 383–397 CrossRef CAS PubMed.
- H. A. Chokhawala, C. M. Roche, T. W. Kim, M. E. Atreya, N. Vegesna, C. M. Dana, H. W. Blanch and D. S. Clark, BMC Biotechnol., 2015, 15, 1–12 CrossRef PubMed.
- B. X. Yan and Y. Q. Sun, J. Biol. Chem., 1997, 272, 3190–3194 CrossRef CAS PubMed.
- J. L. Rahikainen, J. D. Evans, S. Mikander, A. Kalliola, T. Puranen, T. Tamminen, K. Marjamaa and K. Kruus, Enzyme Microb. Technol., 2013, 53, 315–321 CrossRef CAS PubMed.
- A. Nakamura, F. Fukumori, S. Horinouchi, H. Masaki, T. Kudo, T. Uozumi, K. Horikoshi and T. Beppu, J. Biol. Chem., 1991, 266, 1579–1583 CAS.
- B. W. Matthews, H. Nicholson and W. J. Becktel, Proc. Natl. Acad. Sci. U. S. A., 1987, 84, 6663–6667 CrossRef CAS.
- B. Imperiali and S. E. O'Connor, Curr. Opin. Chem. Biol., 1999, 3, 643 CrossRef CAS PubMed.
- G. T. Beckham, Z. Dai, J. F. Matthews, M. Momany, C. M. Payne, W. S. Adney, S. E. Baker and M. E. Himmle, Curr. Opin. Biotechnol., 2012, 23, 338–345 CrossRef CAS PubMed.
| This journal is © The Royal Society of Chemistry 2017 |