 Open Access Article
Synthesis and application of a new class of D–π–A type charge transfer probe containing imidazole – naphthalene units for detection of F− and CO2†
Ramesh C. Gupta,
Rashid Ali,
Syed S. Razi,
Priyanka Srivastava,
Sushil K. Dwivedi and
Arvind Misra *
*
Department of Chemistry, Institute of Science, Banaras Hindu University, Varanasi-221 005, UP, India. E-mail: arvindmisra2003@yahoo.com; amisra@bhu.ac.in
First published on 17th January 2017
Abstract
A new class of D–π–A type charge transfer probe, 3 and 4, containing imidazole – naphthalene moieties as donor and acceptor, respectively, has been synthesized via a Suzuki coupling reaction. Probe 3, upon interaction with different classes of anions, showed high selectivity toward fluoride with a detection sensitivity of 4 ppb (0.22 μM). The in situ generated imidazolyl ion (3 + F−) enables the detection of CO2 with the restoration of the original absorption and emission properties of 3. The mode of interaction has been confirmed by 1H NMR and DFT studies which suggested the deprotonation of the –NH fragment of the imidazolyl unit in the presence of F−.
1. Introduction
In recent years the scientific community has shown much interest in developing specific molecular organic scaffolds for the selective recognition of anions that have serious unfavorable effects on organisms.1 In the family of different classes of anions the F− anion has gained much importance in dental care, treatment of osteoporosis, and treatment of drinking water. Also fluoride has been used as in anesthetics, hypnotic and psychiatric drugs, military nerve gases and in the refinement of uranium.2–6 The Environmental Protection Agency (EPA, USA) has set a standard of 2–4 ppm to protect individuals against several disorders.7 Over-exposure to fluoride may cause serious health problems such as, fluorosis, neurological and metabolic disorders8–12 and even cancer like osteosarcoma.13 Therefore, it is highly important to develop selective, sensitive, fast, and cost-effective detection methods for fluoride anions.The selective recognition of specific anion is challenging because of their lower charge to radius ratio, microenvironment sensitivity (solvent effect), pH sensitivity, as well as their existence in a wide range of different geometries.14 Particularly, fluoride has smallest ionic radius, highest charge density, and has hard Lewis base nature.14 The conventional analytical methods for F− typically involve the use of ion chromatography,15 ion-selective electrodes,16,17 and capillary zone electrophoresis.18 Moreover, among widely used sensing techniques for the detection of anions optical based methods such as application of chemosensors (chromo or fluorogenic) has recently emerged as the most convenient technique due to high selectivity, sensitivity and naked eye visibility, low detection limit and suitability for detection at the intracellular and tissue-specific level.19
Recently great efforts have been made to develop suitable molecular scaffolds to detect fluoride based on different photophysical processes.20 However, molecular scaffolds based on intramolecular charge transfer (ICT) and ratiometric fluorescence responses are in great demand. Ratiometric systems have advantages because it allows simultaneous response at two wavelengths. Thus, to make non-covalent recognition event thermodynamically feasible and convenient to the naked-eyes for a target anion there is a great need to develop a specific molecular scaffold based on binding site signaling approach by incorporating a suitable chromophore and a neutral anion receptor unit such as –NH fragment.21 This is also because both fluoride and carboxylate anions easily interact with –NH fragment through a strong hydrogen-bond interaction in an aprotic medium. Moreover, the presence of hetero atoms in synthetic polycyclic aromatic hydrocarbons of high planarity enable better electron delocalization and generates good photophysical properties, such as, intense fluorescence due to high charge mobility.22–27 Thus, the typical structural and electronic changes encountered upon anion–receptor interaction by directional hydrogen bonding and/or by donation of one or more hydrogens of NH fragment to the anion are easy to follow by spectroscopic techniques.28
Additionally, among the gases CO2 is an important greenhouse gas which is a major factor for global climate change as well as has vital role in human physiology and diagnostic applications in medical science.29–37 Thus, the sensitive detection of CO2 has great significance. Recently it has been found that anionic amine, carbene and anionic amide are suitable substrate to demonstrate unique anion-activated CO2 sensing through a simple colorimetric and fluorescent change.38–40
In view of above facts and in continuation to our previous efforts in the area of molecular recognition41 we herein report a new class of organic scaffold for selective detection of fluoride and CO2 in DMSO. In our previous contribution we have developed some D–π–A type organic scaffolds in which the phenyl substituted imidazolyl and benzothiazole moieties are linked with a phenyl and/or thiophene unit and realized their application in the detection of anions, cations and CO2. In fact, planar polycyclic aromatic hydrocarbons facilitate better photophysical properties due to extended conjugation, high extent charge mobility and their mutual arrangement with in the molecule.42 Further, to develop a more selective and sensitive probe for a target anion, we consciously extended π-conjugation by conjugating phenyl substituted imidazolyl and naphthalene moieties through a phenyl bridge. The newly synthesized D–π–A type molecular probe, 3 showed good optical behavior based on intramolecular charge transfer (ICT) process in which, imidazolyl and naphthalene units worked as donor and acceptor, respectively. As expected, upon interaction with different class of anions in DMSO the –NH fragment of imidazole unit of probe 3 interacted with F− selectively through H-bonding interaction followed by deprotonation and exhibited naked-eye sensitive colorimetric changes and fluorescence “turn-on” response ratiometrically, due to charge transfer/propagation between donor and acceptor moieties by push–pull mechanism. Moreover, the anionic fluoroionophore moiety, 3 + F− has been successfully utilized to detect and estimate CO2 with high sensitivity and unique chromo and fluorogenic responses.
2. Results and discussion
2.1 Synthesis and photophysical behavior of probe 3
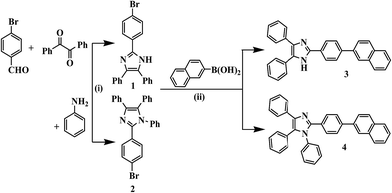
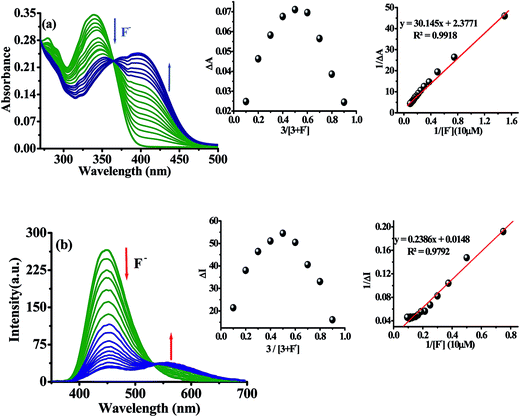
The synthesis of probe 3 and the model compound 4 were synthesized as shown in Scheme 1. The imidazole derivative 1 and 2 was obtained in good yield by one pot multi-component reaction process.43 Compound 1 was synthesized by reacting p-bromobenzaldehyde, benzil and NH4OAc in glacial acetic acid while for 2, aniline was refluxed along with p-bromobenzaldehyde, benzil and NH4OAc in glacial acetic acid. Now compound 1 and 2 were reacted with naphthalene-2-boronic acid using Suzuki coupling reaction protocol44 to get desired products 3 and 4 in quantitative yield. The compounds were characterized by 1H NMR, 13C NMR, IR and TOF-MS spectroscopy data (Fig. S1–S12, ESI†).Further, the binding affinity of 3 toward F− has been realized through the absorption and emission titration experiments (Fig. 3). Upon a gradual addition of F− (0–40 equiv.) to a solution of 3 the absorption spectra displayed ratiometric behavior in which band centered, at 340 nm decreased while the absorption of a new band at 390 nm enhanced concomitantly (Fig. 3a). Similarly, the emission titration studies displayed ratiometric behavior in which fluorescence intensity of 3 (at, λex = 340 nm), centered at 448 nm diminished gradually and two new emission bands appeared at 453 nm and 565 nm (Fig. 3b). The appearance of isosbestic and isoemissive points at 365 and 532 nm, respectively clearly supported about the existence of more than one species in the medium. The observed significant red shift in the photophysical behavior of 3 upon interaction with F− is attributed to enhance intramolecular charge transfer encounter due to deprotonation of –NH fragment.45–48 The reaction stoichiometry between 3 and F− has been realized by obtaining the absorption and emission spectra as a function of F− concentration. The maxima at 0.5 mole fractions suggested about a 1![[thin space (1/6-em)]](https://www.rsc.org/images/entities/char_2009.gif) :
:![[thin space (1/6-em)]](https://www.rsc.org/images/entities/char_2009.gif) 1 stoichiometry for a probe-fluoride interaction. For which, the binding constant has been estimated through Benesi–Hildebrand (B–H) method49 and were found to be Kass(abs) = 7.90 × 10³ M and Kass(em) = 6.2 × 10³ M respectively (inset of Fig. 3a and b).
1 stoichiometry for a probe-fluoride interaction. For which, the binding constant has been estimated through Benesi–Hildebrand (B–H) method49 and were found to be Kass(abs) = 7.90 × 10³ M and Kass(em) = 6.2 × 10³ M respectively (inset of Fig. 3a and b).
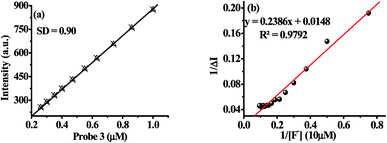
The limit of detection (LOD) of probe 3 for F− has been estimated as reported previously.50 An approximately straight line calibration curve, obtained by taking the emission spectra of 3 at different concentration (1.0 to 0.1 μM) suggested about a linear correlation between intensity and concentrations of the probe with standard deviation 0.90 (Fig. 4a). Further, from the slope of the fluorescence curve, obtained between ΔI(I − I0) (where I0 and I illustrate the emission intensities of 3 in the presence and absence of F−) and concentration of the anions in the aforementioned range, the calibration sensitivity (m) was estimated and was found to be 12.099 (Fig. 4b). Now employing eqn (3) the limit of detection (LOD) for F− was calculated and was found to be 0.22 μM which is well below the recommended level and comparable to other reported methods.51
2.2 pH study of probe 3 in HEPES buffer
The photophysical behavior displayed by 3 in the presence of F− suggested about the deprotonation of –NH fragment of imidazolyl unit45–48 consequently, the observed ratiometric enhanced emission is attributed to polarization and/or charge propagation of an increase electron density on the imidazolyl unit. Moreover, the moderately weak acidic –NH function of imidazole unit is susceptible to protonation and deprotonation under acidic and alkaline pH. Therefore, to rationalize the effect of F−, pH dependent photophysical behavior of 3 was investigated in HEPES buffer (10 mM, pH 7.04; 40% aqueous DMSO).The absorption spectrum of 3 (10 μM) showed electronic transition bands at 340 nm (ε = 3.35 × 10⁴ M−1 cm−1) (Fig. 5a). Similarly, upon excitation at 340 nm probe 3 showed intramolecular charge transfer emission band at 448 nm (Fig. 5b). Notably, under acidic (pH 7 to 6) conditions the molar absorptivity of 3 increased and new band appeared at 326 nm (ε = 3.50 × 10⁴ M−1 cm−1; blue-shift, ∼14 nm) and remain constant at pH 6 to 1 wherein alkaline (pH 10 to 14), the band centered, at 340 nm disappeared and a new transition band appeared at 370 nm (ε = 2.79 × 10⁴ M−1 cm−1; red-shift, ∼30 nm) (Fig. 5a). The formation of isosbestic points at 334 and 352 nm in acidic and alkaline medium, respectively suggested about the existence of more than one species in the medium. Similarly, under acidic pH (7–6) the emission intensity of 3 centered at 445 nm (λex = 340 nm) increased with a blue shift of ∼27 nm while under alkaline (>11) condition dual emission band appeared at 440 nm (blue shift ∼5 nm) and 545 nm (red shift ∼100 nm) (Fig. 5b) and the color of solution become yellowish orange. Thus, acid–alkali titration studies clearly supported about the protonation–deprotonation of the probe in the medium.
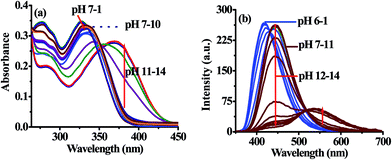 | ||
| Fig. 5 Change in absorption (a) and emission (b) spectra of 3 (10 μM) at different pH in HEPES buffer. | ||
2.3 Nature of interaction between 3 and F−
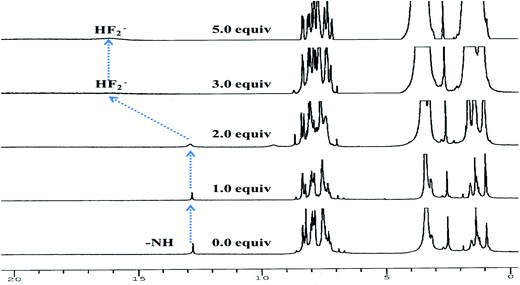
To get a deep insight about actual mechanism of interaction between 3 and F− the 1H NMR studies have been performed DMSO-d6. 1H NMR spectrum of 3 (2.0 × 10⁻² M) (Fig. 6) showed aromatic protons resonance in the range at δ 8.35–7.25 ppm. The imidazolyl –NH resonance appeared at δ 12.78(s) ppm due to hydrogen bonding interaction with solvent DMSO-d6. Upon addition of F− (0–2.0 equiv.) to a solution of 3 the –NH resonances broadened. Further addition of 3.0 to 5.0 equiv. of F− the –NH resonances disappeared completely and the resonances of phenyl ring proton shifted up field. A broad band appeared at δ 16.05 ppm suggested about the formation of HF2− species35–37 in the medium. Thus, the proton NMR studies clearly favored about the H-bonding interaction between –NH fragment of 3 and F− followed by deprotonation. Consequently, the ICT increased due to charge propagation from imidazole to naphthalene unit.2.4 DFT calculation
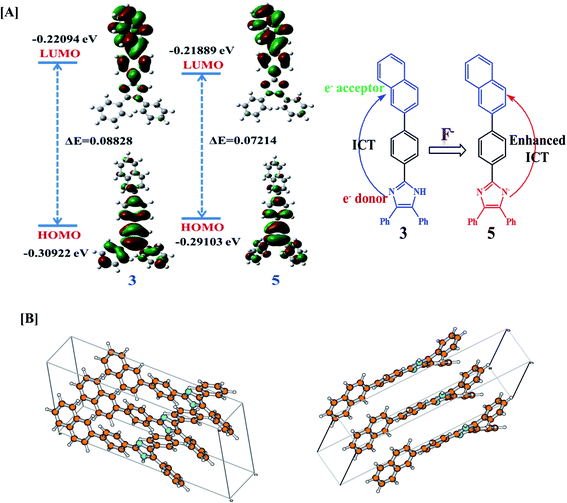
The geometry optimization and quantum chemical calculations for 3 and the corresponding deprotonated product, 5 were performed by density functional theory (DFT) method as implemented in Gaussian 03 suits of program51 employing basis set B3LYP/6-31G*. As shown in (Fig. 7), the relevant occupied molecular orbital, HOMO (−0.30922 eV) is delocalized to the entire unit probe 3, in which the electron density is spread over the imidazole-phenyl bridge-naphthalene unit while unoccupied molecular orbital LUMO (−0.22094 eV) are distributed more towards naphthalene–phenyl unit. Similarly, for 5 the HOMO (−0.29103 eV) is located to the entire unit while LUMO (−0.21889 eV) is more localized to naphthalene-phenyl bridge. Thus, the molecular orbital approximation favors about the intramolecular charge transfer (ICT) from imidazole to naphthalene unit. The deprotonation of imidazolyl –NH led to a further polarization in electron density from the imidazole to naphthalene unit. Furthermore, the energy gap between the HOMO and LUMO of 5 (ΔE = 0.07214 eV) was found less than that of probe 3 (ΔE = 0.08828 eV) and in good agreement with the red shift observed in the absorption spectra upon treatment with F−. Thus both the theoretical and experimental observations corroborated the possible mode of interaction between 3 and fluoride anion.Further, in DMSO the basic nature of anions follow the order F− > CN− > AcO− > H2PO4− > BzO− > Cl− > HSO4− > SCN− > NO3− > Br− > I− which is in general agreement with the Hofmeister series and reported methods.52 Fluoride is the most basic anion, and the following one is the cyanide. The different emission behavior of probe toward tested anions in solid and solution is possible and are known. The molecules in the solid state hardly move at all reactions are also very slow because molecules can't easily come into contact with each other. If two solids are mixed, molecules on the surface of the solid grains may react, but the molecules buried inside will be left untouched. In the solid state the stoichiometric ratio between the probe and tested anions are not maintained this could be a reason to get exceptionally variable enhancement in the intensities despite of the basicity order of the tested anions but enhancement in emission toward high wavelength was observed with anions such as CN−, AcO− and F− that could be understood considering the formation of aligned dimeric aggregate or excimer formation due to better aligned packing arrangement and/or lattice fit between the deprotonated and neutral molecules due to π–π and H-bonding interactions. Although we failed to obtain crystal of the molecule and its probable complex but minimum energy structure obtained through DFT method suggested about the planarity and dimeric alignment of the molecule (Fig. 7B).
In recent years we and others have demonstrated modulations in photophysical behavior of anion-responsive probes induced by fluoride in organic solvents, which usually originate either due to hydrogen-bonded complex formation (in early transition stage) and deprotonation (later stage) steps.46–48,53 To explain the fluorescence quenching of ICT emission of the probe in solution size, basicity and solvation factor of the concerned anions are decisive. In solution intensity of probe drastically decreases at 448 nm with F− only, upon using around 50–60 equiv. of all the tested anions. However when we increased the concentration of anions probe also showed some affinity with CN− and AcO− anions also probably due to hydrogen bonding interaction. But change in optical behavior was more pronounced with F− obviously due to smaller size and high basicity that ultimately leads to deprotonation of the probe. Consequently, the diminished emission observed at 448 nm is clearly due to enhanced ICT process. On other side with a rise in electron density on the naphthalene moiety, due to charge propagation, would certainly increase the probability of π–π interaction along with enhanced H-bonding interactions between the deprotonated and neutral species. Thus, the possibility of unstructured excimer emission or emission due to aggregate formation can be understood and should be rationalized and justify to emission observed at 565 nm which showed more red shift than the enhanced emission observed in solid state at ∼502–521 nm. The low intensity of excimer emission observed at 565 nm may considered by accounting the intermolecular H-bonding with DMSO solvent. Moreover in solution the low intensity of emission observed at 565 nm is obviously is due to the intermolecular H-bonding interaction with the solvent.
2.5 Detection of F− on cellulose paper strips
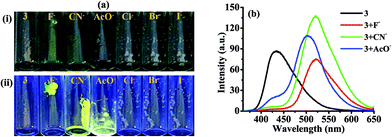
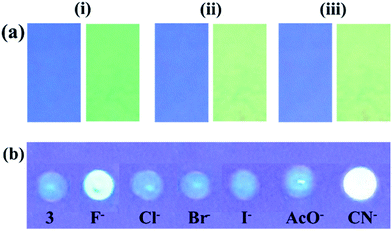
In order to make sure the potential applicability of probe 3 to detect fluoride anion on test paper strips, small cellulose paper strips (Whatman™) containing different concentration of 3 (5, 2 and 1 mM) were prepared (1.5 × 2.0 cm2) in acetone. The dried test paper strips were dipped in different concentration solutions of F− (10 × 10−5, 5 × 10⁻⁵, and 1 × 10⁻⁵ M; of TBAF in ACN) for 5 min and then the air dried strips were visualised under UV light (at 365 nm). The visibility of color on the strip was good up to 1 mM level in which color of paper strips were changed from blue to green (under UV light at 365 nm) (Fig. 8a). The paper strip could able to detect F− up to 10−6 M concentration. The paper strips of 0.1 and 0.01 mM concentration of probe could also able to detect F− but the visibility of color on the strip was much better for 1.0 mM. Similarly, the probe 3 was adsorbed on TLC plate and treated with the tested anions (Fig. 8b), the immediate naked-eye sensitive fluorescent color change from blue to green with F− and yellow with CN− under UV light (at 365 nm) and unchanged with other anions suggested the applicability of probe to sense anion on a solid surface (Fig. 8b).2.6 Anion induced CO2 sensing
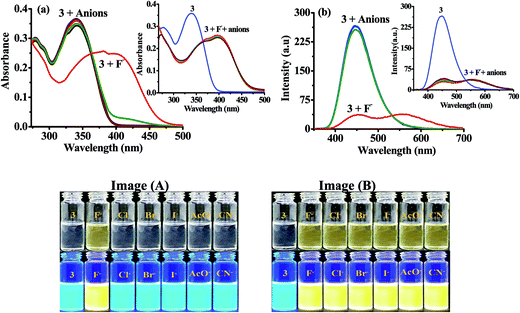
The probe 3 contains an active –NH unit which can be utilized to detect CO2 by a chemical-based optical method. This is because the deprotonation of acidic –NH function of chromophore by a suitable anion like, F− generates negatively charged nitrogen, which may act as an efficient nucleophile to react with CO2. Therefore, to understand the potential applicability of probe 3 for anion induced CO2 sensing an attempt has been made and the change in typical photophysical behavior have been examined through the absorption and emission spectroscopy (Fig. 9). First, the solution of probe 3 in DMSO was treated with TBAF to generate in situ an anion induced anionic probe, 3 + F−. Then, the volume of CO2 was increased to a solution of 3 + F−. It is interesting to mention that upon passing the CO2 to a solution of 3 + F− significant naked-eye sensitive color change were observed in which the original color of probe revived and, the typical absorption band for 3 + F− centered, at 390 nm diminished with the revival of original absorption band of 3 at 340 nm along with formation of an isosbestic point at 365 nm (Fig. 9). Moreover, the observed emission intensity of 3 + F− at 453 nm and 556 nm (at λex = 340 nm) upon increasing the volume of CO2 gas showed a gradual revival in emission intensity of 3 at 448 nm (Fig. 9) along with unique naked-eye sensitive colorimetric responses. The color of probe 3 changed from colorless to brown by F− revived to original color while under UV light the yellow color of 3 + F− upon exposure with CO2 regenerated actual intense blue-green color of 3 (Fig. 9 images). Moreover, fluorescence titration data have been acquired to estimate the detection limit of 3 + F− for CO2 and was found to be 0.36 μM (∼16 ppb) (Fig. S18†). The significant colorimetric response displayed by 3 in the presence and absence of fluoride anion and carbon dioxide may be attributed to the formation of imidazolium hydrogen carbonate salt, generated from N–CO2 adduct formed by the initial attack of negatively charged imidazolium ion to CO2.29,53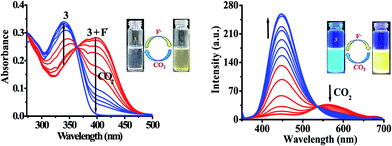 | ||
| Fig. 9 Change in absorption and emission spectra of 3 + F− upon interaction with CO2 in DMSO. Images: change in color of 3 with F− and CO2. | ||
3. Conclusion
In summary, probe 3 is found to detect trace amounts of F− anion in the solution and solid states with colorimetric and fluorometric responses due to variation in ICT process. Moreover, probe 3 has been utilized to detect CO2 by a chemical-based optical method. The in situ generated anionic species, 3 + F− displayed unique colorimetric response along with revival in the typical photophysical properties of probe 3. Moreover, a remarkable solid state reaction resulting in an instantaneous change in color when 3 is brought in contact with crystals of TBAF, TBACN and TBOAc while it remained silent toward other tested (Cl−, Br− and I−) anions. Thus, the presence of the –NH group in the molecule is undoubtedly the centre of recognition of the anion as evident by the absence of sensing by the model compound, 4. The 1H NMR studies unequivocally supported about the deprotonation of moderately acidic imidazolyl –NH fragment in the presence of F− anion and confirmed the observed changes in the photophysical behavior of probe.4. Experimental section
4.1 Materials and chemicals
All the reagents and solvents were purchased from Sigma-Aldrich Chemical Co. Pvt. Ltd. stored in a desiccator under vacuum containing self indicating silica, and used without any further purification. Solvents were purified prior to use. UV-vis absorption spectra were recorded on a Perkin Elmer Lambda-35 UV-vis spectrophotometer using a quartz cuvette (path length = 1 cm). Infrared (IR) spectra were recorded in potassium bromide (KBr) on Varian-3100 FT-IR spectrometer. 1H NMR spectra (chemical shifts in δ ppm) were recorded on a JEOL AL 300 FT-NMR (300 MHz) spectrometer, using tetramethylsilane (TMS) as internal standard. Fluorescence spectra were recorded on Varian eclipse Carry spectrofluorometer using a quartz cuvette (path length = 1 cm) at 400 PMT voltage and slit width 5 nm/5 nm. All the spectroscopic experiments were carried out at room temperature. The stock solution of 3 (1 × 10⁻³ M) were prepared in DMSO and diluted to obtain 10 μM in DMSO for the absorption and fluorescence measurements, respectively. The stock solutions of different anions (1 × 10⁻¹ M) were prepared by dissolving their tetrabutylammonium salt in DMSO. The anion interaction studies were performed by the addition of 1 × 10⁻¹ M of different anions.4.2 Estimation of quantum yields
The quantum yields of probe 3 and 3 − F− were estimated with respect to the quinine sulfate (Φ = 0.54) as standard in 0.1 M H2SO4 solution by secondary methods, using eqn (1).| Q = QR × I/IR × ODR/OD × n2/nR2 | (1) |
4.3 Estimation of binding constant
The absorption and fluorescence experimental data were utilized to calculate association constants by Benesi–Hildebrand method (B–H method) employing eqn (2) for 1![[thin space (1/6-em)]](https://www.rsc.org/images/entities/char_2009.gif) :
:![[thin space (1/6-em)]](https://www.rsc.org/images/entities/char_2009.gif) 1 stoichiometries.
1 stoichiometries.| 1/(I − I0) = 1/(I − If) + 1/K(I − If)[M] | (2) |
4.4 Estimation of limit of detection
The limit of detection (LOD) of 3 for F− was estimated by eqn (3).| LOD = 3σ/m | (3) |
4.5 Synthesis
![[thin space (1/6-em)]](https://www.rsc.org/images/entities/char_2009.gif) :
:![[thin space (1/6-em)]](https://www.rsc.org/images/entities/char_2009.gif) Hexane (0.5
Hexane (0.5![[thin space (1/6-em)]](https://www.rsc.org/images/entities/char_2009.gif) :
:![[thin space (1/6-em)]](https://www.rsc.org/images/entities/char_2009.gif) 9.5, v/v) as eluent to afford desired products.
9.5, v/v) as eluent to afford desired products.Acknowledgements
The authors are thankful to the Council of Scientific and Industrial Research (CSIR), New Delhi for financial support (CSIR) 02(0199/14/EMR-II). The authors are also thankful to the Department of Science and Technology (under DST-FIST program), New Delhi for financial support to develop basic infrastructure facilities in our Department.References
- S. Y. Kim, J. Park, M. Koh, S. B. Park and J. Hong, Chem. Commun., 2009, 4735–4737 RSC.
- P. D. Beer and P. A. Gale, Angew. Chem., Int. Ed., 2001, 40, 486–516 CrossRef CAS PubMed.
- P. G. Kostyuk, O. A. Krishtal and V. I. Pidoplichko, Nature, 1975, 257, 691–693 CrossRef CAS PubMed.
- S. Kubik, Chem. Soc. Rev., 2009, 38, 585–605 RSC.
- D. Langmuir, Geochim. Cosmochim. Acta, 1978, 42, 547–569 CrossRef CAS.
- F. P. Schmidtchen and M. Berger, Chem. Rev., 1997, 97, 1609–1646 CrossRef CAS PubMed.
- Y. Jiang, X. Hu, J. Hu, H. Liu, H. Zhong and S. Liu, Macromolecules, 2011, 44, 8780–8790 CrossRef CAS.
- E. Gazzano, L. Bergandi, C. Riganti, E. Aldieri, S. Doublier, C. Costamagna, A. Bosia and D. Ghigo, Curr. Med. Chem., 2010, 17, 2431–2441 CrossRef CAS PubMed.
- M. C. Friesen, G. Benke, A. D. Monaco, M. Dennekamp, L. Fritschi, N. D. Klerk, J. L. Hoving, E. MacFarlane and M. R. Sim, Canc. Causes Contr., 2009, 20, 905–916 CrossRef PubMed.
- P. Grandjean and P. J. Landrigan, Lancet, 2006, 368, 2167–2178 CrossRef CAS.
- O. Barbier, L. Arreola-Mendoza and L. M. Del Razo, Chem.–Biol. Interact., 2010, 188, 319–333 CrossRef CAS PubMed.
- R. Sandhu, H. Lal, Z. S. Kundu and S. B. Kharb, Biol. Trace Elem. Res., 2011, 144, 1–5 CrossRef CAS PubMed.
- E. B. Bassin, D. Wypij and R. B. Davis, Canc. Causes Contr., 2006, 17, 421–428 CrossRef PubMed.
- Y. Zhou, J. F. Zhang and J. Yoon, Chem. Rev., 2014, 114, 5511–5571 CrossRef CAS PubMed.
- A. N. Katruzov, T. G. Nikitina and L. N. Moskvin, J. Anal. Chem., 1998, 53, 173–177 Search PubMed.
- M. S. Frant and J. W. Ross, Science, 1966, 154, 1553 CAS.
- H. Hara and C. C. Huang, Anal. Chim. Acta, 1997, 338, 141–147 CrossRef CAS.
- R. Bodor, V. Madajova, M. Masar, M. Johnck, B. Stanislawski and D. Kaniansky, J. Chromatogr. A, 2001, 916, 155–165 CrossRef CAS PubMed.
- (a) M. Wenzel, J. R. Hiscock and P. A. Gale, Chem. Soc. Rev., 2012, 41, 480–520 RSC; (b) X. Li, X. Gao, W. Shi and H. Ma, Chem. Rev., 2014, 114, 590–659 CrossRef CAS PubMed; (c) Y. Yang, Q. Zhao, W. Feng and F. Li, Chem. Rev., 2013, 113, 192–270 CrossRef CAS PubMed; (d) S. K. Kim and J. L. Sessler, Chem. Soc. Rev., 2010, 39, 3784–3809 RSC; (e) J. L. Sessler, A. Andrievsky and J. W. Genge, Advances in Supramolecular Chemistry, ed. G.W. Gokel, 1997, vol. 4, pp. 97–142 Search PubMed.
- (a) C. R. Maldonado, A. Touceda-Varela, A. C. Jonesa and J. C. Mareque-Rivas, Chem. Commun., 2011, 47, 11700–11702 RSC; (b) H. J. Kim, H. Lee, J. H. Lee, D. H. Choi, J. H. Jung and J. S. Kim, Chem. Commun., 2011, 47, 10918–10920 RSC; (c) J. J. Lee, G. J. Park, Y. W. Choi, G. R. You, Y. S. Kim, S. Y. Lee and C. Kim, Sens. Actuators, B, 2015, 207, 123–132 CrossRef CAS; (d) S. S. Razi, R. Ali, P. Srivastava, M. Shahid and A. Misra, RSC Adv., 2014, 4, 22308–22317 RSC.
- (a) A. Aydogan, D. J. Coady, V. M. Lynch, A. Akar, M. Marquez, C. W. Bielawski and J. L. Sessler, Chem. Commun., 2008, 1455–1457 RSC; (b) C. Bhaumik, D. Saha, S. Das and S. Baitalik, Inorg. Chem., 2011, 50, 12586–125600 CrossRef CAS PubMed; (c) D. Maity, S. Das, S. Mardanya and S. Baitalik, Inorg. Chem., 2013, 52, 6820–6838 CrossRef CAS PubMed; (d) N. Kumari, S. Jha and S. Bhattacharya, J. Org. Chem., 2011, 76, 8215–8222 CrossRef CAS PubMed; (e) M. Cametti and K. Rissanen, Chem. Commun., 2009, 2809–2829 RSC.
- M. Cametti and K. Rissanenb, Chem. Soc. Rev., 2013, 42, 2016–2038 RSC.
- A. P. de Silva, H. Q. N. Gunaratne, T. Gunnlaugsson, A. J. M. Huxley, C. P. McCoy, J. D. Rademacher and T. E. Rice, Chem. Rev., 1997, 97, 1515–1566 CrossRef CAS PubMed.
- J. L. Sessler, S. Camiolo and P. A. Gale, Coord. Chem. Rev., 2003, 240, 17–55 CrossRef CAS.
- K. Choi and A. D. Hamilton, Coord. Chem. Rev., 2003, 240, 101–110 CrossRef CAS.
- K. M. K. Swamy, Y. J. Lee, H. N. Lee, J. Chun, Y. Kim, S.-J. Kim and J. Yoon, J. Org. Chem., 2006, 71, 8626–8628 CrossRef CAS PubMed.
- X. Y. Liu, D. R. Bai and S. Wang, Angew. Chem., Int. Ed., 2006, 45, 5475–5478 CrossRef CAS PubMed.
- (a) J. Wu, B. Kwon, W. Liu, E. V. Anslyn, P. Wang and J. S. Kim, Chem. Rev., 2015, 115, 7893–7943 CrossRef CAS PubMed; (b) R. Martínez-Máñez and F. Sancenón, Chem. Rev., 2003, 103, 4419–4476 CrossRef PubMed; (c) Y. Zhou, J. F. Zhang and J. Yoon, Chem. Rev., 2014, 114, 5511–5571 CrossRef CAS PubMed.
- Z. Guo, N. R. Song, J. H. Moon, M. Kim, E. J. Jun, J. Choi, J. Y. Lee, C. W. Bielawski, J. L. Sessler and J. Yoon, J. Am. Chem. Soc., 2012, 134, 17846–17849 CrossRef CAS PubMed.
- T. Gunnlaugsson, P. E. Kruger, P. Jensen, F. M. Pfeffer and G. M. Hussey, Tetrahedron Lett., 2003, 44, 8909–8913 CrossRef CAS.
- X. Xie, M. Pawlak, M. Tercier-Waeber and E. Bakker, Anal. Chem., 2012, 84, 3163–3169 CrossRef CAS PubMed.
- Y. Liu, Y. Tang, N. N. Barashkov, I. S. Irgibaeva, J. W. Y. Lam, R. Hu, D. Birimzhanova, Y. Yu and B. Z. Tang, J. Am. Chem. Soc., 2010, 132, 13951–13953 CrossRef CAS PubMed.
- R. N. Dansby-Sparks, J. Jin, S. J. Mechery, U. Sampathkumaran, T. W. Owen, B. D. Yu, K. Goswami, K. Hong, J. Grant and Z.-L. Xue, Anal. Chem., 2010, 82, 593–600 CrossRef CAS PubMed.
- M. Ishida, P. Kim, J. Choi, J. Yoon, D. Kim and J. L. Sessler, Chem. Commun., 2013, 49, 6950–6952 RSC.
- R. Ali, T. Lang, S. M. Saler, R. J. Meier and O. S. Wolfbeis, Anal. Chem., 2011, 83, 2846–2851 CrossRef CAS PubMed.
- D. Wencel, J. P. Moore, N. Stevernson and C. McDonagh, Anal. Bioanal. Chem., 2010, 398, 1899–1907 CrossRef CAS PubMed.
- Q. Xu, S. Lee, Y. Cho, M. H. Kim, J. Bouffard and J. Yoon, J. Am. Chem. Soc., 2013, 135, 17751–17754 CrossRef CAS PubMed.
- M. Lee, S. Jo, D. Lee, Z. Xu and J. Yoon, Dyes Pigm., 2015, 120, 288–292 CrossRef CAS.
- M. Lee, J. H. Moon, K. M. K. Swamy, Y. Jeong, G. Kim, J. Choi, J. Y. Lee and J. Yoon, Sens. Actuators, B, 2014, 199, 369–376 CrossRef CAS.
- K. D. Prasad, N. Venkataramaiah and T. N. G. Row, Cryst. Growth Des., 2014, 14, 2118–2122 Search PubMed.
- (a) S. S. Razi, P. Srivastava, R. Ali, R. C. Gupta, S. K. Dwivedi and A. Misra, Sens. Actuators, B, 2015, 209, 162–171 CrossRef CAS; (b) R. Ali, S. S. Razi, R. C. Gupta, S. K. Dwivedi and A. Misra, New J. Chem., 2016, 40, 162–170 RSC.
- (a) S. Liu, W. Wang, A. Briseno, S. Mannsfeld and Z. Bao, Adv. Mater., 2009, 21, 1217–1232 CrossRef CAS; (b) D. Braga and G. Horowitz, Adv. Mater., 2009, 21, 1473–1486 CrossRef CAS; (c) S. Lee, S. Hotta and F. Nakanishi, J. Phys. Chem. A, 2000, 104, 1827–1833 CrossRef CAS; (d) S. Kanazawa, M. Ichikawa, Y. Fujita, R. Koike, T. Koyama and Y. Taniguchi, Org. Electron., 2008, 9, 425–431 CrossRef CAS; (e) R. Ali, S. S. Razi, P. Srivastava and A. Misra, Sens. Actuators, B, 2015, 221, 1236–1247 CrossRef CAS.
- S. Park, J. E. Kwon, S. H. Kim, J. Seo, K. Chung, S. Y. Park, D. J. Jang, B. M. Medina, J. Gierschner and S. Y. Park, J. Am. Chem. Soc., 2009, 131, 14043–14049 CrossRef CAS PubMed.
- D. Badone, M. Baroni, R. Cardamone, A. Ielmini and U. Guzzi, J. Org. Chem., 1997, 62, 7170–7173 CrossRef CAS PubMed.
- P. Dydio, D. Lichosyt and J. Jurczak, Chem. Soc. Rev., 2011, 40, 2971–2985 RSC.
- M. Shahid, P. Srivastava and A. Misra, New J. Chem., 2011, 35, 1690–1700 RSC.
- A. Misra, M. Shahid and P. Dwivedi, Talanta, 2009, 80, 532–538 CrossRef CAS PubMed.
- A. Misra, M. Shahid and P. Srivastava, Sens. Actuators, B, 2012, 169, 327–340 CrossRef CAS.
- H. A. Benesi and J. H. Hildebrand, J. Am. Chem. Soc., 1949, 71, 2703–2707 CrossRef CAS.
- A. Misra, P. Srivastava and M. Shahid, Analyst, 2012, 137, 3470–3478 RSC.
- M. J. Frisch, G. W. Truncks and H. B. Schlegel, GAUSSIAN 03, Revision E.01; Gaussian, Wallingford, CT, 2007 Search PubMed.
- (a) F. G. Bordwell, Acc. Chem. Res., 1988, 21, 456–463 CrossRef CAS; (b) J. V. Ros-Lis, R. Martinez-Manez, F. Sancenon, J. Soto, K. Rurack and H. Weißhoff, Eur. J. Org. Chem., 2007, 2449–2458 CrossRef CAS.
- (a) M. Boiocchi, L. D. Boca, D. Esteban-Gómez, L. Fabbrizzi, M. Licchelli and E. Monzani, Chem.–Eur. J., 2005, 11, 3097–3104 CrossRef CAS PubMed; (b) V. Amendola, M. Boiocchi, L. Fabbrizzi and A. Palchetti, Chem.–Eur. J., 2005, 11, 5648–5660 CrossRef CAS PubMed; (c) D. Esteban-Gómez, L. Fabbrizzi, M. Licchelli and D. Sacchi, J. Mater. Chem., 2005, 15, 2670–2675 RSC; (d) D. Esteban-Gómez, L. Fabbrizzi and M. Licchelli, J. Org. Chem., 2005, 70, 5717–5720 CrossRef PubMed.
Footnote |
| † Electronic supplementary information (ESI) available. See DOI: 10.1039/c6ra26439e |
| This journal is © The Royal Society of Chemistry 2017 |

