 Open Access Article
In situ DRIFTS study of the NO + CO reaction on Fe–Co binary metal oxides over activated semi-coke supports†
Luyuan Wanga,
Zhiqiang Wanga,
Xingxing Cheng *a,
Mengze Zhangac,
Yukun Qinab and
Chunyuan Maa
aNational Engineering Lab for Coal-fired Pollutants Emission Reduction, Shandong Provincial Key Lab of Energy Carbon Reduction and Resource Utilization, Shandong University, Jinan, China 250061. E-mail: xcheng@sdu.edu.cn
bSchool of Power Engineering, Harbin Institute of Technology, Harbin, China 150001
cShandong Shenhua Shanda Energy Environment Co., Ltd, No. 173 Lishan Road, Jinan, China 250061
First published on 24th January 2017
Abstract
Activated semi-coke loaded with Fe and Co species by a hydrothermal method exhibited excellent CO-deNOx performance. In this study, the reaction mechanism and the evolution of surface-adsorbed species were investigated by CO-TPR, NO-TPO, and in situ DRIFTS. The results demonstrated that in the temperature range of 100–350 °C, the adsorbed CO coordinated to Fe species, inducing an electron migration that influenced the valence state of Fe. Furthermore, the Fe3+ species were found to be the active sites for the transformation of adsorbed CO, whereas the Co3+ species provided the sites for NO evolution. In the catalytic reaction, the Fe–Co interaction could also promote the transformation of adsorbed NO and CO. The DRIFTS spectra revealed that at relatively low temperatures, the transformation of NO species occurred in the following order: NO → NO2− → NO–NO3− → N2O; at higher temperatures, the NO species evolved in the order: NO → NO2− → bidentate NO3− → chelate NO3− + N2. However, the CO transformation process was the same at both low and high temperatures: CO → COO− → CO32− → CO2. NO2− proved to be an important intermediate in the NO + CO reaction.
1 Introduction
Nitrogen oxides (NOx) emitted from power plants and automobiles, are considered to be the primary pollutants of the atmosphere. The evolution of NOx in the environment can generate photochemical smog, acid rain, and ground level ozone.1 Since environmental laws and regulations are becoming more rigorous and stringent, the abatement of NOx achieves significant attention from researchers.Among the deNOx processes, the use of carbon-based materials as supports or catalysts is an important approach, especially at low temperatures (<300 °C). As reported, the carbon-based materials used in deNOx technologies can be generally classified into three categories: (1) sorbents for NOx adsorption from flue gases;2–5 (2) catalysts promoting the reaction between NOx and a reductant,6–8 e.g., NH3, or direct NOx reduction to produce N2, N2O, and CO2;9–14 and (3) supports to metal catalysts that promote the reaction of NOx with a reductant,15–20 decomposition,21–23 or the reaction with the carbonaceous species of the support.24,25 NH3 has been shown26–28 to be a very efficient reductant for carbon-based deNOx processes; however, its use is limited by disadvantages such as NH3 leakage and difficult production. Thus, the development of alternative reducing agents is highly desirable. Because CO is inexpensive, can be easily produced, and cannot generate solid carbon deposits29,30 upon reaction with NO, the application and investigation of CO as a substitute of NH3 have received considerable attention.
It has been demonstrated that transition metals supported on carbonaceous materials can efficiently promote the NO + CO reaction in the absence of O2. Mehandjiev et al.31 reported that cobalt oxide supported on activated carbon (Co/AC) catalyzed the reduction of NO by CO in the absence of O2 at 100–550 °C. In the NO + CO reaction over Co/AC, NO was decomposed by CO to form mainly N2O at low temperatures (<300 °C), whereas at high temperatures N2 was the main product. Moreover, Stegenga32 proposed that, when copper and chromium oxides were co-impregnated on carbon supports, the resultant catalyst was active for both NO reduction by CO and CO oxidation by O2. In addition, complete inhibition of NO reduction was observed in the presence of oxygen. A similar conclusion was reached by MarquezAlvarez et al.,33 i.e., O2 competed with NO and reacted with CO. Recently, carbon-based materials have been investigated as catalysts or supports for the NO + CO reaction.34,35 It was established that carbonaceous species could activate NO reacting with CO, additionally, Cr introduction would enhanced the reaction greatly. Besides Cr addition, metal or acid modification can also enhance the reaction of NO + CO over carbon-based materials. It has been proposed that alkali metals,36 such as potassium, and nitric acid21 possesses an enhancing effect for the reaction, which was attributed to an increasing number of reaction sites via the catalyst dispersion.
The mechanism of the NO + CO reaction over metal oxide catalysts, especially in terms of the redox performance,37 amount of surface oxygen vacancies,38 and dispersion of metal oxides,39 has been widely studied. And with the help of in situ diffuse reflectance infrared Fourier transform spectroscopy (DRIFTS), the evolution of NO and CO over metal-oxides-type catalysts has been investigated very thoroughly,30,37,38 i.e., adsorbed NO is transformed into coordinated species such as bidentate nitrates, which then react with the CO species to afford N2O/N2 and CO2. However, there are very few reports on the study of the evolution of adsorbed NO and CO over carbon-based catalysts using in situ DRIFTS measurements.
In our previous studies,40–42 cost-effective commercial semi-coke was modified with nitric acid, and transition metals such as Fe and Co were doped on its surface. The highest deNOx activity was achieved with a Fe![[thin space (1/6-em)]](https://www.rsc.org/images/entities/char_2009.gif) :
:![[thin space (1/6-em)]](https://www.rsc.org/images/entities/char_2009.gif) Co molar ratio of 0.8
Co molar ratio of 0.8![[thin space (1/6-em)]](https://www.rsc.org/images/entities/char_2009.gif) :
:![[thin space (1/6-em)]](https://www.rsc.org/images/entities/char_2009.gif) 0.2, in the temperature range of 100–350 °C. The results demonstrated that the formation of a special synergetic oxygen vacancy (Fe3+–□–Co3+) in the binary metal oxide was responsible for the high deNOx performance. In this paper, the transformation of the adsorbed species was investigated. The interaction between the original surface species and the adsorbed species has been further studied. CO temperature-programmed reduction (CO-TPR) and NO temperature-programmed oxidation (NO-TPO) were used to evaluate the effect of the temperature on the reaction of surface-adsorbed species. In order to gain further insight into the changes of the surface-adsorbed species and the NO + CO reaction mechanism over carbon-based catalysts, in situ DRIFTS analysis, including steady-state and transient response experiments, was also performed under simulated reaction conditions to identify a feasible reaction pathway for future applications.
0.2, in the temperature range of 100–350 °C. The results demonstrated that the formation of a special synergetic oxygen vacancy (Fe3+–□–Co3+) in the binary metal oxide was responsible for the high deNOx performance. In this paper, the transformation of the adsorbed species was investigated. The interaction between the original surface species and the adsorbed species has been further studied. CO temperature-programmed reduction (CO-TPR) and NO temperature-programmed oxidation (NO-TPO) were used to evaluate the effect of the temperature on the reaction of surface-adsorbed species. In order to gain further insight into the changes of the surface-adsorbed species and the NO + CO reaction mechanism over carbon-based catalysts, in situ DRIFTS analysis, including steady-state and transient response experiments, was also performed under simulated reaction conditions to identify a feasible reaction pathway for future applications.
2 Experiments
2.1 Catalysts preparation
Commercial semi-coke (Shaanxi Shenmu Coal Mine Co., Ltd., China) was ground and sieved into granules with diameters of 1.02–1.27 mm, and was denoted as SC. The SC particles were then activated using nitric acid (30 wt%) at 80 °C for 2 h. Next, the particles were washed with deionized water and then dried at 120 °C for 6 h, followed by calcination in Ar at 700 °C for 4 h. These particles are referred to as ASC.ASC was loaded with transition metals by a hydrothermal method. Ferric nitrate and cobalt nitrate (analytical reagent grade, Sinopharm Chemical Reagent Co., Ltd.) were first dissolved in deionized water to form the precursor solution. Table 1 summarizes the loading amount and textural properties of the prepared catalysts. ASC (5 g) was then immersed in 30 mL precursor solution and transferred into a stainless steel autoclave, which was maintained at 160 °C for 24 h. Next, the activated coke particles were washed using deionized water and then dried at 120 °C for 6 h, followed by calcination in Ar at 700 °C for 4 h.
| Catalysts | Concentration of precursor liquid (mol L−1) | Fe loading wt% (ICP) | Co loading wt% (ICP) | Average pore width (nm) | Pore volume (cm3 g−1) | Surface area (m2 g−1) |
|---|---|---|---|---|---|---|
| Fe0.8Co0.2/ASC | Fe(NO3)3: 1.653 | 5.58 | 1.49 | 2.14 | 0.59 | 272.096 |
| Co(NO3)3: 0.413 | ||||||
| Fe0.8/ASC | Fe(NO3)3: 1.653 | 2.04 | 1.76 | 0.59 | 333.021 | |
| Co0.2/ASC | Co(NO3)3: 0.413 | 0.39 | 1.74 | 0.59 | 359.996 | |
| ASC | 1.83 | 0.567 | 463.986 |
2.2 TPR and TPO experiments
CO-TPR and NO-TPO were performed using a Chemisorb instrument (Chembet Pulsar TPR/TPD 2139), in a quartz U-type reactor connected to a thermal conductivity detector. The module reductant gas was composed of 10 vol% CO balanced by He at a flow rate of 40 mL min−1. The oxidation gas was composed of 5 vol% NO balanced by He. The sample (100 mg) was pretreated in a N2 stream at 300 °C for 1 h, and TPR and TPO were then started from room temperature to 900 °C at a rate of 10 °C min−1.2.3 In situ DRIFTS study of the prepared catalysts
In situ DRIFTS spectra were recorded from 650 cm−1 to 4000 cm−1 at a spectral resolution of 4 cm−1 (number of scans, 100) on a Nicolet 6700 FTIR spectrophotometer equipped with a high-sensitive MCT detector cooled by liquid N2. The DRIFTS cell (Pike) was fitted with a ZnSe window and heating cartridge, which permits the heating of the sample to 500 °C. Before the performance, all the samples were grounded into fine powder (<2 μm) and diluted with KBr. The diluted multiple was approximate 150. Then the powders (approximately 25 mg) were placed on a sample holder and were carefully flattened to IR reflection. The sample was pretreated with a high-purity Ar stream at 400 °C for 1 h for eliminating the physically absorbed water and other impurities. At each target temperature, the sample background was collected during cooling. For steady state response, at each desired temperature, the sample was exposed to a controlled stream of 2000 ppm CO or/and 1000 ppm NO balanced by Ar at a flow rate of 100 mL min−1 for 0.5 h for saturation. And for transient response, the spectra were continuously collected synchronized with the reaction time at each desire condition. The spectra were recorded at various target temperatures by subtracting the corresponding background reference.3 Results and discussion
3.1 CO-TPR analysis of the prepared catalysts
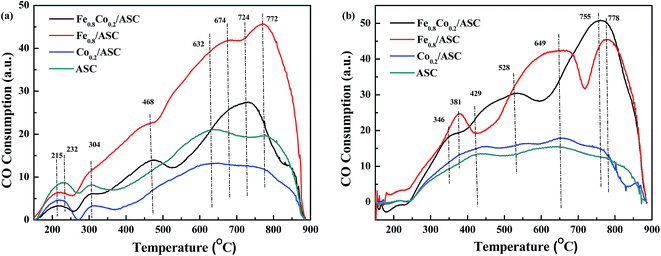
CO-TPR was performed to investigate the reducibility of the catalysts. The detection was carried out on differently pretreated catalysts. The fresh catalysts received no pretreatment, whereas NO-pretreated catalysts were purged with 1000 ppm NO (GHSV = 6000 h−1) at 300 °C for 30 min. The TPR profiles are shown in Fig. 1. For Fe0.8Co0.2/ASC, two main peaks were observed at 468 °C and 724 °C, and the latter was accompanied by a broad shoulder peak at 674 °C (Fig. 1(a)). The spectrum of the Fe0.8/ASC catalyst showed one strong peak at 772 °C, and two weak shoulder peaks at 468 °C and 674 °C. As for the Co0.2/ASC and ASC catalysts, no obvious peak was observed, and two weak broad peaks were detected at 632 °C and 772 °C. All spectra showed peaks at 150–300 °C, which were attributed to adsorbed oxygen species. As we previously proposed40 and according to the curves in Fig. S4,† the peak at 468 °C for Fe0.8Co0.2/ASC and Fe0.8/ASC should be ascribed to the reduction of Fe3+ to Fe2+,43 whereas the peak at 674 °C should be assigned to the characteristic peak of Fe2+.44,45 The peaks at temperatures higher than 700 °C should be assigned to oxides mixed with metals in the solid carbon. In Fig. S4,† it could be observed there were three main peaks in the detecting results of Co2O3. These three main peaks were speculated to Co3+ → Co2+ (330 °C), Co3O4 → CoO (492 °C) and CoO → Co0 (612 °C). Xie and co-workers46 also reported that Co species were very active for CO oxidation at low temperature. However, the spectra of Co0.2/ASC and ASC showed similar characteristic peaks, we speculated that on the surface of Co0.2/ASC, the loading amount of Co species is very low (0.39% in Table 1). Their characteristic peaks were covered by the reduction peaks of carbon species on ASC. Hence, these two peaks detected were ascribed to the reduction of ASC surface species.47,48 Furthermore, in the detecting of Fe2O3 (Fig. S4†), it was also observed that a very obvious inverse peaks appeared at approximate 370 °C, along with the main inverse peak, a broad weak concave peak was found in the temperature range of 130–250 °C. This phenomenon demonstrated that in the range of 130–250 °C, there were some physical adsorbed CO released from the sample. And at 370 °C, it was assumed some coordinated carbonates were decomposed. Nevertheless, we found there were no concave peaks for Co2O3. That implied CO was very easy to be oxidized on the surface of Co species, which resulted in coordinated carbonates were difficult to be generated.Fig. 1(b) displays the CO-TPR profiles of NO-pretreated catalysts. For Co0.2/ASC and ASC, a profile similar to that of the fresh samples was observed, and no obvious peak was found. On the other hand, the spectra of Fe0.8Co0.2/ASC and Fe0.8/ASC showed very obvious peaks. Peaks at 346 °C (Fe0.8Co0.2/ASC) and at 381 °C (Fe0.8/ASC) should be assigned to the adsorption of NO on Fe3+.30 The reducing of the peak temperature is speculated to the Fe–Co interaction. For Fe0.8Co0.2/ASC, the broad peak at 528 °C was attributed to the reduction of Fe3+. While for Fe0.8/ASC, the peak 649 °C should be ascribed to the reduction of Fe2+.
In Fig. 1, it could be found that the profile of samples containing of cobalt did not show characteristic peaks for cobalt oxides. According the XRD patterns (Fig. S1†), SEM images (Fig. S3†), it was deduced that on the surface, a small amount of cobalt oxides were surrounded by a large amount of iron oxides. These two kinds of metal oxides would interact with each other to generate core–shell structures (sphere blocks in Fig. S3(a)†). Co species have no chances to be reduced by CO, for that Fe species can easily adsorb CO. As we assumed, Fe species were the major CO adsorbents in the synergetic oxygen vacancy (Fe–□–Co).40 In the range of 100–350 °C, there was no obvious CO consumption peak, suggesting that CO might coordinate to the active metal cation leading to the electron excursion from the synergetic oxygen vacancy, and not electron transfer as proposed in our previous study.40
3.2 NO-TPO analysis of the prepared catalysts
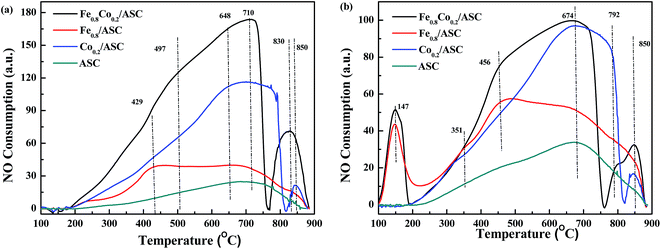
To further explore the NO evolution during the NO + CO reaction over Fe–Co bimetal catalysts supported by ASC, NO-TPO was performed on the fresh and CO-pretreated catalysts. The CO pretreatment consisted of purging the fresh catalysts with 2000 ppm CO (GHSV = 6000 h−1) at 3000 °C for 30 min. In order to confirm the active composition, NO-TPO of the pure metal oxides were performed. Fig. 2 and S5† shows the TPO profiles of the prepared catalysts. As shown in Fig. S5,† it was observed that for pure FeO, there was an overlap peak. With the help of Gauss Function in Origin software, we decomposed this peak into two peaks. The peak at 431 °C should be assigned to FeO → Fe3O4, while that at 524 °C to Fe3O4 → Fe2O3. In the profile of CoO, a broad main peak was observed. That was fitted into two peaks at 335 °C (CoO → Co3O4) and 412 °C (Co3O4 → Co2O3). For Fe0.8Co0.2/ASC, two main peaks were observed at 710 °C and 830 °C, along with a shoulder peak at 497 °C (Fig. 2(a)). The spectrum of Fe0.8/ASC showed a broad peak at 429 °C and a weak peak at 710 °C. Hence, we speculated that the peaks at 429 °C and 497 °C resulted from the oxidation of Fe2+. The difference in oxidation temperature was due to the different crystal texture of Fe species. In the spectrum of Co0.2/ASC, peaks at 648 °C, 790 °C, and 850 °C were observed. The peak at 648 °C could presumably be ascribed to the hysteresis of bulk Co species oxidation, and that at ∼790 °C to some difficult-to-oxidize Co species complexed with carbon. Moreover, for ASC, only one peak at 710 °C was detected, which can be assigned to the oxidation of surface species. Both spectra of Fe0.8Co0.2/ASC and Co0.2/ASC showed a peak in the range of 800–900 °C, which may be attributed to the decomposition of NO because Co species exhibited excellent NO decomposition ability49 (a similar curve shown in Fig. S5†).Fig. 2(b) displays the TPO profiles of CO-pretreated catalysts. Fe0.8Co0.2/ASC and Fe0.8/ASC gave a distinct peak at 147 °C, which was not observed in the spectra of the corresponding fresh catalysts (Fig. 2(a)). The consumption peak was attributed to the decomposition of adsorbed CO. Because only catalysts loaded with Fe species produced this peak, the Fe species on the catalyst surface were confirmed to be the active site for CO adsorption, as proposed in Section 3.1. For these two samples, the Fe2+ oxidation peak was found at a temperature (456 °C) different from that of the corresponding peak in the spectra of the fresh catalysts, suggesting that adsorbed CO could modify the cation electron structure.50 For all samples, a peak appeared at 674 °C, which was assigned to the oxidation of carrier species reduced by CO. In the case of Fe0.8Co0.2/ASC and Co0.2/ASC, this peak was more intense and could be attributed to the overlapping Co species and carrier species peaks.
In conclusion, strong reduction peaks were observed for catalysts doped with Fe (Fig. 1), whereas strong oxidation peaks appeared in the spectra of Co-containing samples (Fig. 2). Moreover, CoO shows excellent activity for NO reduction. It is reasonable to assume that, in the NO + CO reaction catalyzed by Fe–Co-based catalysts, the Fe species provided the active sites for CO adsorption, whereas Co cations played a major role in NO evolution.
3.3 In situ DRIFTS analysis of representative differently pretreated catalysts
In situ DRIFTS study of the surface-adsorbed species is a valuable method to investigate the catalytic mechanism. In this work, a DRIFTS study was performed to explore the adsorbed NO and CO species in the NO + CO reaction with the aim to further clarify the surface species evolution and the electron-transfer process.![[double bond, length as m-dash]](https://www.rsc.org/images/entities/char_e001.gif) O), νas(CO32−) in bidentate coordination, the ν of CO32− species adsorbed on Fe3+ in bidentate (1590 cm−1)51,52 and monodentate coordination (1435 cm−1),30,37 and νas(COO−), respectively. Moreover, the intensity of these peaks decreased continuously with increasing temperature. When the temperature is higher than 300 °C, some CO32− species disappeared. The spectra in Fig. 3(b)–(d) showed similar phenomenon to that in Fig. 3(a). Some peaks also appeared in the range of 1350–1800 cm−1. The bands at 1742 cm−1, 1677 cm−1, 1515 cm−1, and 1378 cm−1 were assigned to ν(C
O), νas(CO32−) in bidentate coordination, the ν of CO32− species adsorbed on Fe3+ in bidentate (1590 cm−1)51,52 and monodentate coordination (1435 cm−1),30,37 and νas(COO−), respectively. Moreover, the intensity of these peaks decreased continuously with increasing temperature. When the temperature is higher than 300 °C, some CO32− species disappeared. The spectra in Fig. 3(b)–(d) showed similar phenomenon to that in Fig. 3(a). Some peaks also appeared in the range of 1350–1800 cm−1. The bands at 1742 cm−1, 1677 cm−1, 1515 cm−1, and 1378 cm−1 were assigned to ν(C![[double bond, length as m-dash]](https://www.rsc.org/images/entities/char_e001.gif) O), νas(CO32−) in bidentate coordination, νas(COO−), and νs(COO−), respectively. Other bands were observed at 1537 cm−1 and 1795 cm−1, attributed to the red shift of ν(CO32−) and coupling ν(C
O), νas(CO32−) in bidentate coordination, νas(COO−), and νs(COO−), respectively. Other bands were observed at 1537 cm−1 and 1795 cm−1, attributed to the red shift of ν(CO32−) and coupling ν(C![[double bond, length as m-dash]](https://www.rsc.org/images/entities/char_e001.gif) O).30,37,53–55 However, the evolution of the intensity along with the temperature was very different from that in Fig. 3(a). In Fig. 3(b) and (d), at lower temperatures, the peaks at 1378 cm−1 and 1515 cm−1 were unobvious, and their intensity increased with increasing temperature. These results indicated that, on the surface of ASC and Fe0.8/ASC, the adsorbed CO reacted with Oα (chemisorb oxygen), affording carbonate species while simultaneously transferring electrons to cation species. Ligand bonding between carbonates and reduction species was strong and not easily cleaved, even at high temperatures. Notably, the change in peak intensity with the temperature was different for ASC and Fe0.8/ASC. For Fe0.8/ASC, at high temperatures, the intensity of the peak at 1515 cm−1 was stronger than that of the peak at 1378 cm−1; the opposite was observed for the ASC support. In the spectrum of Co0.2/ASC (Fig. 3(c)), the intensity of the peak at 1378 cm−1 increased at low temperatures and then gradually decreased at high temperatures, suggesting that carboxylate species were formed at intermediate temperatures and decomposed at higher temperatures. For ASC and Fe0.8/ASC, the adsorption peaks at 1677 cm−1 and 1742 cm−1 significantly increased with the temperature, indicating that Fe species were sensitive to adsorbed CO, and the interaction of Fe-ASC could promote COx transformation. However, in the spectrum of Co0.2/ASC (Fig. 3(c)), the same peaks first increased and then decreased, which was like the evolution in Fig. 3(a). This intensity change could be explained by the fact that, at lower temperatures, CO is adsorbed to generate carbonate species, whereas at higher temperatures, some carbonate species perhaps desorbed from the surface or decomposed, resulting in a lower peak. Comparing the results shown in Fig. 3(a–d), it could be deduced that samples containing of Co species would promote the carbonates decomposition. The ASC support had an excellent performance for CO adsorption, while Fe species would promote the CO species transforming.
O).30,37,53–55 However, the evolution of the intensity along with the temperature was very different from that in Fig. 3(a). In Fig. 3(b) and (d), at lower temperatures, the peaks at 1378 cm−1 and 1515 cm−1 were unobvious, and their intensity increased with increasing temperature. These results indicated that, on the surface of ASC and Fe0.8/ASC, the adsorbed CO reacted with Oα (chemisorb oxygen), affording carbonate species while simultaneously transferring electrons to cation species. Ligand bonding between carbonates and reduction species was strong and not easily cleaved, even at high temperatures. Notably, the change in peak intensity with the temperature was different for ASC and Fe0.8/ASC. For Fe0.8/ASC, at high temperatures, the intensity of the peak at 1515 cm−1 was stronger than that of the peak at 1378 cm−1; the opposite was observed for the ASC support. In the spectrum of Co0.2/ASC (Fig. 3(c)), the intensity of the peak at 1378 cm−1 increased at low temperatures and then gradually decreased at high temperatures, suggesting that carboxylate species were formed at intermediate temperatures and decomposed at higher temperatures. For ASC and Fe0.8/ASC, the adsorption peaks at 1677 cm−1 and 1742 cm−1 significantly increased with the temperature, indicating that Fe species were sensitive to adsorbed CO, and the interaction of Fe-ASC could promote COx transformation. However, in the spectrum of Co0.2/ASC (Fig. 3(c)), the same peaks first increased and then decreased, which was like the evolution in Fig. 3(a). This intensity change could be explained by the fact that, at lower temperatures, CO is adsorbed to generate carbonate species, whereas at higher temperatures, some carbonate species perhaps desorbed from the surface or decomposed, resulting in a lower peak. Comparing the results shown in Fig. 3(a–d), it could be deduced that samples containing of Co species would promote the carbonates decomposition. The ASC support had an excellent performance for CO adsorption, while Fe species would promote the CO species transforming.
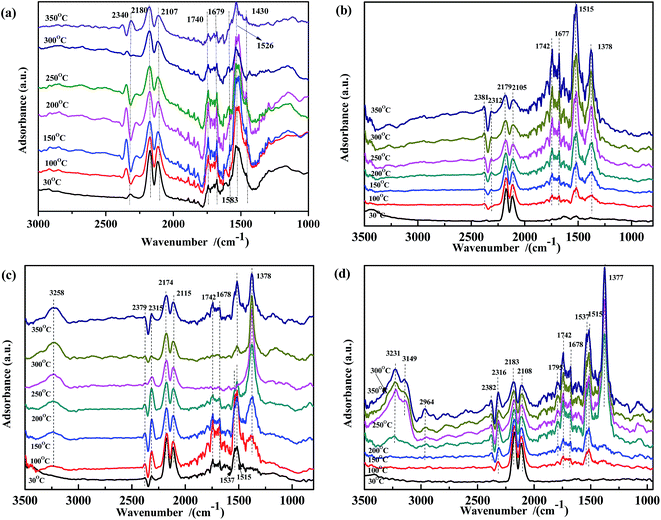 | ||
| Fig. 3 DRIFTS spectra of (a) Fe0.8Co0.2/ASC, (b) Fe0.8/ASC, (c) Co0.2/ASC, (d) ASC in a flow of 2000 ppm CO at 30, 100, 150, 200, 250, 300, 350 °C. | ||
In order to gain further insight into the NO species adsorbed on the catalysts at different temperatures, NO adsorption DRIFTS spectra were recorded (Fig. 4). For Fe0.8Co0.2/ASC (Fig. 4(a)), when the reaction temperature was below 150 °C, peaks appeared at 1750 cm−1, 1630 cm−1, and 1385 cm−1, assigned to NO weakly adsorbed on Cox+, νas(NO3−) in bridge bidentate coordination, and νas(NO2−),37,51,54,56 respectively. As the temperature increased, the peak shifted from 1385 cm−1 to 1379 cm−1, because of the formation of free nitrate ions.57 Moreover, in the spectra of Fe0.8/ASC, Co0.2/ASC, and ASC (Fig. 4(b)–(d)), a peak appeared at 1379 cm−1, indicating that the ASC carrier itself was an important contributor to the adsorption of NO. In Fig. 4(b)–(d), characteristic peaks of CO2 (approximately 2400 cm−1) were observed, suggesting that the adsorbed nitrogen oxides reacted with the carbonaceous species on the ASC surface, forming CO2. Moreover, peaks appeared at 1365 cm−1 and 1395 cm−1, attributed to the formation of nitrite and nitrate,37,57,58 respectively. With increasing temperature, these two bands shifted to 1379 cm−1 and 1260–1270 cm−1, respectively. The latter band was assigned to the vibration mode of chelating bidentate nitrite species.37,55 In the ASC and Fe0.8/ASC spectra, peaks were observed at 1904 cm−1 and 1846 cm−1, which were attributed to the characteristic vibration of the adsorbed NO species in linear and bent coordination modes, respectively.37,51,54,56 In Fig. 4(b) and (c), peaks were detected at 1120 cm−1, 2173 cm−1, and 2094 cm−1, assigned to the vibration of nitrosyl species, –NCO, and N2O, respectively, which were intermediates in the NO + CO reaction.54
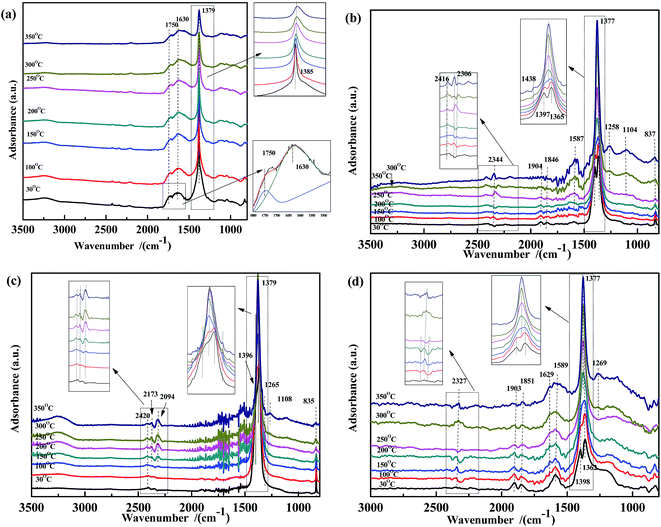 | ||
| Fig. 4 DRIFTS spectra of (a) Fe0.8Co0.2/ASC, (b) Fe0.8/ASC, (c) Co0.2/ASC, (d) ASC in a flow of 1000 ppm NO at 30, 100, 150, 200, 250, 300, 350 °C. | ||
The co-adsorption of NO and CO was investigated to further elucidate the effect of the temperature on the NO + CO reaction (Fig. 5). For all four samples, several peaks appear in the range of 1200–1400 cm−1, which were assigned to νas of free NO3− and did not decrease with the increasing temperature. This indicated that free nitrates acted as inert species, which were too stable to be reduced by CO in the temperature range used. Peaks (at 1597 cm−1, 1515 cm−1, and 1546 cm−1) assigned to bidentate carbonates38,51,56 were also observed in Fig. 5(b) and (d); however, these peaks are not present in Fig. 5(a) and (c), indicating that Fe species could promote the adsorption of carbonates.
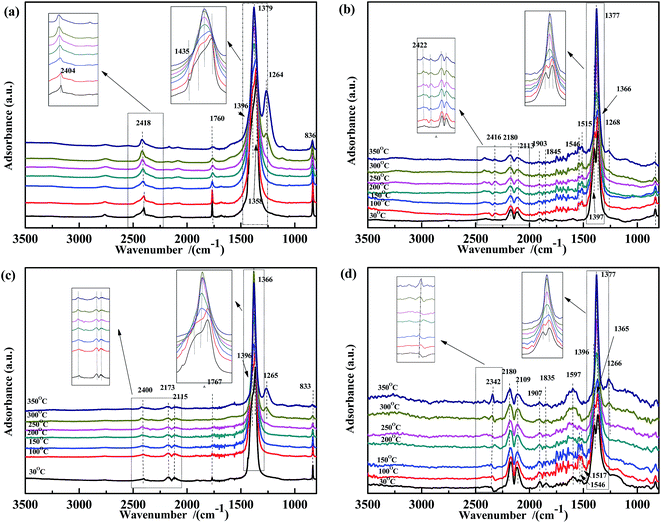 | ||
| Fig. 5 DRIFTS spectra of (a) Fe0.8Co0.2/ASC, (b) Fe0.8/ASC, (c) Co0.2/ASC, (d) ASC in a flow of 1000 ppm NO + 2000 ppm CO at 30, 100, 150, 200, 250, 300, 350 °C. | ||
Thus, in Fe–Co-based catalysts, Fe species were found to predominantly contribute to the adsorption of CO and assisted Co species in the transformation of adsorbed NO (as speculated in Section 3.2). By comparing the four spectra, it was speculated that the cobalt species in the catalysts played a key role in weakening the N–O bond, as revealed by the shift of the adsorbate (weakly adsorbed NO) wavenumber from 1907 cm−1 or 1835 cm−1 to 1767 cm−1. Moreover, a band were observed at 1767 cm−1, assigned to vibrational modes of Co(NO)2, indicating that Co ions acted as the active site for the transformation of nitrate oxides, which could promote the key step of the NO + CO reaction, i.e., the dissociation of NO.59 A comparison of Fig. 4(a) and 5(a) shows that the peaks at 1630 cm−1 disappeared, indicating that bidentate nitrates were intermediates of the reaction. In Fig. 3(a) and 5(a), the peaks assigned to the CO vibration and those at 1587 cm−1 were not detected, whereas the band at 1434 cm−1 disappeared above 150 °C, demonstrating that the carbonate species could not be easily generated in the presence of NO. This result may also imply that the adsorbed CO species could react with NO species fast in the co-existing of NO + CO. The high N2O selectivity at low temperatures can be attributed to the decomposition of nitro species.
![[double bond, length as m-dash]](https://www.rsc.org/images/entities/char_e001.gif) O)), 1673 cm−1 (νas(bidentate CO32−)), and 1520 cm−1 (νas(COO−)), whose intensity increased in the first 10 min. After this time, the bands at 1736 cm−1 and 1673 cm−1 remained unchanged, whereas the intensity of the band at 1520 cm−1 reached the maximum at 10 min and then slightly decreased to a steady-state value. On the basis of these results, it was speculated that ASC adsorbed CO and preliminarily catalyzed its transformation. Co addition promoted the formation of bidentate carbonates, whereas Fe was beneficial for the generation of carboxylate species. The Fe–Co interaction promoted the transformation of COO− to CO32−.
O)), 1673 cm−1 (νas(bidentate CO32−)), and 1520 cm−1 (νas(COO−)), whose intensity increased in the first 10 min. After this time, the bands at 1736 cm−1 and 1673 cm−1 remained unchanged, whereas the intensity of the band at 1520 cm−1 reached the maximum at 10 min and then slightly decreased to a steady-state value. On the basis of these results, it was speculated that ASC adsorbed CO and preliminarily catalyzed its transformation. Co addition promoted the formation of bidentate carbonates, whereas Fe was beneficial for the generation of carboxylate species. The Fe–Co interaction promoted the transformation of COO− to CO32−.
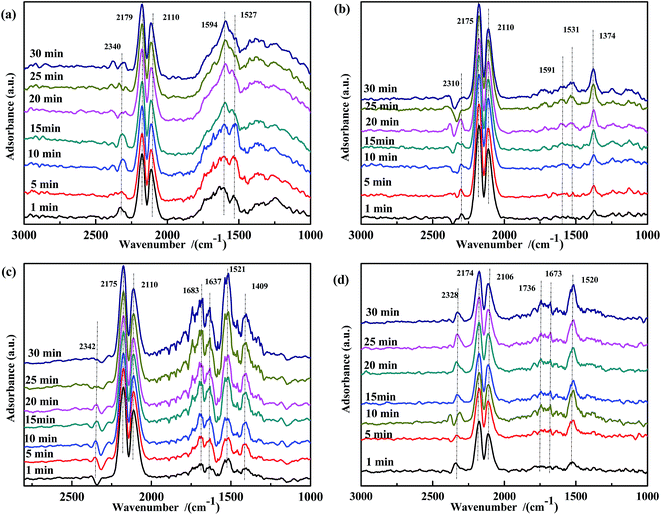 | ||
| Fig. 6 DRIFTS spectra of fresh catalysts: (a) Fe0.8Co0.2/ASC, (b) Fe0.8/ASC, (c) Co0.2/ASC, (d) ASC in a flow of 2000 ppm CO at 200 °C for different times. | ||
Because the presence of NO in flue gas could influence CO adsorption, a transient DRIFTS study of CO adsorption over NO-pretreated catalysts was also performed. As shown in Fig. 7, for all NO-pretreated samples, bands at ∼1590 cm−1 and 1375 cm−1 were detected, which were assigned to ν(NO3−). During CO adsorption, the band at 1375 cm−1 remained unchanged, demonstrating that free NO3− species were inert to reaction. For Fe0.8Co0.2/ASC (Fig. 7(a)), the intensity of the band at 1594 cm−1 was found to increase with reaction time. This could be explained by the interaction between the adsorbed NO3− and CO32− species. For Fe0.8/ASC (Fig. 7(b)), the band at 1510 cm−1 decreased, indicating that part of adsorbed NO interacted with CO, whereas the band at 1739 cm−1 first decreased and then increased, suggesting that, with time, the adsorbed NO gradually evolved and some CO was adsorbed. On the other hand, the band at 1588 cm−1 remained unaltered. In the spectrum of Co0.2/ASC (Fig. 7(c)), the change in intensity of the band at 1742 cm−1 showed a trend similar to that of the band at 1739 cm−1 in Fig. 7(b). This should be attributed to the low activity of the single metal-loaded catalysts. In the spectrum of ASC, the band at 1647 cm−1 (νas(bridge bidentate NO3−)) continuously decreased in intensity with time until it disappeared, indicating that bridge bidentate NO3− was highly reactive.
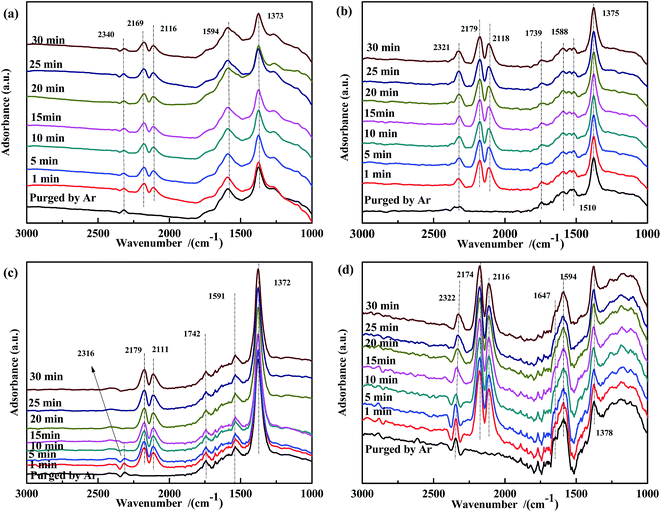 | ||
| Fig. 7 DRIFTS spectra of NO-pretreated catalysts: (a) Fe0.8Co0.2/ASC, (b) Fe0.8/ASC, (c) Co0.2/ASC, (d) ASC in a flow of 2000 ppm CO at 200 °C for different times. | ||
The NO species adsorbed on the prepared catalysts were identified by DRIFTS, and the results are shown in Fig. 8. For all samples, bands assigned to ν(NO) (∼1906 cm−1 and ∼1840 cm−1) were observed. For Fe0.8Co0.2/ASC (Fig. 8(a)), after 1 min of reaction, bands at 1641 cm−1 (νas(bridge bidentate NO3−)), 1589 cm−1 (ν(chelate NO3−)), 1374 cm−1 (ν(free NO3−)), and 1259 cm−1 (νs(chelate bidentate NO2−)) were detected. The band at 1641 cm−1 gradually decreased in intensity with time and disappeared after 15 min, while the intensity of the band at 1589 cm−1 increased. This indicated that some adsorbed NO species adopted a chelate coordination mode. The intensity of the bands at 1374 cm−1 and 1259 cm−1 increased with the adsorption time. For Fe0.8/ASC (Fig. 8(b)), bands assigned to weakly adsorbed NO (1739 cm−1), νas(bridge bidentate NO3−) (1640 cm−1), ν(chelate NO3−) (1589 cm−1), νas(monodentate NO3−) (1527 cm−1), and ν(free NO3−) (1378 cm−1) were observed. The intensity of the band at 1640 cm−1 decreased in the first 5 min and then remained constant, whereas that of the band at 1527 cm−1 increased with time. Thus, we speculated that, during the adsorption reaction, nitrates adopted a chelate coordination mode and Fe species promoted the formation of monodentate NO3−. As shown in Fig. 8(c), the intensity of the band at 1635 cm−1 decreased, whereas that of the band at 1539 cm−1 increased. This can be ascribed to the decomposition of bidentate NO3− and to the low activity of monodentate NO3−. A similar trend was observed for ASC (Fig. 8(d)), i.e., the amount of bidentate NO3− (1626 cm−1) decreased and that of chelate NO3− (1594 cm−1) increased with time. It was speculated that ASC could promote the transformation of bidentate NO3− to chelate NO3−. Moreover, the amount of free NO3− species (1367 cm−1) increased, presumably because of the low catalytic activity of the ASC support.
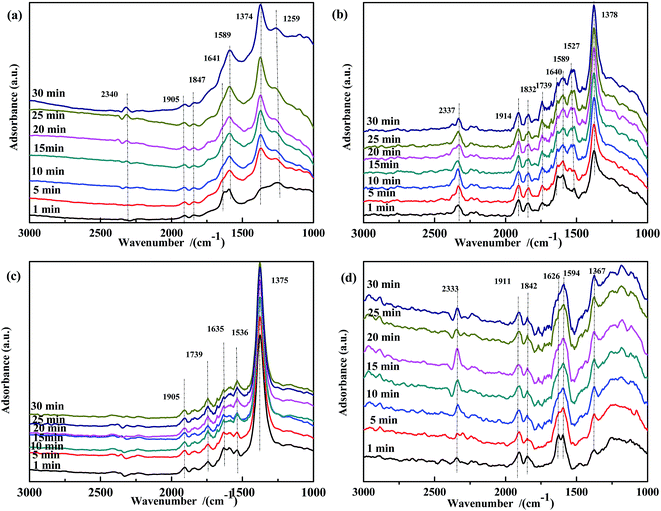 | ||
| Fig. 8 DRIFTS spectra of fresh catalysts: (a) Fe0.8Co0.2/ASC, (b) Fe0.8/ASC, (c) Co0.2/ASC, (d) ASC in a flow of 1000 ppm NO at 200 °C for different times. | ||
The effect of CO pretreatment on the evolution of the adsorbed NO species was investigated. As shown in Fig. 9(a), the intensity of the band at 1372 cm−1 gradually increased with reaction time, indicating that adsorbed CO reacted with adsorbed NO at 200 °C, and in the presence of adsorbed CO, no free NO3− was generated on the surface of Fe0.8Co0.2/ASC. This trend was also observed for Fe0.8/ASC and ASC. Thus, we assumed that, to some extent, adsorbed CO inhibited the formation of free NO3−. In Fig. 9(b), the band at 1257 cm−1 became more intense with time, demonstrating that CO pretreatment enhanced the activity of iron-based catalysts, i.e., low-valent NOx species were formed on CO-pretreated Fe0.8/ASC. In the spectrum of Co0.2/ASC (Fig. 9(c)), a band at 1386 cm−1 was observed in the first 10 min, and then its intensity decreased. This suggested that adsorbed CO promoted the activity of Co species in the transformation of NO to NO2−.
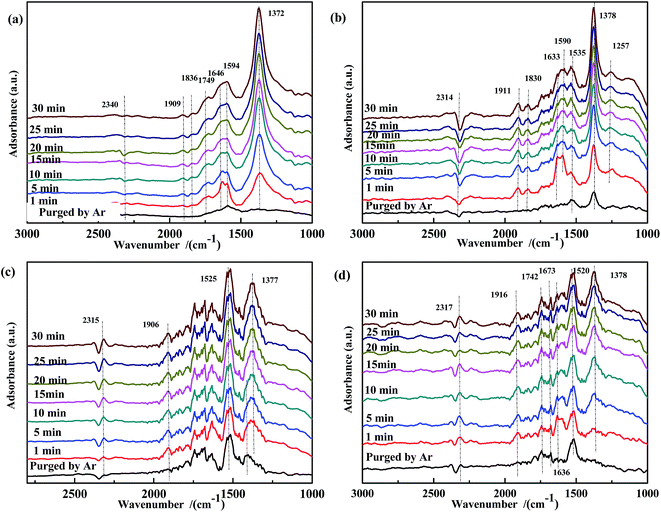 | ||
| Fig. 9 DRIFTS spectra of CO-pretreated catalysts: (a) Fe0.8Co0.2/ASC, (b) Fe0.8/ASC, (c) Co0.2/ASC, (d) ASC in a flow of 1000 ppm NO at 200 °C for different times. | ||
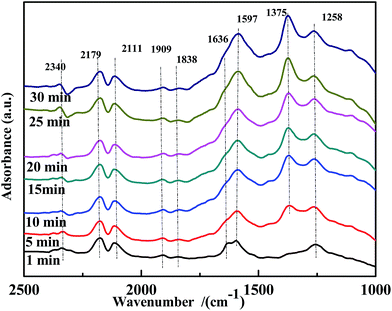
A transient DRIFTS study of the co-adsorption of NO and CO on Fe0.8Co0.2/ASC was performed to obtain information on the evolution of co-adsorbed CO and NO species. The results are shown in Fig. 10. Besides the bands at ∼2340 cm−1, ∼2179 cm−1, and ∼2111 cm−1, a band at 1597 cm−1, assigned to bidentate CO32−, was detected. This demonstrated that bidentate CO32− was the active intermediate in the reaction. Moreover, the evolution profile of adsorbed NO species was similar to that observed on the CO-pretreated catalysts. The band of bidentate NO3− (1636 cm−1) disappeared after 10 min of reaction, and chelated NO3− (1597 cm−1) was not observed. Thus, it was concluded that coordinated NO3− was the major reactive species. In addition, the intensity of the band at 1258 cm−1, assigned to νs(chelate bidentate NO2−), increased. We therefore speculated that, at 200 °C, highly reactive adsorbed CO and NO species were generated, but the catalysts had relatively low activity. These findings led to the conclusion that highly reactive bidentate CO32− or chelated NO3− did not undergo decomposition, and –NO2 species played the role as the intermediate of the transformation of NO to NO3−. However, because of the low catalytic activity at low temperatures, –NO2 would desorb from the surface affording N2O.
![[double bond, length as m-dash]](https://www.rsc.org/images/entities/char_e001.gif) O)) and 1572 cm−1 (ν(bidentate CO32−)) were observed. The band at 1609 cm−1 gradually decreased in intensity with time and disappeared after 10 min, whereas the intensity of the band at 1572 cm−1 continuously increased to a steady value. These observations indicated that CO was adsorbed on the surface and easily transformed to bidentate CO32−. Moreover, for Fe0.8/ASC (Fig. 11(b)), bands assigned to ν(bidentate CO32−) (1589 cm−1) and νs(COO−) (1378 cm−1) were detected, and their intensity increased with time. As compared to the spectrum of Fe0.8/ASC, additional bands, namely, at 1736 cm−1 (νas(C
O)) and 1572 cm−1 (ν(bidentate CO32−)) were observed. The band at 1609 cm−1 gradually decreased in intensity with time and disappeared after 10 min, whereas the intensity of the band at 1572 cm−1 continuously increased to a steady value. These observations indicated that CO was adsorbed on the surface and easily transformed to bidentate CO32−. Moreover, for Fe0.8/ASC (Fig. 11(b)), bands assigned to ν(bidentate CO32−) (1589 cm−1) and νs(COO−) (1378 cm−1) were detected, and their intensity increased with time. As compared to the spectrum of Fe0.8/ASC, additional bands, namely, at 1736 cm−1 (νas(C![[double bond, length as m-dash]](https://www.rsc.org/images/entities/char_e001.gif) O)), 1663 cm−1 (νas(bidentate CO32−)), 1545 cm−1 (νas(COO−)), and 1378 cm−1 (νs(COO−)) were observed in the spectrum of Co0.2/ASC (Fig. 11(c)). It was speculated that, at high temperatures, the interaction between ASC and Co oxides promoted the preliminary transformation of adsorbed CO. Moreover, for ASC (Fig. 11(d)), bands at 1573 cm−1 (ν(bidentate CO32−)), 1436 cm−1 (ν(monodentate CO32−)), and 1383 cm−1 (νs(COO−)) were observed.
O)), 1663 cm−1 (νas(bidentate CO32−)), 1545 cm−1 (νas(COO−)), and 1378 cm−1 (νs(COO−)) were observed in the spectrum of Co0.2/ASC (Fig. 11(c)). It was speculated that, at high temperatures, the interaction between ASC and Co oxides promoted the preliminary transformation of adsorbed CO. Moreover, for ASC (Fig. 11(d)), bands at 1573 cm−1 (ν(bidentate CO32−)), 1436 cm−1 (ν(monodentate CO32−)), and 1383 cm−1 (νs(COO−)) were observed.
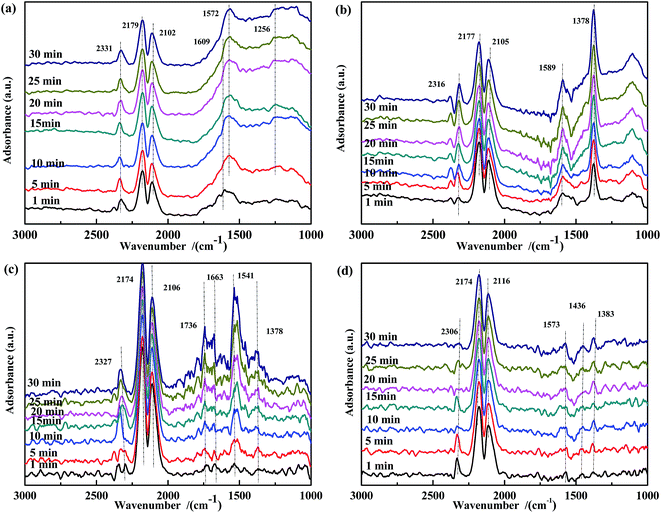 | ||
| Fig. 11 DRIFTS spectra of fresh catalysts: (a) Fe0.8Co0.2/ASC, (b) Fe0.8/ASC, (c) Co0.2/ASC, (d) ASC in a flow of 2000 ppm CO at 300 °C for different times. | ||
Fig. 12 shows the results of the influence of NO pretreatment at 300 °C. For all samples, bands in the ranges of 1730–1740 cm−1, 1550–1580 cm−1, and 1370–1380 cm−1 were observed, which were assigned to νas(NO), ν(chelated NO3−),60,61 and ν(free NO3−), respectively. The intensity of these bands decreased and then rapidly increased with time. It was speculated that the high temperature promoted the transformation of NO3− to CO32−. Because free NO3− species were inert, the band at ∼1375 cm−1 was assigned to ν(free NO3−). The spectrum of Fe0.8Co0.2/ASC (Fig. 12(a)) showed a new band at 1535 cm−1 after 15 min of reaction, suggesting the formation of COO−. Moreover, for catalysts containing Fe species, a band appeared at ∼1250 cm−1, and its intensity increased with time. We assumed that NO2− was the important intermediate for the transformation from NO to active NO3−.
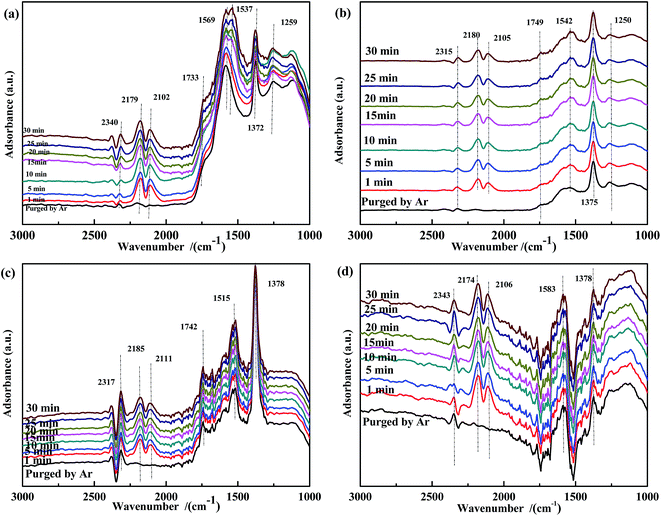 | ||
| Fig. 12 DRIFTS spectra of NO-pretreated catalysts: (a) Fe0.8Co0.2/ASC, (b) Fe0.8/ASC, (c) Co0.2/ASC, (d) ASC in a flow of 2000 ppm CO at 300 °C for different times. | ||
The spectra of NO-adsorbed catalysts are shown in Fig. 13. For all samples, the spectra were very similar to those collected at 200 °C. An important difference was the higher intensity of the band at ∼1590 cm−1, which indicated that the high temperature allowed the NO + CO reaction to occur between the adsorbed chelate NO3− and CO species. As revealed by Fig. 14, CO pretreatment promoted the formation of carbonate species on the surface of the catalysts, namely, bidentate CO32− (∼1590 cm−1) in Fig. 14(a), bidentate CO32− (1589 cm−1) and COO− (1517 cm−1 and 1377 cm−1) in Fig. 14(b), C![[double bond, length as m-dash]](https://www.rsc.org/images/entities/char_e001.gif) O (1753 cm−1) and COO− (1531 cm−1) in Fig. 14(c), and CO32− (1578 cm−1) and COO− (1372 cm−1) in Fig. 14(d). When NO adsorption (in Fig. 14) was performed at 300 °C, the evolution profile was similar to that observed in Fig. 13. For Fe0.8Co0.2/ASC and Fe0.8/ASC, the formation of chelate NO3− from bidentate NO3− was the main transformation process. In the spectrum of Co0.2/ASC, the band at ∼1590 cm−1 was not detected, indicating that CO32− species partly decomposed at this temperature.
O (1753 cm−1) and COO− (1531 cm−1) in Fig. 14(c), and CO32− (1578 cm−1) and COO− (1372 cm−1) in Fig. 14(d). When NO adsorption (in Fig. 14) was performed at 300 °C, the evolution profile was similar to that observed in Fig. 13. For Fe0.8Co0.2/ASC and Fe0.8/ASC, the formation of chelate NO3− from bidentate NO3− was the main transformation process. In the spectrum of Co0.2/ASC, the band at ∼1590 cm−1 was not detected, indicating that CO32− species partly decomposed at this temperature.
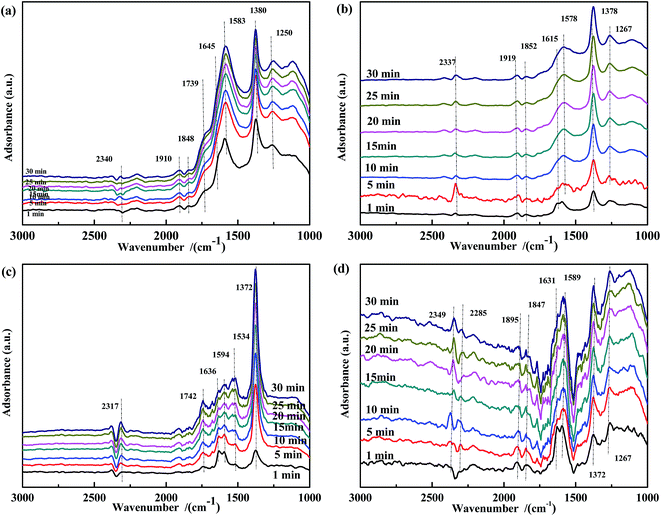 | ||
| Fig. 13 DRIFTS spectra of fresh catalysts: (a) Fe0.8Co0.2/ASC, (b) Fe0.8/ASC, (c) Co0.2/ASC, (d) ASC in a flow of 1000 ppm NO at 300 °C for different times. | ||
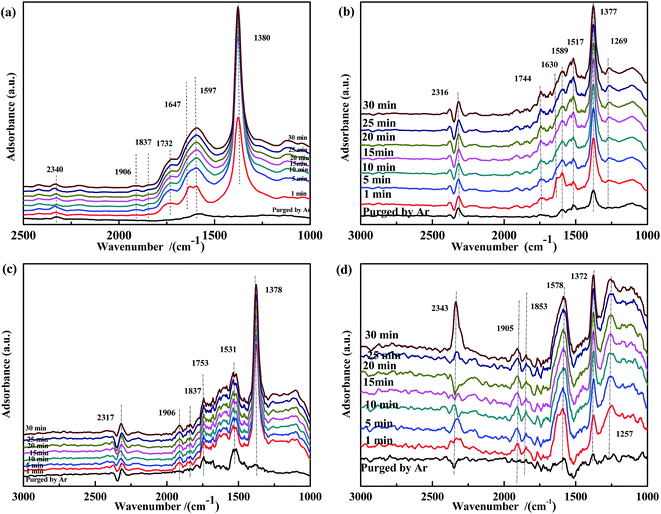 | ||
| Fig. 14 DRIFTS spectra of CO-pretreated catalysts: (a) Fe0.8Co0.2/ASC, (b) Fe0.8/ASC, (c) Co0.2/ASC, (d) ASC in a flow of 1000 ppm NO at 300 °C for different times. | ||
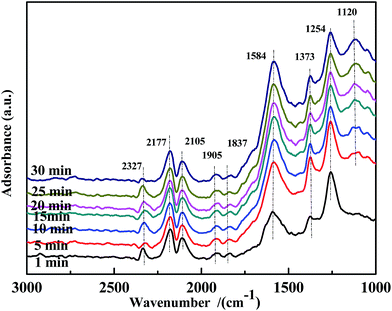
Fig. 15 illustrates the results of the co-adsorption of NO and CO at 300 °C. The bands assigned to bidentate CO32− (1584 cm−1), free NO3− (1373 cm−1), NO2− (1259 cm−1), and NO− (1120 cm−1) were observed, and their intensity increased with time. However, the bands related to bidentate or chelate NO3− were not detected. This demonstrates that coordinated NO3− was a very reactive species in the NO + CO reaction at this temperature.
3.4 Possible evolution of surface-adsorbed species over Fe–Co bimetal catalysts
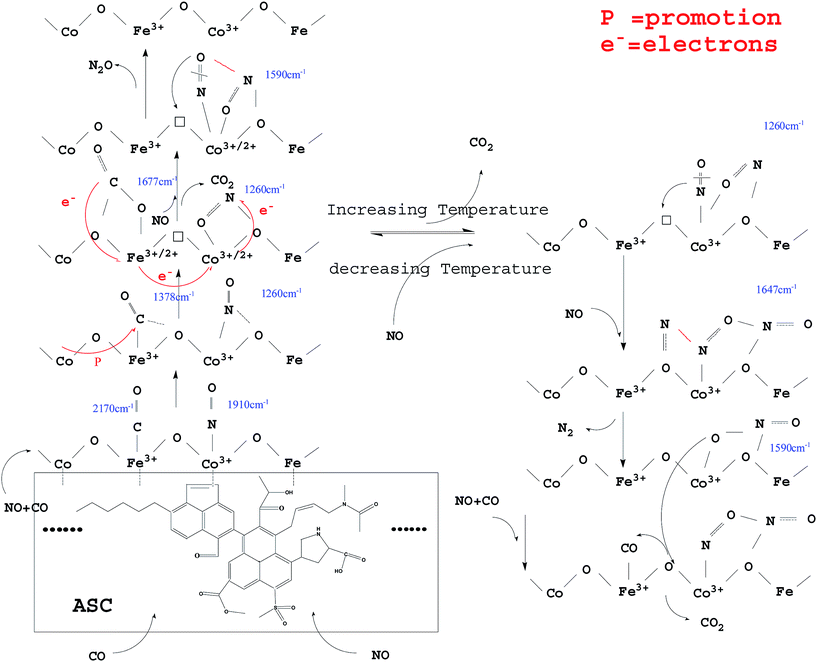
From the above analysis, it could be deduced that CO and NO were first adsorbed on the surface of the ASC support owing to its excellent adsorption properties. Then, the CO species were transferred mainly to the active Fe3+ sites; the Fe species promoted the coordination of CO with the O between Fe3+ and Co3+,40 with formation of COO− (1378 cm−1). The COO− species were activated by the adjacent Co and ASC, captured the O in the Fe3+–O–Co3+ system, and coordinated with the adjacent O to form CO32− (1677 cm−1). Next, the formed oxygen vacancies (Fe3+–□–Co3+) promoted the decomposition of CO32− to produce CO2. At high temperatures (300 °C), the evolution of adsorbed CO was similar to that at low temperatures (200 °C), whereas different profiles were observed for adsorbed NO species. At 200 °C, NO coordinated to Co3+ (<1910 cm−1) and then formed bonds with the adjacent O atoms. This mixed structure would renewedly transform and coordinate to Co3+, producing NO2− (1260 cm−1). This process involved the migration or transfer of electrons. Moreover, newly introduced NO would coordinate to Co species and interact with NO2−, thereby transferring an O to the vacancy with formation of N2O. At high reaction temperatures, adsorbed NO evolved to NO2− and then to bidentate NO3− (1647 cm−1). When new NO was injected, bidentate NO3− transformed into chelate NO3− with formation of N2.Hence, the evolution of NO and CO can be summarized as follows: CO → adsorbed CO → bidentate CO32−; NO → adsorbed NO → NO2− → NO–NO2− → N2O (low temperature); NO → adsorbed NO → NO2− → bidentate NO3− → N2 + chelate NO3− (high temperature). A possible scheme for NO reduction by CO over Fe0.8Co0.2/ASC is displayed in Fig. 16.
4 Conclusion
This study clarifies the mechanism of the NO + CO reaction on Fe–Co bimetal catalysts over ASC supports using CO-TPR, NO-TPO, and in situ DRIFTS measurements. Our results can be summarized as follows:(1) In the temperature range of 100–350 °C, for CO-deNOx process, CO could not reduce the valence state of Fe3+ and Co3+. Adsorbed CO coordinated to metal species and induced the migration of electrons to influence the cation valence.
(2) NO2− was an important intermediate in the NO + CO reaction. When the reaction temperature was relatively low, NO2− could not evolve and therefore produced N2O, whereas if the catalytic activity was high, NO2− could transform into NO3− with no N2O formation.
(3) In Fe–Co binary metals catalysts, Fe3+ and Co3+ proved to be the active sites for CO and NO evolution, respectively: Co species promoted the transformation of COO− to CO32−, whereas Fe species promoted the generation of chelate NO3−.
Acknowledgements
The authors thank the National Natural Science Foundation of China (No. 51406104), the Project of Shandong Province Science and Technology Development Program (No. 2014GSF117034), the National Key Technology R&D Program (No. 2014BAA02B03), the Independent Innovation Funds of Shandong Province (No. 2014ZZCX05201), and the National Science and Technology Support Project (No. 2014BAA02B03) for the financial supports.References
- K. Skalska, J. S. Miller and S. Ledakowicz, Sci. Total Environ., 2010, 408, 3976–3989 CrossRef CAS PubMed.
- I. Mochida, Y. Korai, M. Shirahama, S. Kawano, T. Hada, Y. Seo, M. Yoshikawa and A. Yasutake, Carbon, 2000, 38, 227–239 CrossRef CAS.
- P. Davini, Carbon, 2001, 39, 2173–2179 CrossRef CAS.
- P. Davini, Carbon, 2002, 40, 1973–1979 CrossRef CAS.
- M. Florent, M. Tocci and T. J. Bandosz, Carbon, 2013, 63, 283–293 CrossRef CAS.
- H. Ogihara, S. Takenaka, I. Yamanaka and K. Otsuka, Carbon, 2004, 42, 1609–1617 CrossRef CAS.
- A. Boyano, M. E. Gálvez, M. J. Lázaro and R. Moliner, Carbon, 2006, 44, 2399–2403 CrossRef CAS.
- H. Teng, Y.-T. Tu, Y.-C. Lai and C.-C. Lin, Carbon, 2001, 39, 575–582 CrossRef CAS.
- B. Bhaduri and N. Verma, J. Colloid Interface Sci., 2014, 436, 218–226 CrossRef CAS PubMed.
- W. T. Xu, J. C. Zhou, H. Li, P. F. Yang, Z. M. You and Y. S. Luo, Fuel Process. Technol., 2014, 127, 1–6 CrossRef CAS.
- J. Zhang, J. Y. Zhang, Y. F. Xu, H. M. Su, X. M. Li, J. Z. Zhou, G. R. Qian, L. Li and Z. P. Xu, Environ. Sci. Technol., 2014, 48, 11497–11503 CrossRef CAS PubMed.
- I. Aarna and E. M. Suuberg, Energy Fuels, 1999, 13, 1145–1153 CrossRef CAS.
- C. Y. Lu and M. Y. Wey, Fuel Process. Technol., 2007, 88, 557–567 CrossRef CAS.
- F. Goncalves and J. L. Figueiredo, Appl. Catal., B, 2004, 50, 271–278 CrossRef CAS.
- W. Jing, Q. Q. Guo, Y. Q. Hou, G. Q. Ma, X. J. Han and Z. G. Huang, Catal. Commun., 2014, 56, 23–26 CrossRef CAS.
- J. P. Wang, Z. Yan, L. L. Liu, Y. Chen, Z. T. Zhang and X. D. Wang, Appl. Surf. Sci., 2014, 313, 660–669 CrossRef CAS.
- Z. G. Huang, Y. Q. Hou, Z. P. Zhu and Z. Y. Liu, Catal. Commun., 2014, 50, 83–86 CrossRef CAS.
- Q. Y. Liu and Z. Y. Liu, Fuel, 2013, 108, 149–158 CrossRef CAS.
- W. Xie, Z. Sun, Y. Xiong, L. Li, T. Wu and D. Liang, Int. J. Min. Sci. Technol., 2014, 24, 471–475 CrossRef CAS.
- Y. L. Wang, X. X. Li, L. Zhan, C. Li, W. M. Qiao and L. C. Ling, Ind. Eng. Chem. Res., 2015, 54, 2274–2278 CrossRef CAS.
- Z. H. Zhu, L. R. Radovic and G. Q. Lu, Carbon, 2000, 38, 451–464 CrossRef CAS.
- Z. Zhu, G. Lu, Y. Zhuang and D. Shen, Energy Fuels, 1999, 13, 763–772 CrossRef CAS.
- D. Mehandjiev, M. Khristova and E. Bekyarova, Carbon, 1996, 34, 757–762 CrossRef CAS.
- A. Bueno-López and A. García-García, Carbon, 2004, 42, 1565–1574 CrossRef.
- Y. H. Hu and E. Ruckenstein, J. Catal., 1997, 172, 110–117 CrossRef CAS.
- J. Wang, Z. Yan, L. Liu, Y. Zhang, Z. Zhang and X. Wang, Appl. Surf. Sci., 2014, 309, 1–10 CrossRef CAS.
- J. Wang, Z. Yan, L. Liu, Y. Chen, Z. Zhang and X. Wang, Appl. Surf. Sci., 2014, 313, 660–669 CrossRef CAS.
- Y. Chen, J. Wang, Z. Yan, L. Liu, Z. Zhang and X. Wang, Catal. Sci. Technol., 2015, 5, 2251–2259 CAS.
- X. X. Cheng and X. T. T. Bi, Int. J. Chem. React. Eng., 2013, 11, 1–12 CrossRef.
- L. Dong, B. Zhang, C. Tang, B. Li, L. Zhou, F. Gong, B. Sun, F. Gao, L. Dong and Y. Chen, Catal. Sci. Technol., 2014, 4, 482–493 CAS.
- D. Mehandjiev and E. Bekyarova, J. Colloid Interface Sci., 1994, 166, 476–480 CrossRef CAS.
- S. Stegenga, R. Vansoest, F. Kapteijn and J. A. Moulijn, Appl. Catal., B, 1993, 2, 257–275 CrossRef CAS.
- C. MarquezAlvarez, I. RodriguezRamos and A. GuerreroRuiz, Carbon, 1996, 34, 1509–1514 CrossRef CAS.
- J. N. Rosas, J. Rodriguez-Mirasol and T. Corder, Energy Fuels, 2010, 24, 3321–3328 CrossRef CAS.
- J. M. Rosas, R. Ruiz-Rosas, J. Rodriguez-Mirasol and T. Cordero, Catal. Today, 2012, 187, 201–211 CrossRef CAS.
- D. Lopez and J. Calo, Energy Fuels, 2007, 21, 1872–1877 CrossRef CAS.
- X. Yao, Y. Xiong, W. Zou, L. Zhang, S. Wu, X. Dong, F. Gao, Y. Deng, C. Tang, Z. Chen, L. Dong and Y. Chen, Appl. Catal., B, 2014, 144, 152–165 CrossRef CAS.
- C. Sun, Y. Tang, F. Gao, J. Sun, K. Ma, C. Tang and L. Dong, Phys. Chem. Chem. Phys., 2015, 17, 15996–16006 RSC.
- M. Kacimi, M. Ziyad and L. F. Liotta, Catal. Today, 2015, 241, 151–158 CrossRef CAS.
- L. Wang, X. Cheng, Z. Wang, C. Ma and Y. Qin, Appl. Catal., B, 2017, 201, 636–651 CrossRef CAS.
- X. Cheng, M. Zhang, P. Sun, L. Wang, Z. Wang and C. Ma, Green Chem., 2016, 18, 5305–5324 RSC.
- L. Wang, X. Cheng, Z. Wang, X. Zhang and C. Ma, Can. J. Chem. Eng., 2016, 9999, 1–10 Search PubMed.
- M. Liang, W. Kang and K. Xie, J. Nat. Gas Chem., 2009, 18, 110–113 CrossRef CAS.
- G. Munteanu, L. Ilieva and D. Andreeva, Thermochim. Acta, 1997, 291, 171–177 CrossRef CAS.
- L. I. Ilieva, D. H. Andreeva and A. A. Andreev, Thermochim. Acta, 1997, 292, 169–174 CrossRef CAS.
- X. Xie, Y. Li, Z. Q. Liu, M. Haruta and W. Shen, Nature, 2009, 458, 746–749 CrossRef CAS PubMed.
- C.-W. Tang, C.-B. Wang and S.-H. Chien, Thermochim. Acta, 2008, 473, 68–73 CrossRef CAS.
- G. Fierro, M. Lo Jacono, M. Inversi, R. Dragone and P. Porta, Top. Catal., 2000, 10, 39–48 CrossRef CAS.
- L. Simonot and G. Maire, Appl. Catal., B, 1997, 11, 181–191 CrossRef CAS.
- A. Basińska, W. K. Jóźwiak, J. Góralski and F. Domka, Appl. Catal., A, 2000, 190, 107–115 CrossRef.
- M. C. Kung and H. H. Kung, Catal. Rev.: Sci. Eng., 1985, 27, 425–460 Search PubMed.
- P. G. Harrison and E. W. Thornton, J. Chem. Soc., Faraday Trans. 1, 1978, 74, 2703–2713 RSC.
- Y. Denkwitz, B. Schumacher, G. Kučerová and R. J. Behm, J. Catal., 2009, 267, 78–88 CrossRef CAS.
- Y. Lv, L. Liu, H. Zhang, X. Yao, F. Gao, K. Yao, L. Dong and Y. Chen, J. Colloid Interface Sci., 2013, 390, 158–169 CrossRef CAS PubMed.
- P. R. Griffiths and J. A. De Haseth, Fourier transform infrared spectrometry, John Wiley & Sons, 2007 Search PubMed.
- Y. Xiong, X. Yao, C. Tang, L. Zhang, Y. Cao, Y. Deng, F. Gao and L. Dong, Catal. Sci. Technol., 2014, 4, 4416–4425 CAS.
- G. Zhou, B. Zhong, W. Wang, X. Guan, B. Huang, D. Ye and H. Wu, Catal. Today, 2011, 175, 157–163 CrossRef CAS.
- X. Gu, H. Li, L. Liu, C. Tang, F. Gao and L. Dong, J. Rare Earths, 2014, 32, 139–145 CrossRef CAS.
- A. G. Makeev and N. V. Peskov, Appl. Catal., B, 2013, 132, 151–161 CrossRef.
- P. Zhang and L. Wang, Chin. J. Anal. Chem., 2002, 30, 1469–1472 CAS.
- R. Ke, J. Li, J. Hao, L. Fu, Q. Chen and D. Zhao, Chin. J. Catal., 2005, 26, 951–955 CAS.
Footnote |
| † Electronic supplementary information (ESI) available. See DOI: 10.1039/c6ra26395j |
| This journal is © The Royal Society of Chemistry 2017 |

