 Open Access Article
Creative Commons Attribution 3.0 Unported Licence
Good lithium storage performance of Fe2SiO4 as an anode material for secondary lithium ion batteries
Peisheng Guo and
Chengxin Wang *
*
The Key Laboratory of Low-Carbon Chemistry & Energy Conservation of Guangdong Province, State Key Laboratory of Optoelectronic Materials and Technologies, School of Materials Science and Engineering, Sun Yat-sen (Zhongshan) University, Guangzhou 510275, People’s Republic of China. E-mail: wchengx@mail.sysu.edu.cn; Fax: +86-20-84113901; Tel: +86-20-84113901
First published on 16th January 2017
Abstract
Fayalite was synthesized by a simple process. As an anode materials for lithium ion batteries, fayalite was mixed with acetylene black to prepare electrodes. The electrochemical properties of Fe2SiO4 particles were systematically investigated and our results proved that fayalite presents great specific capacity, superior rate capability and long battery cycle life when tested in the form of a half-cell. As a new anode material, fayalite showed a room-temperature invertible specific discharging capacity of 800 mA h g−1 at a current of 100 mA g−1 after 100 cycles, and that its reversible specific capacity reaches 520 mA h g−1 at a current density of 1600 mA g−1. This splendid lithium storage performance may result from the unique crystal structure of fayalite to form a channel that promotes the lithium ion insertion and extraction process and the formation of lithium silicate as a solid electrolyte. Therefore, fayalite could be a prospective alternative material for lithium-ion battery anodes.
Introduction
The large scale burning of fossil fuels, which has led to the ever-increasing emissions of greenhouse gases that have resulted in global warming, has restricted the urgency of exploiting renewable and environmentally friendly alternative sources of energy, for example, solar, wind, geothermal and tidal energy.1 However, the attainment and use of clean energy is always limited by environmental factors, such as space, weather and time. Therefore, in order to sustain the development of green sources of energy, we cannot over-emphasize the importance of storing energy and delivering it. It is universally acknowledged that electrochemical batteries are perfect storage systems to achieve this. What’s more, among them, lithium ion batteries, given their high energy and power density, outstanding cycle life, low self-discharge and lack of memory effect, appear to be the best choice.2–5 Although commercial graphite has resulted in the use of secondary lithium ion batteries for portable electronic products to boom, it is not yet enough to meet the requirements of energy storage in hybrid electric vehicles (HEVs) or electric vehicles (EVs),6–8 thanks to its low theoretical capacity (∼372 mA h g−1). Therefore, exploring safe, high capacity and long cycle life anode materials are ways to renew lithium ion battery chemistry. Taking anode materials into consideration, although silicon has a high theoretical capacity (4200 mA h g−1), it faces a large volume change (300%) upon charge and discharge, which would lead to a rapid capacity fade and short cycle life.9,10 On the other hand, in spite of great breakthroughs that have been made in the study of metal oxides, such as Mn2O3,11 Fe2O3 (ref. 12–14) and Co3O4,15–17 large capacity fade is the major issue that hinders their commercialization. In 2013, Zn2SiO4 nanorods and mesorods were prepared by a hydrothermal method, which displayed slow capacity fading during cycling.18 In the same year, through hydrothermal route, a new layered zinc silicate/carbon composite, in which the carbon was embedded into a zinc silicate sandwich, was fabricated by Wei-Guo Song and exhibited capacities ranging from 704–778 mA h g−1 at 50 mA g−1 after 50 cycles.19 In 2014, Franziska Mueller20 et al. reported that cobalt orthosilicate has superior performance when used as a lithium ion battery electrode material and the mechanism of the lithium intercalation/de-intercalation process was studied systematically. In 2015, Yung-Eun Sung21 et al. reported nanostructured metal silicates with tunable properties as lithium ion battery anode materials. Liqiang Mai22 et al. reported copper silicate hydrate hollow spheres as a lithium-ion battery anode material with long cycle life. These studies attracted large focus to a new group of anode active materials, metal silicates, which are easy to access and plentiful.Fayalite, which is stable under ambient conditions, is important in geophysics and materials science due to its applications as refractory materials, additives in cement concrete, acid-resistant containers, ceramic pigments, etc. Compared to cobalt orthosilicate, fayalite Fe2SiO4 is more suitable to be an anode material for rechargeable lithium ion batteries. On the one hand, iron is more abundant in the Earth’s crust and is cheaper. On the other hand, iron is nontoxic and environmentally friendly, while cobalt is poisonous. Therefore, great effort has been made to synthesize pure nanofayalite. In 1958, Ringwood23 first synthesized Fe2SiO4 by using a high temperature and high pressure method. In 2012, Michael T. DeAngelis24 reported a method for the synthesis of nanocrystalline fayalite using a sol–gel technique. In the same year, nanostructured fayalite with a large volume fraction of interfaces was synthesized via one-step mechanochemical processing of the stoichiometric mixture of α-Fe2O3, Fe and SiO2 precursors at ambient temperature by Vladirmir Seplak.25 However, the electrochemical performance of fayalite was not discussed in these studies. In 2014, fayalite@C was fabricated using a solid state method and displayed a specific capacity of 376.7 mA h g−1 at 1C for 100 cycles.26
In our previous work, we have reported a simple way to fabricate Co2SiO4 as well as its good lithium storage performance. The present work is focused around an easy synthesis method of nano-fayalite via a solvothermal and calcination process, followed by an exploration of its electrochemical performance. In this paper, the fayalite products were fabricated by a solvothermal reaction of a mixture of TEOS and C4H6O4Fe·4H2O, followed by calcination at 750 °C under vacuum for 4 hours. The lithium ion battery using fayalite as an anode material exhibited high reversible capacity (up to ∼800 mA h g−1) with excellent rate performance and superior reversible lithium storage capacity, which is much higher than in previous studies. The electrochemical performance comparison between this work and other transition metal silicates anodes is shown in Table 1.
| Sample name | Reversible capacity (mA h g−1) | Current density (mA g−1) | Cycle number |
|---|---|---|---|
| Carbon-coated manganese silicate | 345 | 100 | 100 |
| 337 | 500 | 600 | |
| Cobalt orthosilicate | 650 | 100 | 60 |
| Copper silicate hydrate hollow spheres | 890 | 200 | 200 |
| 429 | 1000 | 800 | |
| Nickel silicate hierarchical hollow spheres | 400 | 500 | 1000 |
| Fayalite@C nanocomposite | 447 | 1C | 100 |
| Layered zinc silicate | 778 | 50 | 50 |
| Fe–Si–O/carbon nanotube composite | 357 | 500 | 600 |
| 588 | 100 | 280 | |
| Iron silicate hollow nanostructures | 719.2 | 200 | 300 |
| Fayalite/this work | 800 | 100 | 100 |
Experimental
Synthesis of fayalite nanocrystals
All of the chemical reagents were of analytical reagent grade and were not purified prior to use. In order to synthesize fayalite particles, 0.34 mL TEOS (1.5 mmol) and 3 mL acetic acid were added to 30 mL of DMF solution with magnetic stirring for several minutes, and then 522 mg of C4H6O4Fe (3 mmol) was dissolved in the solution via magnetic stirring for 30 minutes. After stirring, the mixture was transferred to a 50 mL Teflon-lined autoclave and maintained at 200 °C for 24 h. After the temperature was reduced to room temperature naturally, the black powder was collected and then dried at 80 °C for 12 h after centrifugation, purging several times with deionized water and ethyl alcohol. Finally, the as-prepared powder was calcined under vacuum conditions at 750 °C for 4 h with a heating rate of 5 °C min−1 to obtain a gray powder.Characterization
XRD patterns of the products were gathered on a Rigaku D-MAX2200 VPC with CuKα radiation with a scanning rate of 5 deg min−1 from 10 to 80 deg. The generator voltage and current were 40 kV, 26 mA respectively. The sample morphology was investigated using a field-emission scanning electron microscope (FESEM, Carl Zeiss, Geminia). TEM observations were made using a FEI Tecnai G2 F30 at 300 kV. Meanwhile, an energy dispersive X-ray spectrum was collected using INCA300, which was installed in the TEM. An XPS spectrum was gathered using an ESCALab250 instrument.Electrochemical characterization
Electrochemistry experiments were carried out in coin-type cells (CR2032) in an argon-filled glove box with the concentration of oxygen and moisture below 1 ppm. The working electrode consisted of a mixture of fayalite Fe2SiO4 (active materials), sodium carboxymethylcellulose (binding agent) and acetylene black (conductive agent) in a weight ratio of 70![[thin space (1/6-em)]](https://www.rsc.org/images/entities/char_2009.gif) :
:![[thin space (1/6-em)]](https://www.rsc.org/images/entities/char_2009.gif) 10
10![[thin space (1/6-em)]](https://www.rsc.org/images/entities/char_2009.gif) :
:![[thin space (1/6-em)]](https://www.rsc.org/images/entities/char_2009.gif) 20. The slurry of this mixture was glued on pure copper foil and dried at 90 °C for 12 h in air subsequently. Both the counter electrode and reference electrode employed pure lithium foil. A polypropylene micro-membrane was selected as the separator. The electrolyte was made up of a solution of 1 M LiPF6 in ethylene carbonate (EC) and diethyl carbonate (DEC) with a weight ratio of 1
20. The slurry of this mixture was glued on pure copper foil and dried at 90 °C for 12 h in air subsequently. Both the counter electrode and reference electrode employed pure lithium foil. A polypropylene micro-membrane was selected as the separator. The electrolyte was made up of a solution of 1 M LiPF6 in ethylene carbonate (EC) and diethyl carbonate (DEC) with a weight ratio of 1![[thin space (1/6-em)]](https://www.rsc.org/images/entities/char_2009.gif) :
:![[thin space (1/6-em)]](https://www.rsc.org/images/entities/char_2009.gif) 1. The constant current charge and discharge tests were measured by a NEWARE battery tester at different current rates with a voltage window of 0.005–3.0 V. Cyclic voltammetry (0.05–3.00 V, 0.1 mV s−1) was carried out using an electrochemical workstation (IM6e-X).
1. The constant current charge and discharge tests were measured by a NEWARE battery tester at different current rates with a voltage window of 0.005–3.0 V. Cyclic voltammetry (0.05–3.00 V, 0.1 mV s−1) was carried out using an electrochemical workstation (IM6e-X).
Results and discussion
Structure and morphology
The phase was confirmed using X-ray powder diffraction (XRD). The XRD pattern of fayalite Fe2SiO4 was shown in Fig. 1. As shown in Fig. 1, all of the diffraction peaks are ascribed to the formation of a single fayalite phase of Fe2SiO4, as indicated by the strongest peak at (112), the strong peaks at (120), (130), (131) and (222), and the peak at (040). All of the peaks are consistent with the JCPDS card no. 71-1667, which indicates that the as-prepared products have an orthorhombic structure and the space group is Pbnm. However, in previous work, low intensity peaks at 44.9° and 65.2° were assigned to the presence of small amounts of reduced Fe,27 which indicates a small quantity of Fe impurity in the nanofayalite. In addition, fayalite possesses a crystal structure consisting of SiO4 tetrahedra and an O–Fe–O octahedron. The Fe2+ ions are linked together with six oxygen ions to form a nearly regular octahedron which lie at the corners. In summary the entire structure can be represented as a package of tetrahedral and octahedron structures.28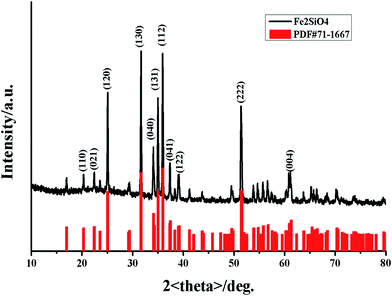 | ||
| Fig. 1 X-ray diffraction (XRD) pattern of the obtained fayalite Fe2SiO4 (black line) compared with the standard XRD pattern of fayalite: JCPDS card no. 71-1667 (red line). | ||
An X-ray photoelectron spectroscopy (XPS) spectrum was recorded to analyze the chemical composition and valence state of fayalite. The recorded spectra are shown in Fig. 2. From the wide-scan spectrum of Fe2SiO4, the signals of Fe, Si, O and C were observed clearly. The Fe 2p signal of Fe2SiO4 is shown in Fig. 2b, and two peaks located at 710.7 and 724.0 eV corresponded to the binding energy of Fe 2p3/2 and Fe 2p1/2. From previous work,29,30 the Fe 2p3/2 binding energies of Fe2+ ions in the iron silicates (fayalite) were 709.0–710.8 eV. According to Seyama’s research, the Fe 2p3/2 binding energies of Fe2+ ions in the silicates are much higher than that (709.5 eV (ref. 31)) in FeO, which the Fe2+ ion coordinated by six O ions. Satellite peaks on the high binding energy sides of the 2p3/2 and 2p1/2 peaks can both be observed from the Fe2+ 2p spectra. This appearance had been already found in the Fe 2p spectrum of fayalite.32 However, the satellite structure of fayalite in this work was not so clear compared to previous studies,32 which is similar to olivine 3 in the work of Seyama.29 This may resulted from the Fe2+ ions in the surface layer being transformed into Fe3+ ions whilst the fayalite was exposed to the atmosphere and efflorescence.31,33 In addition, as shown in Fig. 2b, satellite-main peaks for the 2p regions have been marked, and the energy differences were 5.4 and 5.9 eV, which is a good match with previous work.32 Simultaneously, the energy separation between the satellite peak and Fe 2p3/2 in the fayalite is 5.9 eV, while the energy separation of Fe2O3 is 7.8 eV. Combining the peaks of Fe 2p and the energy separation between the satellite peak and Fe 2p3/2, we know that the valence state of the iron ions is +2 in fayalite rather than +3 in Fe2O3. Meanwhile, the formation of Fe2SiO4 can be confirmed by studying the core level spectrum of Si 2p (Fig. 2c) and the core level spectrum of O 1s (Fig. 2d). The binding energy of the Si 2p peaks is located at 102 eV, which indicated the formation of pure iron silicates rather than the formation of silica and metal oxide mixtures, as the binding energy of Si 2p in SiO2 (103.5 eV) is much higher than that found in many silicates (102–103 eV).34,35 In addition, the main peak of O 1s lies at 531.1 eV, which was well demonstrated in a previous study.36 From the XPS spectrum of Si 2p and O 1s, we can find the existence of SiO2, which may result from the amorphous SiO2which can be observed in the TEM image. However, the peaks are very weak. The production of the reaction product, single phase Fe2SiO4 (fayalite), can be confirmed from the XPS spectrum, which is in keeping with the XRD analysis shown in Fig. 1.
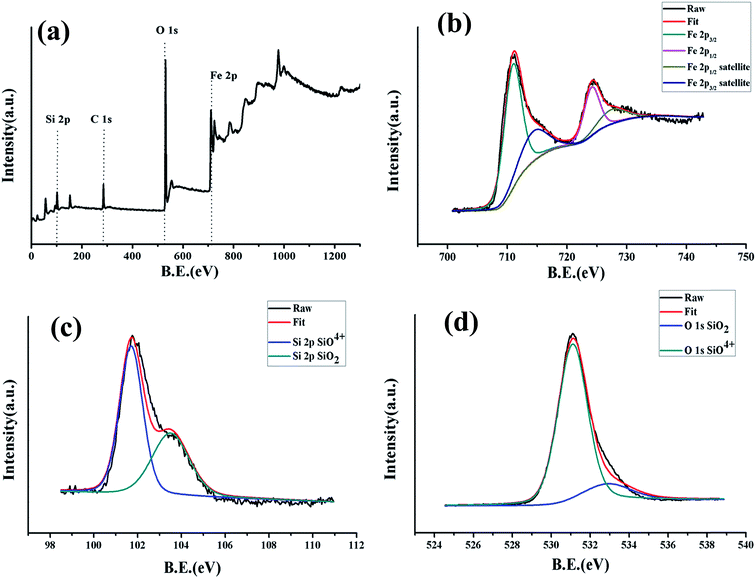 | ||
| Fig. 2 X-ray photoelectron spectroscopy (XPS) of fayalite: (a) wide-scan, (b) narrow-scan in the Fe 2p region, (c) narrow-scan in the Si 2p region and (d) narrow-scan in the O 1s region. | ||
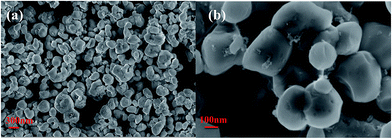
Unlike the greenish-brown or black color of bulk, natural fayalite,37 the color of as-synthesized nanofayalite is gray. The morphology of fayalite Fe2SiO4 was investigated using scanning electron microscopy (SEM). As shown in Fig. 3, the as-prepared product consists of sub-micron particles, the size of which range from 100 nm to 250 nm. Some particles aggregate to form large particles.
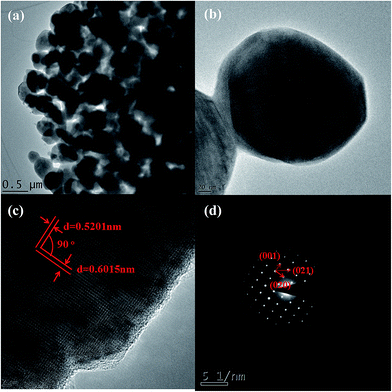
Further insight into the morphology and microstructure of Fe2SiO4 nanostructures was gained by using transmission electron microscopy (TEM), high-resolution transmission electron microscopy (HRTEM), and selected area electron diffraction (SAED). Characteristic TEM micrographs of the fayalite nanostructure at low and high magnification are shown in Fig. 4a and b, respectively. The images showed that all samples are made up of nanoparticles. The geometric shape of the particles is irregular. The surface of the particles is scraggly, due to hindering by neighboring particles. From Fig. 4b, we can see that the edge of the particles is thinner than the middle. A HRTEM image of an individual Fe2SiO4 particle is shown in Fig. 4c, which clearly reveals the highly crystalline nature of the Fe2SiO4 particles. As marked in Fig. 4c, the lattice fringes can be observed clearly. The spacing between lattice fringes with an angle of 90° are 0.6015 nm and 0.5201 nm, which is consistent with the (001) and (020) planes of orthorhombic Fe2SiO4. This point can be proved by the SAED pattern. As shown in Fig. 4d, the SAED pattern indicates that fayalite exhibited good crystallization behavior, and reveals a single crystal structure. By calculating the crystalline interplanar spacing and the angle between each other, we can confirm three crystal indices, just as the red arrows show, which can be indexed to orthorhombic fayalite Fe2SiO4, consistent with the XRD results. The elemental distribution of the as-prepared products was confirmed by energy dispersive X-ray spectroscopy (EDX). The relative ratio of metal to silicon was ∼1.8, as shown in the table in Fig. 5e. The actual value for the Fe2SiO4 particles could be less because of small amounts of amorphous silica produced by TEOS hydrolysis which were detected by EDX. The distribution of the components was analyzed by EDX mapping (Fig. 5a–d). Oxygen, silicon, and targeted metals were homogeneously dispersed in the particle structure.
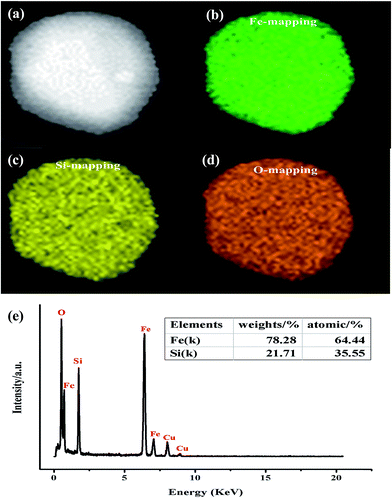 | ||
| Fig. 5 Elemental mapping images of Fe2SiO4 particles: (a) STEM image, (b) Co mapping, (c) Si mapping, (d) O mapping, and (e) representative EDX spectrum. | ||
Electrochemical performance
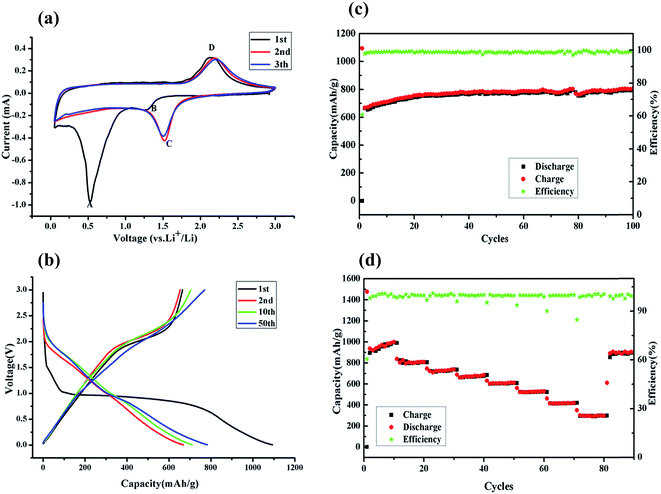
Cyclic voltammetry (CV) of the half cells was applied to explain the anodic and cathodic properties of the fayalite anode. As shown in Fig. 6a, two apparent peaks are observed at 1.30 V (B) and 0.50 V (A) in the first cathodic process. The weak and wide peak (B) at 1.30 V corresponds to lithium ion insertion into the lattice of fayalite, which is familiar to the iron oxides.38,39 The strong and prominent peak (A) at 0.5 V, which is present only in the first cathodic sweep, can be ascribed to the complete reduction of Fe2+ to Fe0 by Li and the generation of solid electrolyte interphase (SEI) film. In the subsequent cathodic sweeps, the profile showed a new and uniform current peak sitting at about 1.5 V (Fig. 6a, (C)), which can be attributed to conversion-type electrochemical reactions with lithium, and indicates that electrochemical reversibility of the electrodes is gradually established after the initial cycle, structure destruction and complete reorganization.40,41 Regarding the anodic sweep, only a wide peak (D) between 2.0–2.5 V can be observed. The peak (D) may contribute to the re-oxidation of the composed transition metals, iron in this instance, which is a good match with previous work on iron oxides.42,43 Peaks relating to the silicon reaction are rarely observed, which indicates that metal silicates react with lithium through a conversion reaction of transition metals and no silicon alloying reaction is observed, which was in good agreement with other transition metal silicates.44–46 Nonetheless, the common profiles of the cathodic and anodic sweep demonstrate high coherency and excellent reversibility after subsequent cycles.Fig. 6b shows the charge/discharge curves of the fayalite-based electrodes, for 1st, 2nd, 10th, and 50th cycle at a current density of 100 mA g−1 between 3.0 V and 0.005 V (vs. Li/Li+). In the first discharge cycle, the rather short plateau at 1.5 V and the extremely noteworthy plateau at 0.9–1.0 V are observed. Upon subsequent cycles, a considerably slanted plateau at about 2.1 V is seen, which agrees well with the cyclic voltammetry results. In the first cycle, high original discharge (lithiation) and charge (delithiation) specific capacities of approximately 1094.1 mA h g−1 and 664.9 mA h g−1 can be attained. This indicates that the initial coulombic efficiency of fayalite-based electrodes is 60.9% and the capacity loss is ∼429.2 mA h g−1. The capacity loss may result from the generation of a solid electrolyte interphase film and other irreversible processes, for instance, the emergence of Li2O and lithium trapped in the lattice, which can both be found in most common anode materials.47–49 As shown in Fig. 6b, after the first lithiation process, the charge/discharge curves for the 2nd, 10th, and 50th cycles become less and less distinct and the potential profiles of the charge and discharge process become more and more slanted on the graph. The measurement of the second discharge and charge process presented the capacities of 668.0 mA h g−1 and 653.7 mA h g−1 respectively. The coulombic efficiency reached approximately 100% quickly starting from the second cycle. Considering all of the described results and using the previous result of the lithium interaction mechanism of cobalt orthosilicate by in situ XRD and ex situ XPS and SEM as a reference,20 the following reaction mechanism for the reversible lithium storage of fayalite (Fe2SiO4) is proposed:
First discharge:
| Fe2SiO4 + 4Li+ + 4e− → 2Fe0 + Li4SiO4 | (1) |
Subsequent charge/discharge:
| xFe0 + Li4SiO4 ↔ 4Li+ + 4e− + FexSiOy | (2) |
Cycling stability is one of the most important factors for electrode materials, so the fayalite-based electrode was tested at 100 mA g−1 for 100 cycles to investigate its long-term performance. As shown in Fig. 6c, the capacity increased during the initial cycles, which may result from the growth of a polymer/gel-like film that can be formed and dissolved reversibly, is extremely sensitive to cycling voltage ranges with the best results obtained when the cells are fully discharged.50 This is also seen in other conversion-based materials.51,52 Fortunately, the fayalite-based electrode exhibited excellent cycle stability after the capacity stabilized. In addition, the specific capacity can reach to 800 mA h g−1, which is more than twice the theoretical capacity of graphite. What’s more, the coulombic efficiency is in close proximity to 100% after the first cycle. To further study the electrochemical properties of fayalite, the battery was cycled at various current densities ranging from 50 to 6400 mA g−1 between 3.0 V and 0.005 V (vs. Li/Li+), as shown in Fig. 6d. When cycled at 50 and 100 mA g−1, fayalite could deliver a stable charge capacity of 936 mA h g−1 and 800 mA h g−1, respectively. After that, the charge capacity slowly diminishes to 720, 664, 600, 520 mA h g−1 at current densities of 200, 400, 800, 1600 mA g−1. Even at a current density as high as 6400 mA g−1, the fayalite could still maintain a capacity of 300 mA h g−1. What’s more, when the current density was reduced to 100 mA g−1, a high reversible specific capacity of 880 mA h g−1 could be recovered, about 60% of the initial capacity. While the current density is restored to 100 mA g−1, compared with the former, the recovery capacity is much higher, which may be down to the formation of lithium silicate which improves lithium ion conductivity. The superior rate and cycle performance of fayalite may be attributed to two factors. On the one hand, in the fayalite crystal structure, the Fe–O octahedron shares its corners with Si–O tetrahedra to form hollow “tubes”, in which the lithium ion can move with smaller resistance. Hence, such a unique structure will accelerate the insertion and extraction speed of lithium ions. On the other hand, the existence of minor amounts of reduced Fe could benefit the electronic conductivity of fayalite; due to iron being a good electric conductor. Meanwhile, from previous work,53,54 we know that as a solid electrolyte, Li4SiO4 could enhance the ionic conductivity of electrode materials. Therefore, it can illustrate why the rate cycling performance of Fe2SiO4 is so excellent.
Conclusion
In summary, Fe2SiO4 particles have been triumphantly synthesized on a large scale using a simple method. Electrochemical measurements revealed that Fe2SiO4-based electrodes exhibit high reversible capacity, superior rate performance and long cycle life, which is superior to commercial graphite anodes. Furthermore, the O–Fe–O octahedron shares the corners with Si–O tetrahedra to form hollow “tubes”, which facilitate the insertion and extraction of lithium ions. Taking natural reserves and cost into consideration, Fe2SiO4 could hold huge hope in the development of low price and high performance secondary lithium ion batteries. Therefore, further study on the mechanism of lithium ion intercalation and de-intercalation process into the Fe2SiO4 crystal structure is in progress in our team, with the aim to promote the application of Fe2SiO4 as an anode material as soon as possible.Acknowledgements
This work was financially supported by the National Natural Science Foundation of China (11274392, U1401241).References
- J. Hassoun and B. Scrosati, J. Electrochem. Soc., 2015, 162, A2582–A2588 CrossRef CAS.
- R. Marom, S. F. Amalraj, N. Leifer, D. Jacob and D. Aurbach, J. Mater. Chem., 2011, 21, 9938–9954 RSC.
- B. Scrosati and J. Garche, J. Power Sources, 2010, 195, 2419–2430 CrossRef CAS.
- B. Scrosati, J. Hassoun and Y. K. Sun, Energy Environ. Sci., 2011, 4, 3287–3295 CAS.
- B. Scrosati, Electrochim. Acta, 2000, 45, 2461–2466 CrossRef CAS.
- O. K. Park, Y. Cho, S. Lee, H.-C. Yoo, H.-K. Song and J. Cho, Energy Environ. Sci., 2011, 4, 1621 CAS.
- J. M. Tarascon and M. Armand, Nature, 2001, 414, 359–367 CrossRef CAS PubMed.
- M. M. Thackeray, C. Wolverton and E. D. Isaacs, Energy Environ. Sci., 2012, 5, 7854 CAS.
- H. Kim, E.-J. Lee and Y.-K. Sun, Mater. Today, 2014, 17, 285–297 CrossRef CAS.
- W.-J. Zhang, J. Power Sources, 2011, 196, 13–24 CrossRef CAS.
- Y. Zhang, Y. Yan, X. Wang, G. Li, D. Deng, L. Jiang, C. Shu and C. Wang, Chem.–Eur. J., 2014, 20, 6126–6130 CrossRef CAS PubMed.
- W. Xiao, Z. Wang, H. Guo, X. Li, J. Wang, S. Huang and L. Gan, Appl. Surf. Sci., 2013, 266, 148–154 CrossRef CAS.
- J. Chen, L. Xu, W. Li and X. Gou, Adv. Mater., 2005, 17, 582–586 CrossRef CAS.
- X. Zhu, Y. Zhu, S. Murali, M. D. Stoller and R. S. Ruoff, ACS Nano, 2011, 5, 3333–3338 CrossRef CAS PubMed.
- L. Shen and C. Wang, Electrochim. Acta, 2014, 133, 16–22 CrossRef CAS.
- Y. Li, B. Tan and Y. Wu, Nano Lett., 2008, 8, 265–270 CrossRef CAS PubMed.
- F. Zhan, B. Geng and Y. Guo, Chemistry, 2009, 15, 6169–6174 CrossRef CAS PubMed.
- S. Y. Zhang, M. Lu, Y. Li, F. Sun, J. C. Yang and S. L. Wang, Mater. Lett., 2013, 100, 89–92 CrossRef CAS.
- S. Y. Zhang, L. L. Hou, M. H. Hou and H. J. Liang, Mater. Lett., 2015, 156, 82–85 CrossRef CAS.
- F. Mueller, D. Bresser, N. Minderjahn, J. Kalhoff, S. Menne, S. Krueger, M. Winter and S. Passerini, Dalton Trans., 2014, 43, 15013–15021 RSC.
- S. H. Yu, B. Quan, A. Jin, K. S. Lee, S. H. Kang, K. Kang, Y. Piao and Y. E. Sung, ACS Appl. Mater. Interfaces, 2015, 7, 25725–25732 CAS.
- X. Wei, C. Tang, X. Wang, L. Zhou, Q. Wei, M. Yan, J. Sheng, P. Hu, B. Wang and L. Mai, ACS Appl. Mater. Interfaces, 2015, 7, 26572–26578 CAS.
- A. E. Ringwood, Geochim. Cosmochim. Acta, 1958, 15, 18–29 CrossRef CAS.
- M. T. Deangelis, Am. Mineral., 2012, 97, 653–656 CrossRef CAS.
- V. Šepelák, M. Myndyk, M. Fabián, S. K. Da, A. Feldhoff, D. Menzel, M. Ghafari, H. Hahn, P. Heitjans and K. D. Becker, Chem. Commun., 2012, 48, 11121–11123 RSC.
- Q. Zhang, S. Ge, H. Xue, X. Wang, H. Sun and A. Li, RSC Adv., 2014, 4, 58260–58264 RSC.
- H. Fjellvåg, B. C. Hauback, T. Vogt and S. Stølen, Am. Mineral., 2002, 87, 347–349 CrossRef.
- R. C. Evans, An Introduction to Crystal Chemistry, The University Press, 1964 Search PubMed.
- H. Seyama and M. Soma, J. Electron Spectrosc. Relat. Phenom., 1987, 42, 97–101 CrossRef CAS.
- T. Yamashita and P. Hayes, Appl. Surf. Sci., 2008, 254, 2441–2449 CrossRef CAS.
- J. Schott and R. A. Berner, Geochim. Cosmochim. Acta, 1983, 47, 2233–2240 CrossRef CAS.
- K. Hirokawa and M. Oku, Talanta, 1979, 26, 855–859 CrossRef CAS PubMed.
- R. A. Berner and J. Schott, Am. J. Sci., 1982, 282, 1214–1231 CrossRef CAS.
- A. Alaoui Mouayd, A. Koltsov, E. Sutter and B. Tribollet, Mater. Chem. Phys., 2014, 143, 996–1004 CrossRef CAS.
- C. D. Wagner, D. E. Passoja, H. F. Hillery, T. G. Kinisky, H. A. Six, W. T. Jansen and J. A. Taylor, J. Vac. Sci. Technol., 1982, 21, 933–944 CrossRef CAS.
- T. Ahmad, O. Mamat, R. Ahmad and A. N. Malik, in Defect and Diffusion Forum, 2013 Search PubMed.
- R. M. Hnzrnr, Am. Mineral., 1977, 286–295 Search PubMed.
- S. Jin, H. Deng, D. Long, X. Liu, L. Zhan, X. Liang, W. Qiao and L. Ling, J. Power Sources, 2011, 196, 3887–3893 CrossRef CAS.
- L. Wang, Y. Yu, P. C. Chen, D. W. Zhang and C. H. Chen, J. Power Sources, 2008, 183, 717–723 CrossRef CAS.
- D. Bresser, E. Paillard, R. Kloepsch, S. Krueger, M. Fiedler, R. Schmitz, D. Baither, M. Winter and S. Passerini, Adv. Energy Mater., 2013, 3, 513–523 CrossRef CAS.
- N. S. Spinner, A. Palmieri, N. Beauregard, L. Zhang, J. Campanella and W. E. Mustain, J. Power Sources, 2015, 276, 46–53 CrossRef CAS.
- J. Luo, J. Liu, Z. Zeng, C. F. Ng, L. Ma, H. Zhang, J. Lin, Z. Shen and H. J. Fan, Nano Lett., 2013, 13, 6136–6143 CrossRef CAS PubMed.
- J. M. Jeong, B. G. Choi, S. C. Lee, K. G. Lee, S. J. Chang, Y. K. Han, Y. B. Lee, H. U. Lee, S. Kwon, G. Lee, C.-S. Lee and Y. S. Huh, Adv. Mater., 2013, 25(43), 6250–6255 Search PubMed.
- S. Zhang, L. Ren and S. Peng, CrystEngComm, 2014, 16, 6195–6202 RSC.
- Y. Y. Wang, T. Li, Y. X. Qi, R. L. Bai, L. W. Yin, H. Li, N. Lun and Y. J. Bai, Electrochim. Acta, 2015, 186, 572–578 CrossRef CAS.
- C. X. Gui, Q. Q. Wang, S. M. Hao, J. Qu, P. P. Huang, C. Y. Cao, W. G. Song and Z. Z. Yu, ACS Appl. Mater. Interfaces, 2014, 6, 14653–14659 CAS.
- X. Junming, W. Jinsong, L. Langli, C. Xinqi, Q. Huibin, V. Dravid, M. Shaobo and J. Chunlin, J. Power Sources, 2015, 274, 816–822 CrossRef.
- D. Yucheng, X. Yang, C. Ying-San, C. Chenwei and J. A. Zapien, J. Power Sources, 2015, 275, 769–776 CrossRef.
- K. Palanisamy, K. Yunok, K. Hansu, K. Ji Man and Y. Won-Sub, J. Power Sources, 2015, 275, 351–361 CrossRef CAS.
- S. Laruelle, S. Grugeon, P. Poizot, M. Dollé, L. Dupont, J. M. Tarascon, S. Laruelle and J. M. Tarascon, J. Electrochem. Soc., 2002, 149, A627–A634 CrossRef CAS.
- E. L. Ji, S. H. Yu, J. L. Dong, D. C. Lee, S. I. Han, Y. E. Sung and T. Hyeon, Energy Environ. Sci., 2012, 5, 9528–9533 Search PubMed.
- G. Zhou, D. W. Wang, F. Li, L. Zhang, N. Li, Z. S. Wu, L. Wen, G. Q. Lu and H. M. Cheng, Chem. Mater., 2010, 22, 5306–5313 CrossRef CAS.
- C. H. Doh, A. Veluchamy, M. W. Oh and B. C. Han, J. Electrochem. Sci. Technol., 2011, 2, 146–151 CrossRef CAS.
- A. Nakagawa, N. Kuwata, Y. Matsuda and J. Kawamura, J. Phys. Soc. Jpn., 2010, 79, 98–101 CrossRef.
| This journal is © The Royal Society of Chemistry 2017 |

