DOI:
10.1039/C6RA26273B
(Paper)
RSC Adv., 2017,
7, 5669-5678
Impregnation of zinc oxide modified clay over alginate beads: a novel material for the effective removal of congo red from wastewater
Received
3rd November 2016
, Accepted 26th December 2016
First published on 17th January 2017
Abstract
Alginate hydrogel beads were impregnated with zinc oxide (ZnO) modified sepiolite clay and applied for the removal of congo red (CR) dye from its aqueous solution in batch and packed column systems. After the synthesis, the beads were characterised by FTIR, XRD, and SEM which revealed the surface structures as well as forces of interaction between the beads and the dye leading to the adsorption process. Batch equilibrium data were subjected to Freundlich, Langmuir, Temkin and Dubinin–Radushkevich (D–R) isotherm models. The experimental data were best fitted to the Temkin isotherm with R2 > 0.995, a maximum adsorption capacity (Qmax) of 546.89 mg g−1 was obtained from the Langmuir model and an average RL value of 0.58 suggested a favourable adsorption. Kinetic data were analysed with pseudo first-order, pseudo second-order, and Elovich kinetic models. The pseudo first-order model fitted best the data with a coefficient of determination, R2 of 0.997 and statistical errors (% SSE) of less than 1%. An intraparticle diffusion model showed that the adsorption process develops in stages, as rapid, moderate and slow phases. Data from packed column adsorption were subjected to Clark, Thomas, Adams–Bohart and Yoon–Nelson models. The continuous flow process showed a flow rate, column height and concentration dependent breakthrough curves with the Yoon–Nelson model as the best fit of all the models giving R2 of 0.999 and % SSE of less than 0.1%. The synthesized material was confirmed by characterization to have surfaces and functional groups suitable for adsorption, the adsorption capacity is comparably high with other synthetic materials.
Introduction
Technological advancement with its accompanying industrialization and urbanization had led to increased degradation of the environment, especially the aquatic environment, through the discharge of industrial and domestic waste. Water aquifers receive between 10 and 15% of over 7 × 10⁵ tons of dyes produced worldwide annually,1 owing to the fact that dyes are the most versatile chemicals widely applied in pharmaceuticals, rubbers, pesticides, varnishes, dyestuffs and textiles. These industries utilize large quantities of a number of dyes with residues leading to a large amount of coloured, toxic and even carcinogenic wastewaters. Dye pollution leads to a reduction of dissolved oxygen required by aquatic life, they are resistant to light and moderate oxidative agents thereby posing a serious hazard to aquatic living organisms.2 Effluents containing synthetic dyes with complex aromatic molecular structures are recalcitrant with attendant inhibitory nature and hence cannot be treated by conventional wastewater treatment methods.3 Congo red (CR) is a sodium salt of 3,3′-([1,1′-biphenyl]-4,4′-diyl)bis(4-aminonaphthalene-1-sulfonic acid). It is a benzidine based anionic dye widely used in textiles, printing and dyeing paper, rubber, plastics industry etc. When discharged into the environment, CR metabolizes to benzidine, a known human carcinogen.4 Therefore, it is crucial to remove CR from wastewater and effluents before discharged into water body.
Conventional technologies such as liquid–liquid extraction, membrane filtration, and adsorption have been used for the separation of dyes from wastewater. Of all these methods, adsorption is the most widely used method owing to its distinct advantages such; simplicity, high efficiency energy-saving, broad operational range of pH and temperature, easy reclamation of the contaminant and easy recycling of the adsorbent as well as lower cost of application including selectivity even at low contaminant concentrations.5 As a result of the preference of adsorption techniques over other methods, there is a need to search for more effective adsorbents, since the water treatment industry requires ecofriendly, highly effective and reusable adsorbents in tonnage quantities.
Sepiolite clays attract attention in adsorption studies due to their fibrous structure formed as a result of the oxide layers which confers canal and cavities required for high sorption capacity with potential to retain micro-pollutants like heavy metals and dyes.6,7 Sepiolite has been employed to remove of fluoroquinolone,8 cationic and anionic azo dyes from aqueous solution9 as well as chromium and lead10 from waste water effluents. However, while going for large scale treatment these nano materials are difficult to isolate from the aqueous solution after adsorption.11 To overcome this problem, the nano materials can be incorporated into the three dimensional networks which can be easily isolated using sieves after batch adsorption or they can be used in a continuous fixed bed system.
Hydrogels are cross linked three dimensional polymer network structures, their high adsorption capacities, regeneration limits and reusability have made them a promising adsorbent in wastewater treatment.12 Biopolymer/clay nanocomposites have attracted much attention, owing to their biocompatibility, biodegradability of the biopolymer matrix and property enhancements resulting from highly dispersed silicate layers.13 A critical issue for the adsorption is that of the fouling formation, from technical and economic point of view, ZnO nanoparticle when incorporated into the adsorbent enhances the physical and chemical properties, such as high catalytic activity and antifouling capabilities also it modifies the surface of the anionic sepiolite.14 Application of natural polymers for adsorption has also been advocated, due to their extensive sources, non-toxic and easy degradation.15 However, literatures on the use of hydrogel beads prepared using metal oxide modified clay/biopolymers are very scarce, hence, this study investigated adsorption of congo red dye (CR) from aqueous solution in batch and packed column system, using zinc oxide modified sepiolite alginate beads. The kinetics and equilibrium parameters for the adsorption in batch were studied. The packed column adsorption study helped to determine a suitable reactor for scale-up of the process. The reusability of the sorbent framework was determined by running five cycles of adsorption/desorption.
Materials and methods
Materials
Sepiolite clay, zinc acetate, Sodium Alginate (SA) and calcium nitrate (AR grade) were products of Sigma Aldrich were used without further purification. All other reagents were of analytical grade and MilliQ water was used for all of the experiments.
Preparation of ZnO–clay nanocomposites
About 5 grams of sepiolite clay was washed several times with MilliQ water and acid treated with conc. HCl for 4 hours, then washed several times with MilliQ water to make final pH neutral. In situ embedment of ZnO into the sepiolite was by soaking the washed sepiolite in a solution of Zn Acetate and glucose (1 mM, 3![[thin space (1/6-em)]](https://www.rsc.org/images/entities/char_2009.gif) :
:![[thin space (1/6-em)]](https://www.rsc.org/images/entities/char_2009.gif) 1) with continuous stirring at 80 °C for 30 min and thereafter calcinated at 600 °C for 1 h.
1) with continuous stirring at 80 °C for 30 min and thereafter calcinated at 600 °C for 1 h.
Preparation of ZnO–clay–alginate hydrogel beads
The ZnO modified clay–alginate beads were synthesized according to the schematic diagram in Fig. 1. Accurately weighed 1.0 g of sodium alginate was dispersed in 30 mL of MilliQ water at 40 °C and 1.3 g of dispersed ZnO embedded clay was added slowly into the solution of sodium alginate, the mixture was further stirred for 1 hour to ensure homogeneity. Composite beads was prepared by slowly dropping of ZnO–clay–alginate homogeneous mixture into 500 mL of 6% Ca(NO3)2·4H2O solution at 25 °C with mild stirring (50 rpm). The pH of the system was maintained in the range of 10.3 to 10.5 using aqueous solution of NH3. Hydrogel beads formed were further crosslinked for 16 h to facilitate the in situ growth of ZnO–clay–alginate hydrogel beads. The beads were washed and dried at 30 °C for 48 h and the nanocomposite beads were used for adsorption studies.
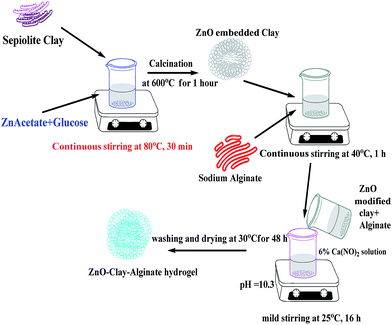 |
| | Fig. 1 Schematic representation of zinc oxide modified clay–alginate beads formation characterization of the adsorbent. | |
The dried material was characterized by different physicochemical techniques. Surface morphology and elemental composition of the material was analysed using scanning electron microscopy (SEM) [VEGA3 TESCAN] and field emission scanning electron microscopy (FESEM) [Bruker, Germany] at 10 kV accelerating voltage. Digital photographs of the hydrogel beads were recorded for size comparison, X-ray diffraction (XRD) data were collected using a PAN Analytical X'Pert PRO X-ray diffractometer with Cu Kα radiation (λ = 1.5418 Å). Fourier transform infrared (FT-IR) spectra were recorded from 400 to 4000 cm−1 in TENSOR 27 spectrometer (Bruker, Germany) using KBr pellet technique. Stability tests were carried out on the beads using zeta potential and determination of Zn ion released when the particle hydrogel is soaked in water for between 24 and 48 hours were determined using Atomic Absorption Spectroscopy techniques.
Dye solution preparation
Congo red (CR) is a sodium salt of 3,3′-([1,1′-biphenyl]-4,4′-diyl)bis(4-aminonaphthalene-1-sulfonic acid) a direct red 28; 573-58-0, was a product of Central Drug House, Delhi, India. 1000 mg L−1 aqueous solution of CR dye was prepared with de-ionized water as the stock solution and was further diluted with de-ionized water to obtain the working standard solutions. The pH of the solution was adjusted when necessary with aliquots of HCl and NaOH (1.0 mol L−1) before the commencement of the experiment.
The adsorption experiments were conducted by contacting different concentrations of CR (50, 75, 100, 150 and 200 mg L−1) in 200 mL flask with predetermined amount of the hydrogel beads. The flasks were set on a thermostated shaker at 30 ± 1 °C with agitation speed of 100 rpm. HCl and NaOH (Merck) were used to adjust the pH of the solution. The samples were collected at time intervals of 0, 5, 10, 15, 30, 60 and 120 min and the adsorbent was separated by filtration. The concentrations of the dye in the solutions were estimated using spectrophotometer (UV-VIS-NIR VARIAN 500 Scan CARY). The amounts of dye removed at time t, Qt (mg g−1) and those removed at equilibrium Qe (mg g−1) were calculated using eqn (1) and (2) below:
| |
 | (1) |
| |
 | (2) |
where
Co (mg L
−1) is the initial concentration and
Ct (mg L
−1) is the concentration of the dye at time
t in the liquid-phase.
Ce (mg L
−1) is the concentration of the dye at equilibrium in the liquid-phase
V is the volume of the solution (L), and
W is the mass of adsorbent. In order to investigate the mechanisms of the adsorption process, pseudo-first order, pseudo-second order, Elovich kinetic and intraparticle diffusion models (
eqn (3)–(6)) were applied to describe the kinetics of adsorption of CR to ZnO–clay–alginate hydrogel beads.
| |
 | (4) |
| |
Qt = 1/βel![[thin space (1/6-em)]](https://www.rsc.org/images/entities/char_2009.gif) ln(αβel × t) ln(αβel × t)
| (5) |
where
Qe is the amount of CR in mg g
−1 adsorbed at equilibrium while
k1, and
k2 are the rate constant,
Kdi is intraparticle diffusion constant and
Ci measures the thickness of the layer. The Elovich parameters
α and
βel are initial adsorption rate (mg g
−1 min
−1) and the desorption constant (g mg
−1).
16
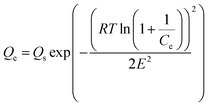
Similarly, the equilibrium data from the adsorption studies were subjected to the Langmuir, Freundlich, Temkin and Dubinin–Radushkevic isotherms models (represented by eqn (7) to (10)). For Langmuir equation, Qo and b are the constants related to the adsorption capacity and energy of adsorption, respectively. The separation factor (RL) as given by the expression:
 is also estimated (Co (mg L−1) is the initial concentration of the dye), values of RL between 0 and 1 represents favourable adsorption, RL > 1 suggests unfavourable adsorption and RL = 0 stands for irreversible process. The KF and n of Freundlich isotherm model are isotherm parameters characterizing adsorption capacity and intensity, respectively. Whereas the Temkin isotherm constants aT and bT, K are equilibrium binding constant (L g−1), heat of adsorption (J mol−1), E represents the energy of adsorption in Dubinin–Radushkevic (D–R) isotherm model. R is the gas constant (8.314 × 10⁻³ kJ K−1 mol−1) and T is the absolute temperature (K).16
| |
 | (7) |
| |
 | (9) |
| |
 | (10) |
Continuous flow adsorption studies
Continuous flow adsorption experiments in a packed column were carried out using a glass column diameter 1.5 cm and length 40 cm. The schematic diagram for the adsorption process is as shown in Fig. 2. The column was packed ZnO–clay–alginate beads (200 mg). CR solution of known concentration was pumped to the column in a down-flow direction by a peristaltic pump at 2, 4 or 6 mL min−1, respectively. Samples were collected at regular intervals from the sampling point and the concentration of CR in the effluent was determined as described above. The effect of column height was investigated by repeating the experiment at the column height of 10 cm (150 mg), 15 cm (225 mg), 20 cm (300 mg), CR concentration of 100 mg L−1 and flow rate 2 mL min−1, the effect of CR concentration was studied by repeating the experiment at 100, 200 and 300 mg L−1 with packed column height of 10 cm and flow rate 2 mL min−1. The adsorption data from the packed column experiments were subjected to the Adams–Bohart, Thomas, and Yoon–Nelson column adsorption models. These models are represented by eqn (11) to (14).| |
 | (11) |
| |
 | (12) |
| |
 | (13) |
| |
 | (14) |
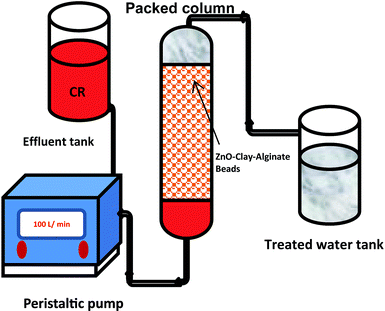 |
| | Fig. 2 Schematic representation of column adsorption. | |
Statistical test
The acceptability and hence the best fit of the data obtained were based on the square of the correlation coefficients R2 and the percentage error function which measures the differences (% SSE) in the experimental data and the values predicted by the models. The validity of each model was determined by the sum of error squares (SSE, %) given by:| |
 | (15) |
N is the number of data points. The higher is the value of R2 and the lower the value of % SSE; the better fitted the data. A model is adjudged best-fit and selected based on statistical parameters. Non-linear regression analysis method using a program written on Micro Math Scientist software (Salt Lake City, Utah) was used to obtain the least square fit for all the models.
Regeneration of the adsorbent
For the batch regeneration experiments, CR desorption was first carried out with 0.1 M HCl for 12 hours. Then, the hydrogel beads were washed with deionized water and finally put into 3% NaOH solution and kept for another 24 hours. After that, the regenerated hydrogel beads were obtained.
Results and discussion
Characterizations
Surface morphological analysis of the ZnO, sepiolite–Alginate and synthesised ZnO–clay–alginate hydrogel are presented in Fig. 3a–d. The SEM analysis of ZnO nanoparticles (Fig. 3a) showed a fine particle with approximate spherical shape displaying some kind of faceting. The surface morphology of clay–alginate nanocomposite in Fig. 3b showed a characteristic rough and undulating surfaces alginate in the fibrous structure of the sepiolite clay. Incorporation of ZnO into the clay–alginate system resulted in morphology change as shown Fig. 3(a and b), which resulted in the composite with rough, undulating and folding on the surface which effectively increases the surface area available for dye adsorption. Fig. 3(e and f) are the digital photograph of the resulting hydrogel, it shows the spherical morphology of composite beads in both wet and dry stage, shrinkage is due to the loss of water upon drying.
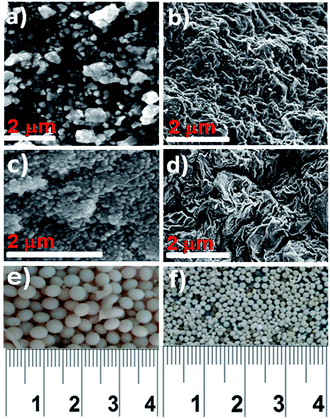 |
| | Fig. 3 SEM images of (a) ZnO nanoparticle (b) clay–alginate nanocomposite (c and d) synthesized ZnO–clay–alginate beads. (e and f) Digital Photograph of synthesized ZnO–clay–alginate dry composite beads. | |
The X-ray diffraction patterns of the powder samples were collected by X'Pert High Score Philips Analytical Diffractometer equipped with a Cu anticathode (λ Cu Kα anticathode = 0.154056 nm). Fig. 4 shows the XRD spectra of ZnO, sepiolite–alginate and synthesised ZnO–clay–alginate hydrogel (before and after adsorption). The line broadening of the peaks in Fig. 4a is a clear indication of crystalline ZnO with predominant wurtzite phase. When compared, the XRD peaks of clay–alginate (Fig. 4b) showed shift to a lower angle upon incorporation of ZnO, i.e. Fig. 4c. This is an indication of further intercalation of the clay structure. The nanoparticle showed amorphous broad peak due to alginate at 22.6° due to alginate. Characteristic peaks of ZnO at 20.46, 34.3, 39.9, 57.9, 61.3, and 67.8° were present in the spectra. Upon adsorption of dye, the peak 20.46 disappeared possibly due to the effect of the dye on the surface structure. The peak positions of sepiolite are matched with JCPDS card no. 00-013-1059 which confirms the formation of zinc oxide modified sepiolite–alginate beads.
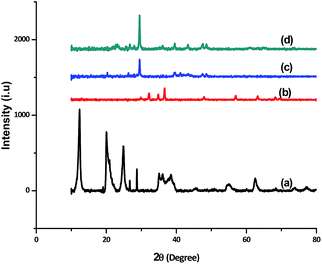 |
| | Fig. 4 XRD patterns of (a) ZnO nanoparticle (b) clay–alginate nanocomposite (c and d) synthesized ZnO–clay–alginate beads before and after adsorption. | |
The FTIR spectra of ZnO, sepiolite–Alginate and synthesised ZnO–clay–alginate hydrogel (before and after adsorption) are shown in the Fig. 5. FTIR spectra of ZnO is shown in Fig. 5a, the characteristic peak at 3506.46 cm−1 could be attributed to O–H stretching, peak at 468.6 cm−1 is associated with to Zn–O and the peak at 912 cm−1 belongs to Zn–O–H. Fig. 5b displayed the FTIR of the clay–alginate. Apart from the O–H stretching peaks at 3442.03 cm−1 other peaks can be assigned thus: the peak at 1035.7 cm−1 may be due to the Si–O–Si stretch of the clay on the alginate while those at 1634, 1429 and 1383 cm−1 can be assigned to COO– asymmetric and symmetric stretching. FTIR of ZnO–clay–alginate before and after adsorption are shown in Fig. 5c and d respectively. The peaks at 940 cm−1 is related to Zn–O–H stretching while that at 822 cm−1 is assigned to Si–O stretching. After adsorption there is considerable shift in the position of these peaks which is a clear indication of physicochemical interactions between the dye molecules and adsorbent particles.
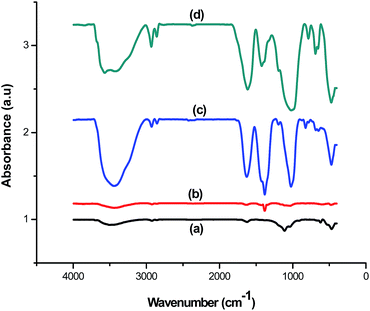 |
| | Fig. 5 FTIR spectra of (a) ZnO (b) clay–alginate (c and d) ZnO, clay and modified ZnO–clay–alginate beads before and after adsorption. | |
Fig. 6 shows the variation of zeta potentials with the pH. The negative value obtained at all pH range may be attributed to the presence of alumina and silica in the sepiolite. Variation of zeta potential in the acidic medium may be attributed to change in surface pH and variation in basic medium may be attributed to binding of cations. According to ASTMD-4187 classification that zeta potential of slurry within +30 and −30 mV is perfect, the highest negative value of −15.38 mV obtained for this study indicates that the hydrogel is highly stable. The filtrate obtained after 24 and 48 hours respectively shows that Zn ion is below detection limit, confirming that ZnO bound strongly to the sepiolite clay.
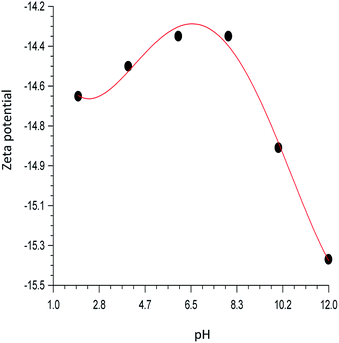 |
| | Fig. 6 pH dependent of zeta potentials of ZnO–clay–alginate beads. | |
Batch adsorption kinetics and mechanism studies
The kinetics of adsorption of CR on ZnO–clay–alginate beads was studied with the aim of determining the optimum operational conditions for full-scale processes. The parameters from kinetic study include the rate constants (criteria for efficiency) and mechanism of adsorption. The plots of four different kinetic models used to explain the adsorption of CR on ZnO–clay–alginate beads are shown in Fig. 7a–d. The figures show the variation of the quantity of dye adsorbed (Qt) with time. From the figures there is an initial increase in the adsorption rate, which takes place in about first 15 minutes of the experiment and become slower with time and flattened out at equilibrium. The increase initial rate may be due to the presence of empty sites, which are occupied as the adsorption progressed and become saturated at equilibrium. Fig. 7a–d were obtained from the kinetic models given by the eqn (3)–(6) respectively. From the kinetic parameters for the adsorption process shown in Table 1. The first order kinetic model (Fig. 7a) best fitted the kinetic data with average value of R2 > 0.99, the values of Qe obtained (Qe calc) is consistent with the experimental values (Qe exp) when compared with the second order (Fig. 7b) parameters. The Elovich model otherwise known as Chemisorption model (Fig. 7c) is used to distinguish the chemisorption process from physisorption process. From Table 1, the values of α (adsorption rate) increases with increase concentration, this is due to increase the concentration gradient across the surface. The decrease in the desorption rate (β) is an indication of chemical bond between the dye and functional groups at the bead surface, the values of R2 > 0.9 suggested a chemisorption process. The intraparticulate diffusion model was used to investigate the mechanism of the adsorption of CR to ZnO–clay–alginate beads. The intraparticle diffusion mechanism (Fig. 7d) showed three stages of adsorption with Kdi showing a relative increasing as the initial concentration of the dye increases. This could be attributed to the resistance of the surface boundary to the increase driving force with the concentration gradient as the dye molecules access the available sites in the hydrogel. The value of the intercepts Ci showed that the stages of adsorption are not characterised by only intraparticle diffusion but external mass transfer also played a significant role.17
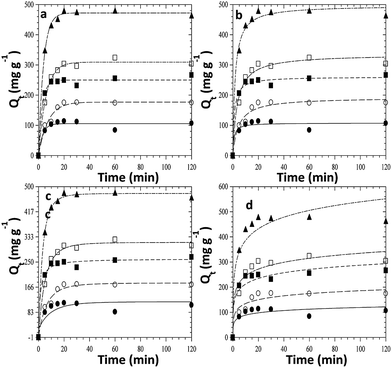 |
| | Fig. 7 Kinetic fits for the adsorption of congo red dye on ZnO–clay–alginate (a) pseudo-first order model fits (b) pseudo-second order model fits (c) intraparticle diffusion (d) Elovich kinetic model fits. | |
Table 1 Kinetic parameters for the adsorption of CR on ZnO–clay–alginate beads
| |
Co (mg L−1) |
50 |
75 |
100 |
150 |
200 |
| Pseudo first order |
Ce (mg L−1) |
4.08 |
7.30 |
10.89 |
19.57 |
22.98 |
| Qe(Exp) (mg g−1) |
106.4 |
174.6 |
266.0 |
303.7 |
463.9 |
| Qe(calc) (mg g−1) |
105.4 |
176.9 |
249.9 |
309.4 |
472.2 |
| k1 (min−1) |
0.32 |
0.14 |
0.35 |
0.17 |
0.26 |
| R2 |
0.992 |
0.996 |
0.998 |
0.999 |
0.999 |
| % SSE |
0.001 |
0.002 |
0.009 |
0.003 |
0.003 |
| Pseudo second order |
Qe(calc) (mg g−1) |
107.6 |
192.4 |
260.7 |
335.3 |
497.0 |
| k2 × 10−2 (g mg−1 min−1) |
1.01 |
0.12 |
0.33 |
0.09 |
0.11 |
| R2 |
0.989 |
0.993 |
0.998 |
0.997 |
0.999 |
| % SSE |
0.002 |
0.015 |
0.003 |
0.015 |
0.010 |
| Elovich |
α × 10−3 (mg (g min)−1) |
1.21 |
0.93 |
2.56 |
2.06 |
2.59 |
| β × 103 (g mg−1) |
7.75 |
4.48 |
3.14 |
2.56 |
1.55 |
| R2 |
0.975 |
0.987 |
0.993 |
0.991 |
0.990 |
| Intraparticulate diffusion |
K1d (mg g−1 min−0.5) |
56.57 |
72.88 |
130.3 |
141.0 |
234.6 |
| C1 (mg g−1) |
−0.28 |
−3.00 |
2.88 |
−5.87 |
0.57 |
| R2 |
0.999 |
0.987 |
0.998 |
0.993 |
0.999 |
| K2d (mg g−1 min−0.5) |
32.37 |
192.2 |
14.84 |
132.7 |
141.40 |
| C2 (mg g−1) |
45.74 |
−227.0 |
217.0 |
21.93 |
178.0 |
| R2 |
0.999 |
0.999 |
0.999 |
0.999 |
0.999 |
| K3d (mg g−1 min−0.5) |
2.05 |
12.62 |
9.58 |
43.61 |
24.20 |
| C3 (mg g−1) |
107.5 |
141.8 |
223.1 |
200.7 |
415.9 |
| R2 |
0.999 |
0.999 |
0.999 |
0.999 |
0.999 |
Comparisons of adsorption capacity of ZnO–clay–alginate with its precursors were study to justify its preference. Adsorption capacity of CR dye by ZnO, clay–alginate and ZnO–clay–alginate are presented in Fig. 8 below. This figure showed that the adsorption capacity of ZnO–clay–alginate bead (Fig. 8a) is about 10 fold of that of ZnO (Fig. 8a) and about 5 fold of that clay–alginate.
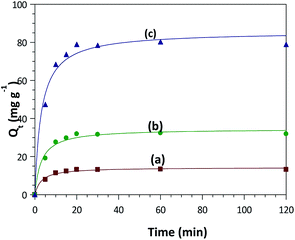 |
| | Fig. 8 Adsorption capacity of congo red dye by (a) ZnO (b) ZnO–clay (c) ZnO–clay–alginate. | |
Adsorption by may be due to the physical interaction between the adsorbent particles and some chemical functional groups on the dye forming bonding with oxygen on the ZnO, when compared with sepiolite–alginate beads with improved structures and functional groups which afford more capacity to interact physically and chemically with the dye molecules. The higher capacity noted in the ZnO–clay–alginate beads may be attributed to the increase intercalation of the of the clay structure by the presence of the ZnO, which increase its porosity and expose more functional groups for the beads–dye interaction. In addition to this, the presence of alginate also confers surface modification by increasing the functional groups. The characteristics surface roughness and undulation brought about by the alginate also increase the surface roughness and consequently the surface area of the beads.
Desorption studies
The adsorption–desorption cycles were studied for economic viability of the adsorbent. Fig. 9 showed the percentage CR-desorption of CR from ZnO–clay–alginate beads. Desorption efficiency of 99 to 98.0% was obtained in the first three cycle. A reduction of the efficiency to 94.2% at the sixth cycles is a clear indication that the adsorbent could be used and reused long time. Also the higher efficiency upon reuse suggests recyclability and that acidic medium is very suitable in the extraction of the CR from the spent adsorbent.
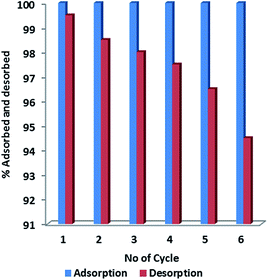 |
| | Fig. 9 Adsorption–desorption studies of CR on ZnO–clay–alginate hydrogel beads. | |
Adsorption isotherms
The adsorption isotherm is a theoretical expression that relates the amount of a substance adsorbed into the solid phase of adsorbent to the concentration of the substance in bulk solution at a particular temperature in equilibrium. The plots of four different isotherm models used to explain the adsorption of CR on ZnO–clay–alginate beads are shown Fig. 10a–d using eqn (7) to (10). The plots of four isotherm fits obtained from adsorption model are shown in Fig. 10 while the parameters obtained from the model fits are shown in Table 2. The Langmuir isotherm fit which proposed a monolayer adsorption on surfaces with identically homogeneous sites give the fit in Fig. 10a. It obvious from the plot that the adsorption capacity increases initially, owing to the presence of active sites which got saturated as the dye concentration increases. Maximum adsorption capacity of Qmax of 546.89 mg g−1 was obtained which shows that the adsorbent compete favourably with others in the same category as shown in Table 3. The RL of 0.58 shows that the adsorption process is favourable with high monolayer adsorption efficiency.22 Fig. 10b is the Freundlich isotherm fit, the KF and 1/n are appropriate parameters showing the characteristic of the sorbate–sorbent system. 1/n also represents adsorption strength, the smaller the value the higher the strength. The 1/n value of 0.584 coupled with R2 > 0.9 shows that the adsorption of CR on ZnO–clay–alginate bead is favourable. Temkin model was used to obtain Fig. 10c, with the parameter shown in Table 2. The isotherm takes into account the energy decrease as the adsorption progress uniformly at the surface. The maximum binding energy adsorption energy obtained from Temkin isotherm indicates a favourable adsorption process. Dubinin–Radushkevich model was used to obtain Fig. 10d with its corresponding parameters in Table 2. The theoretical saturation capacity, Qs, of 316.12 mg g−1 is less than the maximum adsorption capacity. The maximum adsorption energy E of 0.34 kJ mol−1 obtained is an indication of physisorption dominated process.
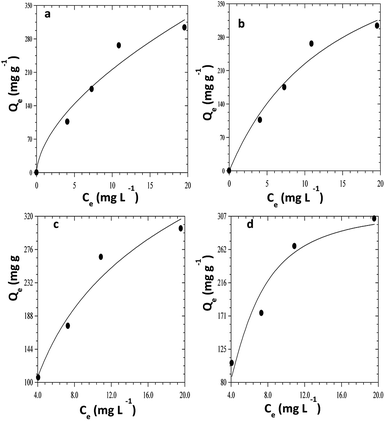 |
| | Fig. 10 Isothermal fits for the adsorption of congo red dye on ZnO–clay–alginate beads (a) Freundlich isotherm model fits (b) Langmuir Isotherm model (c) Temkin model fits (d) Dubinin–Radushkevich model fits. | |
Table 2 Isotherm parameters for the adsorption of CR on ZnO–clay–alginate beads
| Langmuir |
Freundlich |
Temkin |
Dubinin–Radushkevich |
| Qmax (mg g−1) |
546.9 |
KF (mg g−1 (mg L−1)−1/n) |
56.14 |
BT (L g−1) |
18.77 |
Qmax (mg g−1) |
316.1 |
| b × 102 (L mg−1) |
6.95 |
1/n |
0.584 |
AT (J mol−1g mg−1) |
0.56 |
E (kJ mol−1) |
0.34 |
| RL |
0.58 |
R2 |
0.989 |
R2 |
0.995 |
|
0.994 |
| R2 |
0.993 |
|
|
|
|
|
|
Table 3 Comparison of the adsorption capacity of ZnO–clay–alginate for CR with other related adsorbent
| Material |
Adsorption capacity (g mg−1) |
Reference |
| ZnO–polypyrole |
38.00 |
18 |
| ZnO–ZnFeO4–polypyrole |
74.00 |
18 |
| ZnO nanoparticle |
24.00 |
18 |
| Attapulgite |
189.00 |
19 |
| Kaolin |
5.94 |
19 |
| CTAB–kaolin |
24.46 |
20 |
| Chitosan–alginate |
121.95 |
21 |
| ZnO–clay–alginate |
546.89 |
This study |
Column sorption studies
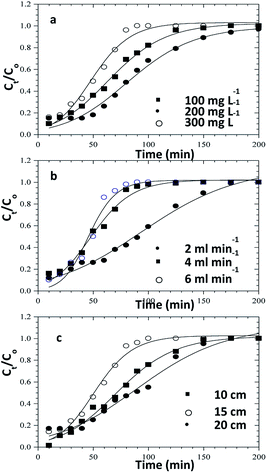
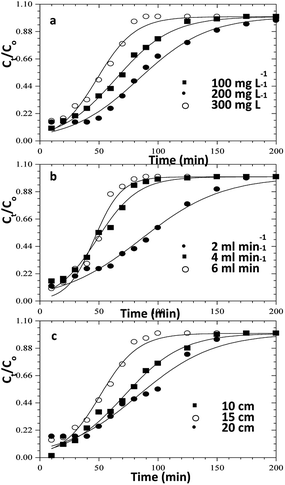
In order to understand the adsorption behaviour of CR on ZnO–clay–alginate beads in a fixed-bed column and in preparation for scale up for industrial applications, four kinetic models, Adams–Bohart, Yoon–Nelson, Clark, and Thomas were used to obtain the kinetic model in column and to estimate breakthrough curves. Clark model fits for the column adsorption is shown in Fig. 11a–c, as shown in Table 4, increase in both flow rate and initial dye concentration, the values of A and r also increase with R2 > 0.99. Fig. 13 is Thomas model fits for the column adsorption study, according to Table 5 there is increase in equilibrium adsorption qe with increase concentration flow rate and column height. The adsorption isotherm fitted well with R2 > 0.99. Taking into consideration the values of kTH with increase flow rate, it could be observed that high flow rate and increase concentration will favour the adsorption of CR onto ZnO–clay–alginate beads. Adams–Bohart model fit and parameters are presented in Fig. 12 and Table 6 respectively. Maximum adsorption capacity (Qe) increases with increase initial concentration but decreases with increase flow rates and column height. Rate constant (kAB) also shows a relative decrease with flow rate. This observation could be attributed to domination of the process by external mass transfer.23 The experimental breakthrough curves were not close to those predicted by the Adams–Bohart model, hence a significant deviation. Table 7 gave the parameters for Yoon–Nelson model fit (Fig. 14), the values of rate constant kYN increases with flow rate while τ, (the time required for 50% breakthrough) decreases. The lower values of SSE with R2 > 0.99 make the models to be acceptable.
 |
| | Fig. 11 Clark model fits for the column adsorption study of congo red dye on ZnO–clay–alginate beads (a) effect initial concentration (b) effect of flow rate and (c) effect of column height. | |
Table 4 Clark model parameters for the column adsorption study of congo red dye on ZnO–clay–alginate beads
| Q × 103 (L min−1) |
Co (mg L−1) |
H (cm) |
r × 10−2 (min−1) |
A |
R2 |
% SSE |
| 2.00 |
100 |
10 |
3.67 |
6.95 |
0.999 |
0.178 |
| 2.00 |
200 |
10 |
3.13 |
8.50 |
0.996 |
0.193 |
| 2.00 |
300 |
10 |
5.31 |
8.62 |
0.995 |
0.228 |
| 2.00 |
100 |
10 |
2.17 |
5.30 |
0.998 |
0.939 |
| 4.00 |
100 |
10 |
5.05 |
7.51 |
0.997 |
0.160 |
| 6.00 |
100 |
10 |
7.59 |
21.14 |
0.996 |
0.142 |
| 2.00 |
100 |
10 |
3.57 |
8.39 |
0.998 |
0.155 |
| 2.00 |
100 |
15 |
5.41 |
10.33 |
0.997 |
0.198 |
| 2.00 |
100 |
20 |
2.36 |
5.67 |
0.995 |
0.829 |
 |
| | Fig. 12 Thomas model fits for the column adsorption study of congo red dye on ZnO–clay–alginate beads (a) effect initial concentration (b) effect of flow rate and (c) effect of column height. | |
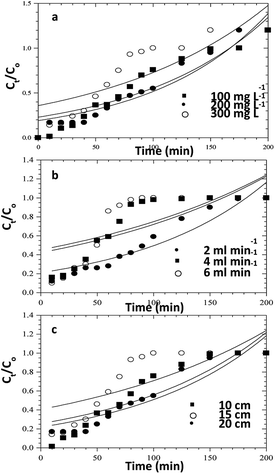 |
| | Fig. 13 Adams–Bohart model fits for the column adsorption study of CR dye on ZnO–clay–alginate beads (a) effect initial concentration (b) effect of flow rate and (c) effect of column height. | |
Table 5 Thomas model parameters for the column adsorption study of congo red on ZnO–clay–alginate
| Q × 103 (L min−1) |
Co (mg L−1) |
H (cm) |
kTH × 10−4 (mL min−1 mg−1) |
qe (mg g−1) |
R2 |
% SSE |
| 2.00 |
100 |
10 |
3.94 |
30.79 |
0.999 |
0.594 |
| 2.00 |
200 |
10 |
1.72 |
74.96 |
0.996 |
0.041 |
| 2.00 |
300 |
10 |
2.04 |
65.06 |
0.997 |
0.064 |
| 2.00 |
100 |
10 |
2.89 |
38.65 |
0.996 |
0.097 |
| 4.00 |
100 |
10 |
5.46 |
45.61 |
0.998 |
0.443 |
| 6.00 |
100 |
10 |
8.56 |
62.83 |
0.996 |
0.179 |
| 2.00 |
100 |
10 |
3.97 |
32.93 |
0.998 |
0.270 |
| 2.00 |
100 |
15 |
6.17 |
23.00 |
0.998 |
0.106 |
| 2.00 |
100 |
20 |
3.00 |
38.41 |
0.994 |
0.296 |
Table 6 Adams–Bohart model's Parameters for the column adsorption study of congo red on ZnO–clay–alginate beads
| Q × 103 (L min−1) |
Co (mg L−1) |
H (cm) |
kAB × 10−5 (mL min−1 mg−1) |
qe (mg g−1) |
R2 |
% SSE |
| 2.00 |
100 |
10 |
8.52 |
83.62 |
0.945 |
0.007 |
| 2.00 |
200 |
10 |
3.26 |
145.3 |
0.924 |
0.056 |
| 2.00 |
300 |
10 |
3.30 |
250.7 |
0.971 |
0.001 |
| 2.00 |
100 |
10 |
8.47 |
119.2 |
0.973 |
0.073 |
| 4.00 |
100 |
10 |
5.28 |
105.9 |
0.928 |
0.098 |
| 6.00 |
100 |
10 |
5.03 |
102.2 |
0.903 |
0.0341 |
| 2.00 |
100 |
10 |
7.80 |
142.8 |
0.998 |
0.00003 |
| 2.00 |
100 |
15 |
5.58 |
88.08 |
0.998 |
0.00003 |
| 2.00 |
100 |
20 |
8.44 |
73.60 |
0.994 |
0.00002 |
Table 7 Yoon–Nelson model parameters for the column adsorption study of congo red on ZnO–clay–alginate beads
| Q × 103 (L min−1) |
Co (mg L−1) |
H (cm) |
kYN × 10−2 (mL min−1) |
τ (min) |
R2 |
% SSE |
| 2.00 |
100 |
10 |
4.24 |
64.31 |
0.999 |
0.005 |
| 2.00 |
100 |
10 |
4.24 |
64.31 |
0.999 |
0.005 |
| 2.00 |
200 |
10 |
3.45 |
83.88 |
0.996 |
0.020 |
| 2.00 |
300 |
10 |
6.10 |
48.9 |
0.996 |
0.028 |
| 2.00 |
100 |
10 |
2.93 |
85.87 |
0.996 |
0.017 |
| 4.00 |
100 |
10 |
5.78 |
48.52 |
0.997 |
0.019 |
| 6.00 |
100 |
10 |
8.76 |
46.05 |
0.997 |
0.032 |
| 2.00 |
100 |
10 |
4.11 |
71.59 |
0.997 |
0.013 |
| 2.00 |
100 |
15 |
6.26 |
51.04 |
0.998 |
0.020 |
| 2.00 |
100 |
20 |
3.12 |
83.23 |
0.994 |
0.028 |
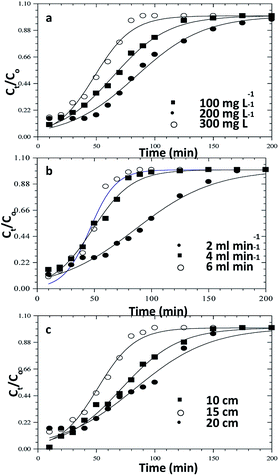 |
| | Fig. 14 Yoon–Nelson model fits for the column adsorption study of congo red dye on ZnO–clay–alginate beads (a) effect initial concentration (b) effect of flow rate and (c) effect of column height. | |
Conclusion
Removal of anionic dye, CR from aqueous solution with the use of zinc oxide modified clay–alginate hydrogel beads was elaborately studied. Also hydrogel beads with network formation enhanced the easy regeneration of the adsorbent. The batch isotherm studies fit well to the Langmuir isotherm model with maximum adsorption capacity of 546.89 mg g−1. The value compare favourably over and above other adsorbent reported in the literature. The pseudo-first-order kinetic model was found to be the most suitable to predict the adsorption capacity of the adsorbent and confirmed the higher performance of the clay–alginate hydrogel beads. The adsorption of CR onto column mode Yoon–Nelson model is the best fitted of all the models which gave R2 of 0.999 and % SSE of less than 0.1%. From the results, it can be concluded that the surface modified ZnO–sepiolite clay–alginate beads which can be a successful sorbent for CR expulsion from aqueous solution. The benefit of improved sorption with high recuperation potential can be viably exploited in packed columns for scaling up of large scale reactors for continuous applications in sullied expulsion.
List of abbreviations
| ZnO | Zinc oxide |
| Alg | Alginate |
| CR | Congo red |
| FTIR | Fourier transformed infrared |
| XRD | X-ray diffraction |
| SEM | Scanning electron microscopy |
| RL | Langmuir constant |
| D–R | Dubinin–Radushkevich |
| % SSE | Percentage statistical error |
| Qm | Maximum adsorption capacity (mg g−1) |
| Qe | Amount of dye removed at equilibrium (mg g−1) |
| Qt | Amount of dye removed at any time (mg g−1) |
| R2 | Correlation coefficient |
| R | Gas constant (J mol−1 K−1) |
| KF | Freundlich constant |
| k1 | First order rate constant (min−1) |
| k2 | Second order rate constant (g mg−1 min−1) |
Acknowledgements
One of the authors (S. Vahidhabanu) is thankful to Department of Science and Technology, India, for financial support through DST-INSPIRE fellowship.
References
- S. Elemen, E. P. Akcakoca Kumbasar and S. Yapar, Dyes Pigm., 2012, 95(1), 102–111 CrossRef CAS.
- P. Nigam, G. Armour, I. M. Banat, D. Singh and R. Marchant, Bioresour. Technol., 2000, 72, 219–226 CrossRef CAS.
- L. Wang and J. Li, Ind. Crops Prod., 2013, 42, 153–158 CrossRef.
- P. Sharma, H. Kaur, M. Sharm and V. Sahore, Environ. Monit. Assess., 2011, 183, 151–195 CrossRef CAS PubMed.
- D. Shen, J. Fan, W. Zhou, B. Gao, Q. Yue and Q. Kang, J. Hazard. Mater., 2009, 172, 99–107 CrossRef CAS PubMed.
- A. G. Espantaleón, J. A. Nieto, M. Fernández and A. Marsal, Appl. Clay Sci., 2003, 24(1), 105–110 CrossRef.
- J. L. Sotelo, G. Ovejero and A. Rodríguez, Water, Air, Soil Pollut., 2013, 224, 1466 CrossRef.
- M. Sturini, A. Speltini, F. Maraschi, A. Profumo, S. Tarantio, A. F. Gualtieri and M. Zema, Chemosphere, 2016, 150, 683–693 CrossRef PubMed.
- S. C. Santos and R. A. Boaventura, J. Environ. Chem. Eng., 2016, 4(2), 1473–1483 CrossRef CAS.
- R. Fu, Y. Yang, Z. Xu, X. Zhang, X. Guo and D. Bi, Chemosphere, 2015, 138, 726–734 CrossRef CAS PubMed.
- R. Batmaz, N. Mohammed, M. Zaman, G. Minhas, R. M. Berry and K. C. Tam, Cellulose, 2014, 21(3), 1655–2166 CrossRef CAS.
- R. Afkhami and R. Moosavi, J. Hazard. Mater., 2010, 174, 398–403 CrossRef PubMed.
- F. B. Barlas, D. Ag Seleci, M. Ozkan, B. Demir, M. Seleci, M. Aydin, M. A. Tasdelen, H. M. Zareie, S. Timur, S. Ozcelik and Y. Yagci, J. Mater. Chem. B, 2014, 2, 6412–6421 RSC.
- J. Hong and Y. He, Desalination, 2012, 302, 71–79 CrossRef CAS.
- G. Crini, Prog. Polym. Sci., 2005, 30, 38–70 CrossRef CAS.
- A. I. Adeogun, S. Omeike and S. O. Kareem, Journal of Environment and Biotechnology Research, 2016, 2(2), 1–11 Search PubMed.
- K. Vasanth Kumar, V. Ramamurthi and S. Sivanesan, J. Colloid Interface Sci., 2005, 284, 14–21 CrossRef PubMed.
- A. Karamipour, N. Rasouli, M. Movahedi and H. Salavati, Phys. Chem. Res., 2016, 4, 291–301 Search PubMed.
- H. Chen and J. Zhao, Adsorption, 2009, 15, 381–389 CrossRef CAS.
- M. A. Zenasni, B. Meroufel, A. Merlin and B. George, J. Surf. Eng. Mater. Adv. Technol., 2014, 4, 332–341 CAS.
- Q. Zhang, M. Xie, X. Guo, L. Zeng and J. Luo, Integr. Ferroelectr., 2014, 151, 61–75 CrossRef CAS.
- T. W. Weber and R. K. Chakraborty, Chem. Eng. J., 1974, 20, 228 CAS.
- Z. Aksu and F. Gone, Process Biochem., 2004, 39, 599–613 CrossRef CAS.
|
| This journal is © The Royal Society of Chemistry 2017 |
Click here to see how this site uses Cookies. View our privacy policy here.  Open Access Article
 a
a
![[thin space (1/6-em)]](https://www.rsc.org/images/entities/char_2009.gif) :
:![[thin space (1/6-em)]](https://www.rsc.org/images/entities/char_2009.gif) 1) with continuous stirring at 80 °C for 30 min and thereafter calcinated at 600 °C for 1 h.
1) with continuous stirring at 80 °C for 30 min and thereafter calcinated at 600 °C for 1 h.


![[thin space (1/6-em)]](https://www.rsc.org/images/entities/char_2009.gif) ln(αβel × t)
ln(αβel × t)
 is also estimated (Co (mg L−1) is the initial concentration of the dye), values of RL between 0 and 1 represents favourable adsorption, RL > 1 suggests unfavourable adsorption and RL = 0 stands for irreversible process. The KF and n of Freundlich isotherm model are isotherm parameters characterizing adsorption capacity and intensity, respectively. Whereas the Temkin isotherm constants aT and bT, K are equilibrium binding constant (L g−1), heat of adsorption (J mol−1), E represents the energy of adsorption in Dubinin–Radushkevic (D–R) isotherm model. R is the gas constant (8.314 × 10⁻³ kJ K−1 mol−1) and T is the absolute temperature (K).16


