
 Open Access Article
 This Open Access Article is licensed under a
 Creative Commons Attribution 3.0 Unported Licence
Electrochemistry and surface-enhanced Raman spectroscopy of CTAB modulated interactions of magnetic nanoparticles with biomolecules†
Delina Josepha,
Raul D. Rodriguezb,
Akash Vermab,
Elaheh Pousanehc,
Dietrich R. T. Zahnb,
Heinrich Langc and
Sudeshna Chandra *a
*a
aDepartment of Chemistry, Sunandan Divatia School of Science, NMIMS University, Vile Parle (West), Mumbai-400056, India. E-mail: sudeshna.chandra@nmims.edu
bTechnische Universität Chemnitz, Faculty of Natural Sciences, Institute of Physics, Semiconductor Physics, 09107 Chemnitz, Germany
cTechnische Universität Chemnitz, Faculty of Natural Sciences, Institute of Chemistry, Inorganic Chemistry, 09107 Chemnitz, Germany
First published on 13th January 2017
Abstract
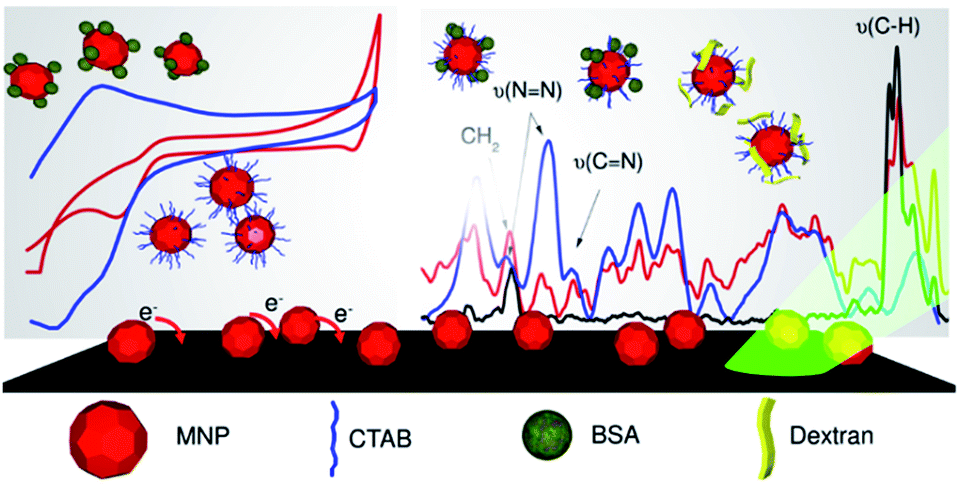
In this study, we use cyclic voltammetry (CV) to depict the association of magnetic iron oxide nanoparticles (MNPs) with two different coating materials namely, bovine serum albumin (BSA) and dextran. The role of a cationic surfactant, hexadecyltrimethylammonium bromide (CTAB) in stabilizing the MNPs and augmenting the association with BSA and dextran is also investigated. CV of the MNPs/CTAB systems shows a diffusion-controlled mechanism on interaction with BSA and dextran. In the presence of CTAB, the reduction potential of MNPs shifted to a higher value indicating hindrance in the electron transfer process. Raman spectroscopy is used to study the structural change of MNPs during the associations. Surface-enhanced Raman spectroscopy (SERS) provides an insight into the mode of interaction by enhancing the otherwise weak signals arising due to Raman active carbon skeletal modes in organic coating materials. BSA tends to associate with the MNPs by diffusing through the CTAB molecule by hydrophobic interactions, while dextran is attached with the hydrophilic head groups of CTAB. Zeta potential and saturation magnetization of the nanoparticles show good colloidal stability and retention of magnetic properties, respectively after coating.
Introduction
Magnetic iron oxide (Fe3O4) nanoparticles (MNPs) are next generation high performance materials in the field of biomedical applications like diagnostics, hyperthermia and as therapeutic vehicles.1,2 The unique magnetic properties of MNPs allow them to be guided by external magnetic fields and hence they are utilized as MRI contrast agents for targeted drug or gene delivery, and for cell tracking.3,4 To address the key issues of MNPs like size, dispersibility, macrophage invasion and cytotoxicity, normally MNPs are stabilized using various coating materials. By the virtue of nanoscale dimension coupled with a cytocompatible surface coating, MNPs can pass through blood vessels and penetrate into cell barriers to interact with cell organelles and provide organo-specific therapeutics.5,6 Some of the coating materials used for this purpose include protein, polysaccharides, surfactants and polymers.7–9 Simple biological compounds produced by living organisms, such as protein or polysaccharide moieties remain a preferred choice of coating material due to their inherent biocompatibility.Surfactants are widely used during the synthesis of nanoparticles since they act as a capping agents preventing nanoparticle aggregation.10,11 Besides stabilizing, surfactants can also play a major role in enhancing the binding interaction of the MNPs with biomolecules. In an attempt to understand the role played by cationic and anionic surfactant, hexadecyltrimethylammonium bromide (CTAB) and sodium dodecyl sulfate (SDS) respectively at the interface of MNP core, bare and surfactant modified MNPs were investigated with BSA and dextran molecules.12,13
Cyclic voltammetry (CV) serves as a fast, simple, sensitive and cost effective technique to study the response of various materials with different analytes.14–16 CV is also helpful in elucidating the reaction mechanism of a system. Yadav et al. recently explored the use of CV to understand the role of graphene/titanium oxide modified electrode in charge transport and diffusion mechanism.17 Similarly, Oliveira et al. studied the interaction of quinones with amino acids and thiols using CV.18 The study of electrochemical behavior like redox reaction of metals at the electrode surface is also well investigated.19 On similar lines, the electrochemistry of magnetite in bulk had been established,20–22 however, very few works have investigated it in its nanoscale form.23,24
Raman spectroscopy is a very sensitive and reliable technique to monitor the structural and chemical changes in a molecule. With the advent of SERS, the limitation in Raman spectroscopic technique to recognize weak signals from noise signals were also solved. Some of the recent works25–28 reported in the analysis of biomolecules using SERS highlights the importance of such studies with respect to advances in research. Molecular association of the iron oxide nanoparticles with protein and polysaccharide in presence of CTAB was probed using this technique. Knowledge of these interfacial association and their structure are imperative in the design of a biocompatible MNPs.3,29
In this study, cyclic voltammetry was used to unearth the electrochemical behavior of MNPs/CTAB and their interaction with biomolecules. Detailed investigation of the nanoparticles surfaces by confocal Raman spectroscopy and SERS gave an insight into the conformational changes that occurred during the molecular association and the mode of interaction.
Experimental
Reagents
Fatty acid free bovine serum albumin (BSA) ≥ 98%, dextran from Leuconostoc spp. (Mr 15![[thin space (1/6-em)]](https://www.rsc.org/images/entities/char_2009.gif) 000–25000) ≥ 98%, CTAB ≥ 99% were purchased from Sigma-Aldrich, Germany. All other chemicals were of analytical grade and used as received. MNPs were synthesized by chemical co-precipitation and were characterized using various techniques (see ESI S1†). Deionized (DI) water was used as the solvent medium for all experiments.
000–25000) ≥ 98%, CTAB ≥ 99% were purchased from Sigma-Aldrich, Germany. All other chemicals were of analytical grade and used as received. MNPs were synthesized by chemical co-precipitation and were characterized using various techniques (see ESI S1†). Deionized (DI) water was used as the solvent medium for all experiments.
Electrochemical studies
Cyclic voltammetry was used to study the electrochemical behaviour of the MNPs/CTAB system. The CV measurements were performed on a CH Instrument Model 660D electrochemical workstation (CH Instruments Inc., US) using a 3-electrode single-cell system. Phosphate buffer solution (0.1 M) and KCl solution (0.1 M) was used as electrolyte and supporting electrolyte respectively. Pt-Wire and Ag/AgCl electrodes were employed as counter and reference electrodes respectively. All the solutions were degassed and purged with nitrogen gas prior to electrochemical measurements to eliminate the presence of dissolved oxygen and the studies were carried out at room temperature. Glassy carbon electrode (GCE) of 2 mm diameter was used as the working electrode. GCEs were polished with 1, 0.3, and 0.05 μm slurries of alumina powder and thoroughly rinsed with DI water. The electrodes were alternatively sonicated in water and methanol for 10 min and this process was repeated 4–5 times. MNPs and MNPs/CTAB sample solutions were prepared comprising of (0.1 mg ml−1) MNPs and MNPs in 2.2 mM CTAB (above post micellar surfactant concentration), respectively. 20 μl of the nanoparticles were deposited on the GCE surface and were air-dried overnight to obtain a thin film coating of the nanoparticles on the electrode. The modified electrodes were then subjected to cyclic voltammetry for evaluating their electrochemical interaction towards BSA and dextran.Raman spectroscopic studies
Raman spectra for the MNPs/CTAB–dextran and MNPs/CTAB–BSA systems were obtained on Xplora Raman spectrometer (Horiba JY). The laser wavelengths used for the study were 785 nm for conventional Raman and the 532 nm laser line for SERS since the plasmonic nanoparticles used were resonant in that range. Laser power of 2 mW was incident on the samples with a 80× long working distance objective in the backscattering geometry. The scattered signal was analyzed using a diffraction grating of 1200 lines per mm. The acquisition time was 10 s for an average of 10 spectra per sample. The nanoparticles samples were prepared by incubating the MNPs/CTAB solution with BSA and dextran for 2 h. The magnetic sample mixture was decanted using bar magnet and further rinsed with DI water 3–4 times along with subsequent magnetic separation before being vacuum dried. Thus surfactant mediated nanoparticles with BSA and dextran coatings were obtained and named as MNPs/CTAB–BSA and MNPs/CTAB–dextran respectively. For recording SERS spectra, Ag nanoparticles cages were used on a silicon substrate. Typical sample preparation method for SERS consisted of drying 5 μl Ag nanoparticles over silicon substrate and then 3 μl of sample solution was added on it and then dried.Results and discussion
Electrochemical performance of MNPs and MNPs/CTAB towards bovine serum albumin (BSA)
The electrochemistry of MNPs proceeds via the redox reactions of Fe3+/Fe2+. However the redox process is affected due to the interaction of nanoparticles with the associating molecules. Cyclic voltammetry helps to monitor the electron transfer efficiently and determine the energetic forces driving the interaction over a wide potential range.Fig. 1 shows the cyclic voltammograms of MNPs in a potential window of −1 to +1 V, at a scan rate of 50 mV s−1. The negative potential at −0.62 V signifies the reduction peak of MNPs. Cyclic voltammetry studies in previous reports proved various pathways of magnetite reduction as under different experimental conditions.24,30 Basically, Fe3+ of MNPs are reduced to Fe2+ according to the following equation:
| Fe3O4 + 8H+ + 2e− → 3Fe2+ + 4H2O | (1) |
 | ||
| Fig. 1 Cyclic voltammograms of modified electrodes with and without 0.1 mg ml−1 BSA and 0.2 mg ml−1 dextran respectively at a scan rate of 50 mV s−1. | ||
In MNPs–BSA system as seen in Fig. 1, an enhancement of redox peak currents was noticed. BSA normally possesses intrinsic electroactivity due to presence of tyrosine and tryptophan residues.31,32 By associating with the MNPs, the residual amino acids are oxidized and an anodic peak is observed as shown in Fig. 1. However the potential separation (ΔEp) for the MNPs–BSA increases to 250 mV from an initial ΔEp of 16.6 mV of MNPs, indicating a slow electron transfer kinetics15,33 and a quasi-reversible association of nanoparticles with BSA.
In the MNPs/CTAB system, a prominent reduction peak was observed at −0.48 V and hence a higher reduction potential compared to MNPs. This shift can be attributed to the insulating effect provided by the CTAB layer, which decreases the electron transfer process of the MNPs redox species. For MNPs/CTAB–BSA the reduction potential was observed at −0.53 V. The shift of the reduction potential to lower side signified an easy reduction process and an intercalative binding of the MNPs/CTAB with BSA. However, since the ratio of the anodic to cathodic peak current deviated from unity, it can be presumed that the association is irreversible. In this system, wherein a surfactant modified electrode was used, the peak potential separations were recorded as 232 mV and 281 mV for MNPs/CTAB and MNPs/CTAB–BSA, respectively. Peak separation is a function of the rate constant for electron transfer and hence a higher value denotes slow electron kinetics involved in the redox activity of the system.
Electrochemical performance of MNPs and MNPs/CTAB towards dextran
Fig. 1 also depicts the cyclic voltammogram of the modified electrodes towards dextran in a potential window of −1 to +1 V at a scan rate of 50 mV s−1. Since dextran is a non-electroactive material, it is not expected to contribute in the electron transfer process. This is experimentally verified by the slight reduction in the peak current. The CV scan of MNPs/CTAB–dextran showed the reduction peak of CTAB as observed in the BSA system. An irreversible nature of association was also observed in MNPs–dextran and MNPs/CTAB–dextran system as the ratio of anodic and cathodic peak current was above 1 for both systems. The peak shape and peak separation also denotes a slow electron transfer in dextran system. The potential separations (ΔEp) observed for the MNPs–dextran and MNPs/CTAB–dextran systems were 35.5 mV and 170 mV, respectively.Effect of scan rate towards BSA and dextran
All the four systems with the modified electrodes were scanned at different scan rates from 5 to 200 mV s−1. The value of ΔEp was seen to increase with the increasing sweep (scan) rate in MNPs/CTAB–BSA and MNPs/CTAB–dextran. Further, the peak currents obtained were plotted as a function of the square root of scan rate (Fig. 2A). The MNPs/CTAB–BSA nanoparticles exhibited linearity only above 20 mV s−1 which indicates a diffusion controlled mechanism only at higher scan rates. However, MNPs/CTAB–dextran (Fig. 2B) showed a linear response of peak current indicating diffusion controlled mechanism for all the scan rates investigated herein. | ||
| Fig. 2 Peak current versus √scan rate plot for (A) MNPs–BSA and MNPs/CTAB–BSA system and (B) MNPs–dextran and MNPs/CTAB–dextran system. | ||
Diffusion coefficients were calculated using Randle–Sevcik equation33 and are given in Table 1. A steady decrease in diffusion coefficient in both MNPs/CTAB–BSA and MNPs/CTAB–dextran were observed due to the presence of a CTAB.
| System | Diffusion coefficient (cm2 s−1) |
|---|---|
| MNPs | 1.27 × 10⁻⁴ |
| MNPs/CTAB | 0.40 × 10⁻⁴ |
| MNPs–BSA | 3.11 × 10⁻⁴ |
| MNPs/CTAB–BSA | 0.90 × 10⁻⁴ |
| MNPs–dextran | 0.88 × 10⁻⁴ |
| MNPs/CTAB–dextran | 0.21 × 10⁻⁴ |
Raman spectroscopic studies
Normally for metal oxides, intense Raman bands are observed up to the 700 cm−1 region. This region serves as fingerprint spectral window for comparison with the bare MNPs. Magnetite has 5 phonon modes (A1g + Eg + 3T2g) that are Raman active.34 However these peaks are very sensitive to various parameters, including laser power and acquisition time. Hence, the Raman spectra of MNPs often show peaks corresponding to mix phases of more stable iron oxide forms like maghemite and hematite.35,36 In particular, the laser power was shown to induce the transition of magnetite to hematite for bulk surfaces.37 In this study, we observed the transition to hematite phase even for laser power as low as 100 μW under near-infrared excitation (785 nm). Here we exploit this situation to study the impact of different organic coatings on the magnetite/hematite phase transition.Raman spectra for MNPs/CTAB, MNPs/CTAB–BSA and MNPs/CTAB–dextran were compared with pristine MNPs displaying the typical spectra of hematite as shown in the normalized spectra in Fig. 3. The spectra are characterized by the two A1g and the five Eg modes of hematite. The broad background at 670 cm−1 can be attributed to the remaining magnetite phase which also features a lower Raman cross-section than hematite. The most remarkable differences for the nanoparticles with different coatings relate to the intensity ratios and peak positions as shown in Fig. 3. Shifting of peaks towards lower or higher wavenumber is representative of changes in chemical bonds and crystal symmetry due to external perturbations from the coating present on the nanoparticle. Therefore, under same experimental conditions, Raman peak changes can be attributed to change in nanocrystal structure due to molecular association with biomolecules. In this context, we observed that in presence of CTAB the intensity ratio A1g/Eg changed by +275% with respect to the ratio of the pristine sample. The situation changes, when BSA is added to the CTAB coated particles resulting in a decrease of the A1g/Eg ratio closer to the pristine case (only 50% increase). However, when dextran is included along with CTAB the changes in intensity ratio are similarly high as with CTAB alone (+175% with respect to pristine nanoparticles). An additional effect for the CTAB–dextran sample is the decrease in heat dissipation which appears in the Raman spectra as a broadening of the phonon modes and down shift. This could be related to a decrease in the electronic contribution to heat conductivity in agreement with the results observed in the electrochemical results in the section above. We also observed that the intensity ratios for the different samples correlate with the diffusion coefficients determined by cyclic voltammetry (see Table 1). The systems with lower diffusion coefficient show large A1g/Eg ratios (and vice versa) and hence comparative information on the diffusion coefficients can be obtained with an optical method (Raman). In either case, CTAB proves to be instrumental in the bridging of the MNPs with the coating material with BSA preserving more the pristine state as compared to dextran. This implies that BSA has a different interaction with CTAB possibly taking CTAB's place around the nanoparticles which is in agreement with the electrochemical results and SERS results discussed below.
 | ||
| Fig. 3 (A) Schematics of the different sample combinations studied with Raman spectroscopy, (B) (magnified portion of (C)) shows Raman spectra of MNPs, MNPs/CTAB, MNPs/CTAB–BSA and MNPs/CTAB–dextran irradiated with 2 mW laser of 785 nm. | ||
To have further insight into the mode of interaction with the coating materials, Raman-active skeletal modes were studied from 1100 cm−1 to 3000 cm−1 which are mainly due to the carbon stretching and bending vibrations. The Raman bands from head group vibrations of CTAB molecule also appear in the 2800 to 3000 cm−1 region. Analysis of the samples by conventional Raman spectroscopy did not yield much information in this spectral window and the required information was only possible to access with surface-enhanced Raman spectroscopy (SERS) see Fig. S2† for individual comparison of samples in this range. The thin organic coating around the magnetic nanoparticles was not in a quantity large enough to be observed without SERS. And hence without the impact of using plasmonic enhancement to investigate minute quantities of material, it would go undetected. Using SERS (surface-enhanced Raman spectroscopy), this region was enhanced quite well as observed in Fig. 4. For MNPs/CTAB, peak at 2848 cm−1 can be assigned to the C–H symmetric stretching mode of CH3. The bands at 2875 cm−1 and 2931 cm−1 can be assigned to CH3 asymmetric stretching and –N+(CH3)3 symmetric stretching vibrations,38 while the band at 1670 cm−1 comes from C![[double bond, length as m-dash]](https://www.rsc.org/images/entities/char_e001.gif) N vibrations. The Raman band at 1441 cm−1 can be ascribed to the –CH2 bending mode. In MNPs/CTAB–dextran system, the CH3 asymmetric stretching and –N+(CH3)3 symmetric stretching vibrations modes appeared at 2881 cm−1 and 2936 cm−1 signifying deformations in that region due to the interaction of dextran with the head group of CTAB.39,40 Also, there is a change in the intensity ratio of these bands. In case of the MNPs/CTAB–BSA system, the signals were enhanced 100 fold and the peaks in the region 1100 cm−1 to 1800 cm−1 were comparable with the SERS spectra for BSA.41–43 The 100 fold enhancement is observed when BSA has an intercalative binding with metal surfaces.42 In this case the BSA tends to diffuse through the CTAB interface with minor secondary structural modification to associate with MNPs.12 SERS of only BSA did not show such enhancement in this region, and hence confirming the above hypothesis.
N vibrations. The Raman band at 1441 cm−1 can be ascribed to the –CH2 bending mode. In MNPs/CTAB–dextran system, the CH3 asymmetric stretching and –N+(CH3)3 symmetric stretching vibrations modes appeared at 2881 cm−1 and 2936 cm−1 signifying deformations in that region due to the interaction of dextran with the head group of CTAB.39,40 Also, there is a change in the intensity ratio of these bands. In case of the MNPs/CTAB–BSA system, the signals were enhanced 100 fold and the peaks in the region 1100 cm−1 to 1800 cm−1 were comparable with the SERS spectra for BSA.41–43 The 100 fold enhancement is observed when BSA has an intercalative binding with metal surfaces.42 In this case the BSA tends to diffuse through the CTAB interface with minor secondary structural modification to associate with MNPs.12 SERS of only BSA did not show such enhancement in this region, and hence confirming the above hypothesis.
 | ||
| Fig. 4 SERS spectra for MNPs/CTAB, MNPs/CTAB–BSA and MNPs/CTAB–dextran at 532 nm. | ||
Stability studies and magnetic properties of coated MNPs
Zeta potential measurements helps to investigate the colloidal stability of the nanoparticles formulation, with an insight into the relative surface charge due to the interaction of nanoparticles.44 The stability of the MNPs/CTAB–BSA and MNPs/CTAB–dextran solutions were monitored for a period of more than 2 months by recording the zeta potential measurements at an interval of two weeks (Table 2). The MNPs/CTAB–BSA system exhibited a nominal change in zeta potential from +41 mV to +36.6 mV in two months, whereas MNPs/CTAB–dextran remained unchanged.| System | Zeta potential values (mV) | |
|---|---|---|
| Day 0 | Day 60 | |
| MNPs/CTAB–BSA | +41 | +36.6 |
| MNPs/CTAB–dextran | +18.1 | +17.4 |
Hence, both systems were electrostatically stabilized by the virtue of the positively charged cationic surfactant. Thus a stable colloidal system can be expected using the as prepared coated nanoparticles.
The magnetic properties of the samples were evaluated by recording their magnetic moment against the magnetic field as shown in Fig. 5. The curve demonstrated a superparamagnetic behavior with zero coercivity and no remanence. The saturation magnetizations of MNPs/CTAB–BSA and MNPs/CTAB–dextran were found to be 56 and 45 emu g−1, respectively. Hence, the inherent magnetic properties of MNPs were found to be retained in coated MNPs.
 | ||
| Fig. 5 M versus H plots for bare MNPs, MNPs/CTAB–BSA and MNPs/CTAB–dextran nanoparticles. | ||
Possible interaction mechanism
The interactions of MNPs with BSA and of the dextran system in presence of CTAB were studied using cyclic voltammetry. In case of MNPs/CTAB, the presence of a surfactant interface shows a characteristic electrochemical behavior of magnetite nanoparticles towards the biomolecules. In CV, the shift in peak potential indicates the mode of interaction and in this case, the involvement of CTAB in bridging the interactions can be well noted. The diffusion coefficients for MNPs and MNPs/CTAB in presence of BSA calculated using the Randle–Sevcik equation were reduced in presence of a surfactant.45 The CTAB surfactant interface thus acted as a diffusion barrier for the electroactive species to reach the electrode surface. The increase in potential separation for MNPs/CTAB–BSA indicates slow electron transfer and can be attributed to the structural changes occurring due to hydrophobic binding of BSA to nanoparticles.46 The peak shape obtained and large ΔEp around 280 at 50 mV s−1 suggested slow kinetics involved in the association as a result of complex processes.30 In addition, for the dextran system, diffusion coefficients were reduced in presence of CTAB. Nevertheless, MNPs/CTAB–dextran followed a diffusion controlled mechanism.Raman spectra of the system added further insights to the structural changes due to molecular association. Shifts in peak intensity and wavenumber confirmed the influence on nanoparticles chemical bond length due to association with BSA and dextran through the CTAB interface. The Raman spectroscopy analysis in the low wavenumber region shows that MNPs/CTAB–BSA had an upscale shift, while MNPs/CTAB–dextran had a downscale shift with respect to MNPs/CTAB signifying the difference in the pattern of association in both systems. These investigations also showed the increased MNPs stability offered by the coating. The SERS effect normally stems from the increased inelastic light scattering due to electromagnetic and chemical enhancement. Among them electromagnetic enhancement is considered to play the dominant role, it occurs as a result of localized surface plasmon resonance (LSPR) originating from the surface of metal nanostructures.47 The silver substrate used for the SERS analysis provides the required plasmon effect. In SERS analysis of the samples, it was noted that the head group of the CTAB surfactant comprising of the –N+(CH3)3 was effectively involved in a hydrogen bonding interaction with the dextran molecule in the MNPs/CTAB–dextran system. In case of the MNPs/CTAB–BSA arrangement, the 100 fold enhanced SERS spectra signifies the BSA binding with CTAB at the hydrophobic tail. Hence the plasmon coupling effect facilitates lesser enhancement in MNPs/CTAB–dextran sample compared to MNPs/CTAB–BSA, as dextran molecules occupy superficial position while covering the MNPs/CTAB whereas BSA molecules diffuse through the polar head of CTAB to associate with the underlying hydrophobic tail and thereby establishing a proximity with the inner core of iron oxide as well. Fig. 6 gives the schematic illustration of the overall study.
 | ||
| Fig. 6 Graphical representation of the interaction of magnetic nanoparticles with the biomolecules. | ||
Conclusions
The electrochemical behavior of CTAB modulated interactions of magnetic nanoparticles were assessed electrochemically and further supported by surface-enhanced Raman spectroscopy. The active role of CTAB in the nanoparticle–biomaterial association was evident from the lower reduction potential of the system. Reduced diffusion coefficients of the CTAB systems proved an efficient surfactant layer on the MNPs surface. Raman spectroscopic studies confirmed the structural changes in MNPs due to coating, and further SERS analysis depicted the mode of interaction in the CTAB molecule for the molecular association. The as-prepared coated MNPs showed good colloidal stability and inherent magnetic properties. Cyclic voltammetry and Raman spectroscopic techniques were efficiently employed to elucidate the mechanism and interactions of nanoparticles with different bio-organic molecules.Acknowledgements
This work was partly performed within the Federal Cluster of Excellence cfaed ‘Center for Advancing Electronics Dresden’, TU Dresden, supported by the German Research Foundation (DFG), the financial support of which is gratefully acknowledged. DJ acknowledges InProTUC scholarship (funding for young researchers by German Academic Exchange Service) in support by the Federal Ministry for Education and Research (BMBF) for a short research stay at TU Chemnitz. We thank Lina Dedelaite and Alexander Golubev for critical assistance with the SERS experiments. RDR, AV and DRTZ were funded by the DFG Research Unit FOR1713 SMINT. This work was partly performed in the context of the European COST Action MP1302 Nanospectroscopy.References
- H. Lee, T. H. Shin, J. Cheon and R. Weissleder, Chem. Rev., 2015, 115, 10690–10724 CrossRef CAS PubMed.
- J. Chomoucka, J. Drbohlavova, D. Huska, V. Adam, R. Kizek and J. Hubalek, Pharmacol. Res., 2010, 62, 144–149 CrossRef CAS PubMed.
- Y. Pan, X. Du, F. Zhao and B. Xu, Chem. Soc. Rev., 2012, 41, 2912–2942 RSC.
- J. Liu, C. Detrembleur, S. Mornet, C. Jerome and E. Duguet, J. Mater. Chem. B, 2015, 3, 6117–6147 RSC.
- V. I. Shubayev, T. R. Pisanic and S. Jin, Adv. Drug Delivery Rev., 2009, 467–477 CrossRef CAS PubMed.
- N. Lee, D. Yoo, D. Ling, M. H. Cho, T. Hyeon and J. Cheon, Chem. Rev., 2015, 115, 10637–10689 CrossRef CAS PubMed.
- E. Amstad, S. Zurcher, A. Mashaghi, J. Y. Wong, M. Textor and E. Reimhult, Small, 2009, 5, 1334–1342 CrossRef CAS PubMed.
- A. M. G. C. Dias, A. Hussain, A. S. Marcos and A. C. A. Roque, Biotechnol. Adv., 2011, 29, 142–155 CrossRef CAS PubMed.
- M. Mahmoudi, S. Sant, B. Wang, S. Laurent and T. Sen, Adv. Drug Delivery Rev., 2011, 63, 24–46 CrossRef CAS PubMed.
- P. B. Shete, R. M. Patil, B. M. Tiwale and S. H. Pawar, J. Magn. Magn. Mater., 2015, 377, 406–410 CrossRef CAS.
- S. K. Mehta, S. Kumar, S. Chaudhary and K. K. Bhasin, Nanoscale Res. Lett., 2009, 4, 1197–1208 CrossRef CAS PubMed.
- D. Joseph, S. Sachar, N. Kishore and S. Chandra, Colloids Surf., B, 2015, 135, 596–603 CrossRef CAS PubMed.
- D. Joseph, N. Kishore, S. Chandra, under review.
- R. Mi, X.-T. Bai, B. Tu and Y.-J. Hu, RSC Adv., 2015, 5, 47367–47376 RSC.
- K. Z. Kamali, P. Alagarsamy, N. M. Huang, B. H. Ong and H. N. Lim, Sci. World J., 2014, 2014, 13 Search PubMed.
- A. Shah, E. Nosheen, S. Munir, A. Badshah, R. Qureshi, Z. U. Rehman, N. Muhammad and H. Hussain, J. Photochem. Photobiol., B, 2013, 120, 90–97 CrossRef CAS PubMed.
- P. Yadav, K. Pandey, P. Bhatt, B. Tripathi and M. Kumar, Mater. Sci. Eng., B, 2016, 206, 22–29 CrossRef CAS.
- C. M. Oliveira, A. S. Barros, A. C. S. Ferreira and A. M. S. Silva, Food Chem., 2016, 211, 1–7 CrossRef CAS PubMed.
- M.-T. Hsieh, C.-T. Chen and T.-J. Whang, J. Electroanal. Chem., 2016, 762, 73–79 CrossRef CAS.
- P. D. Allen, N. A. Hampson and G. J. Bignold, J. Electroanal. Chem. Interfacial Electrochem., 1979, 99, 299–309 CrossRef CAS.
- P. Encinas, L. Lorenzo, M. L. Tascón, M. D. Vázquez and P. Sánchez-Batanero, J. Electroanal. Chem., 1994, 371, 161–166 CrossRef CAS.
- K. B. V. Fetisov, A. Ermakov, G. Belysheva, A. Fetisov and V. Kamyshov, J. Solid State Electrochem., 2004, 8, 565–571 CrossRef.
- F. J. Santos, L. C. Varanda, L. C. Ferracin and M. Jafelicci, J. Phys. Chem. C, 2008, 112, 5301–5306 CAS.
- A. Rodriguez-Lopez, D. Torres-Torres, J. Mojica-Gomez, C. Estrada-Arteaga and R. Antano-Lopez, Electrochim. Acta, 2011, 56, 8078–8084 CrossRef CAS.
- L. Mikoliunaite, R. D. Rodriguez, E. Sheremet, V. Kolchuzhin, J. Mehner, A. Ramanavicius and D. R. T. Zahn, Sci. Rep., 2015, 5, 13150 CrossRef CAS PubMed.
- D. Bhowmik, K. R. Mote, C. M. MacLaughlin, N. Biswas, B. Chandra, J. K. Basu, G. C. Walker, P. K. Madhu and S. Maiti, ACS Nano, 2015, 9, 9070–9077 CrossRef CAS PubMed.
- L. J. Xu, C. Zong, X. S. Zheng, P. Hu, J. M. Feng and B. Ren, Anal. Chem., 2014, 86, 2238–2245 CrossRef CAS PubMed.
- S. R. Ede, U. Nithiyanantham and S. Kundu, Phys. Chem. Chem. Phys., 2014, 16, 22723–22734 RSC.
- E. Mahon, A. Salvati, F. Baldelli Bombelli, I. Lynch and K. A. Dawson, J. Controlled Release, 2012, 16, 164–174 CrossRef PubMed.
- K. Murugappan, D. S. Silvester, D. Chaudhary and D. W. M. Arrigan, ChemElectroChem, 2014, 1, 1211–1218 CrossRef CAS.
- E. Palecek, J. Tkac, M. Bartosik, T. Bertok, V. Ostatna and J. Palecek, Chem. Rev., 2015, 115, 2045–2108 CrossRef CAS PubMed.
- M. Vestergaard, K. Kerman and E. Tamiya, Sensors, 2007, 7, 3442–3458 CrossRef CAS.
- P. R. Solanki, A. Kaushik, A. A. Ansari, G. Sumana and B. D. Malhotra, Appl. Phys. Lett., 2008, 93, 163903 CrossRef.
- G. V. M. Jacintho, A. G. Brolo, P. Corio, P. A. Z. Suarez and J. C. Rubim, J. Phys. Chem. C, 2009, 113, 7684–7691 CAS.
- F. Márquez, T. Campo, M. Cotto, R. Polanco, R. Roque, P. Fierro, J. M. Sanz, E. Elizalde and C. Morant, Soft Nanosci. Lett., 2011, 1, 25–32 CrossRef.
- Y.-S. Li, J. S. Church and A. L. Woodhead, J. Magn. Magn. Mater., 2012, 324, 1543–1550 CrossRef CAS.
- L. Slavov, M. V. Abrashev, T. Merodiiska, C. Gelev, R. E. Vandenberghe, I. Markova-Deneva and I. Nedkov, J. Magn. Magn. Mater., 2010, 322, 1904–1911 CrossRef CAS.
- H. Gökce and S. Bahçeli, Opt. Spectrosc., 2013, 115, 632–644 CrossRef.
- J. Goral, Curr. Top. Biophys., 1990, 16, 33–47 Search PubMed.
- D. C. W. Siew, R. P. Cooney, M. J. Taylor and P. M. Wiggins, J. Raman Spectrosc., 1994, 25, 727–733 CrossRef CAS.
- V. J. C. Lin and J. L. Koenig, Biopolymers, 1976, 15, 203–218 CrossRef CAS PubMed.
- R. P. Kengne-Momo, P. Daniel, F. Lagarde, Y. L. Jeyachandran, J. F. Pilard, M. J. Durand-Thouand and G. Thouand, Int. J. Spectrosc., 2012, 2012, 1–7 CrossRef.
- A. Ganesan, M. J. Brunger and F. Wang, Eur. Phys. J. D, 2013, 67, 1–12 CrossRef.
- Y. Zhang, M. Yang, N. G. Portney, D. Cui, G. Budak, E. Ozbay, M. Ozkan and C. S. Ozkan, Biomed. Microdevices, 2008, 10, 321–328 CrossRef CAS PubMed.
- G. N. Kamau, T. Leipert, S. S. Shukla and J. F. Rusling, J. Electroanal. Chem., 1987, 233, 173–187 CrossRef CAS.
- A. J. Downard and A. D. Roddick, Electroanalysis, 1995, 7, 376–378 CrossRef CAS.
- P. Alonso-González, P. Albella, M. Schnell, J. Chen, F. Huth, A. García-Etxarri, F. Casanova, F. Golmar, L. Arzubiaga, L. E. Hueso, J. Aizpurua and R. Hillenbrand, Nat. Commun., 2012, 3, 684 CrossRef PubMed.
Footnote |
| † Electronic supplementary information (ESI) available. See DOI: 10.1039/c6ra26235j |
| This journal is © The Royal Society of Chemistry 2017 |