
 Open Access Article
 This Open Access Article is licensed under a
 Creative Commons Attribution 3.0 Unported Licence
The effect of methane decomposition on the formation and magnetic properties of iron carbide prepared from oolitic hematite
Henghui Wangab,
Guangqiang Li *ab,
Jianghua Mab and
Dong Zhaoa
*ab,
Jianghua Mab and
Dong Zhaoa
aThe State Key Laboratory of Refractories and Metallurgy, Wuhan University of Science and Technology, P. O. Box 185, 947 Heping Avenue, Qingshan District, Wuhan, Hubei 430081, P. R. China. E-mail: liguangqiang@wust.edu.cn; Fax: +86 2768862665; Tel: +86 2768862665
bKey Laboratory for Ferrous Metallurgy and Resources Utilization of Ministry of Education, Wuhan University of Science and Technology, Wuhan, Hubei 430081, P. R. China
First published on 16th January 2017
Abstract
A chemical metallurgical method was used to prepare iron carbide from high phosphorus oolitic hematite in an atmosphere of H2/CH4. The relationship between the rate of methane decomposition and the iron carbide formation was discussed by using the Mossbauer spectrum to accurately determine the content change of iron carbide with time in the carburized product. Moreover, the carburized samples were characterized by transmission electron microscopy (TEM), Raman spectroscopy and X-ray diffraction (XRD), and the magnetic properties were examined by a vibrating sample magnetometer (VSM). The results show that 1023 K is the optimum temperature for iron carbide preparation from high phosphorus oolitic hematite. After deep reduction in the initial period of contact with CH4, the conversion of deposited carbon to the iron carbide rises rapidly, and then declines quickly. A polycrystalline electron diffraction analysis reveals that iron carbide, graphite and quartz are in the carburized sample. The iron carbide prepared from high phosphorus oolitic hematite in an H2/CH4 atmosphere is a soft magnetic material with relatively high magnetic properties.
Introduction
Iron carbide (Fe3C), as a kind of functional material, can be used as an information material1,2 or an electromagnetic shielding material3 for its unique electromagnetic properties, and it can also be used as indirect hydrogen storage material because it reacts with water vapour and produces hydrogen.4The carburization of iron oxides with H2/CH4 is an effective method for the iron carbide preparation. The preparation has two steps: firstly H2 is used for the reduction of Fe2O3 to Fe, and then CH4 is used for the carburization of Fe to Fe3C. The carburization step in which the reduced metallic iron reacted with methane is the key stage for the formation of iron carbide. The carburization of metallic iron begins with the methane decomposition, and the deposited carbon is the carbon source of iron carbide, which has been revealed by Zhang and Ni et al.5,6 The methane catalytic decomposition is an economical technology, as it can both obtain hydrogen in high purity, and some nano-carbon materials.7–9 It is well-known that Fe, Co and Ni supported on SiO2, Al2O3 and MgO are effective catalysts for the synthesis of filamentous carbons (carbon nanotubes (CNT) and carbon nanofibers (CNF)) through hydrocarbon decomposition.10–12 Compared with the Ni-based catalysts, the Fe-based catalysts are economical and environment friendly. Nano-carbon materials prepared by the methane decomposition on the surface of metallic iron was introduced,13,14 and some results are valuable. Ermakova et al.15,16 examined the effects of the addition of hard-reduced oxides such as SiO2, Al2O3, TiO2 and ZrO2 into iron oxides on the catalytic activity for methane decomposition. The temperature range from 953 to 973 K was considered as optimal for the process of methane decomposition on α-Fe. The maximal carbon yield, 45 g per g of iron, was obtained with the Fe/SiO2 catalyst comprising silica in amounts of 15 wt%. Carbon nanotubes with thin walls built up by coaxial cylindrical graphene layers were formed in large amount over the Fe/Al2O3 catalyst. Takenaka et al.17 examined the catalytic activities and the shape and structure of carbons formed by methane decomposition over Fe2O3/Al2O3 and Fe2O3/SiO2 catalysts at 1073 K. The results showed that Fe2O3 crystallites of diameters smaller than ca. 30 nm in the fresh catalysts were transformed into α-Fe metal and Fe3C (cementite) immediately after contact with methane at 1073 K, while those of larger diameters were transformed into γ-Fe metal saturated with carbon atoms (austenite). Methane catalyzed with Fe2O3/Al2O3 catalysts formed multiwalled carbon nanotubes (MWCNTs) and chain-like CNTs. Methane can form filamentous carbons with the Fe2O3/SiO2 catalysts.
The reserves of high phosphorus oolitic hematite are large in China, with the characteristic of finely disseminated and embedded hematite in the oolite matrix along with quartz, chlorite, apatite and other gangue minerals.18,19 The gangue materials are the combinations of the oxide compounds such as SiO2, Al2O3, MgO, P2O5 and CaO. Thus, the gangue materials can be considered as varied kinds of Fe-based catalyst for the special fine dissemination structure between hematite and gangue components. Therefore, the methane catalytic decomposition will be occurred and some carbon nano materials may be also formed on the reduced iron from the high phosphorus oolitic hematite. Previous studies by our research groups have proved that the iron carbide can be prepared from high phosphorous oolitic hematite in the atmosphere of H2/CH4.20–22 So, the methane decomposition can both affect the iron carbide formation and the nanocarbon materials preparation. However, the specific relationship between the methane decomposition (especially the amount and rate of deposit carbon from methane decomposition) and the formation of iron carbide, and the characterization and properties of the carburized products prepared from high phosphorus oolitic hematite, is still not clear. In this paper, the thermogravimetric experiments, X-ray diffractometer (XRD), Mossbauer spectroscopy, Raman spectroscopy and vibrating sample magnetometer (VSM) were employed to investigate the effect of methane decomposition on the formation of iron carbide prepared from high phosphorus oolitic hematite.
Experimental
The iron carbide preparation from high phosphorus oolitic hematite
The high phosphorus oolitic hematite from west Hubei province in China, was used as the raw material. Firstly, the iron ore was crushed into small particles and then screened with the particle size among 100–120 mesh. The fine ore powders were pelletized with some distilled water after the sufficient mixing process by an agate mortar. The raw pellets were subsequently dried for 2 h at 373 K and then sintered for 15 min at 1173 K. The composition of the high phosphorus oolitic hematite was analyzed by inductively coupled plasma atomic emission spectroscopy (ICP-AES), as shown in Table 1.| Composition | T. Fe | SiO2 | Al2O3 | MgO | CaO | P |
| Content | 50.23 | 14.6 | 5.08 | 0.62 | 2.34 | 0.77 |
The two-step process was used to prepare iron carbide from high phosphorus oolitic hematite at 105 Pa: (i) the reduction in H2 to a certain reduction degree of 0.9 at 1023 K; (ii) the decomposition of CH4 for the carburization to form the iron carbide at different temperatures (973 K, 1023 K and 1073 K) for different time. The procedures are depicted as follows:
(a) The pellet specimen (ca. 1.5 g with the diameter of 10 mm) in the basket was placed into a quartz reaction tube (with the diameter of 30 mm and the height of 400 mm), and then heated to the 1023 K under the protective gas of argon in the resistance furnace.
(b) The argon gas was switched to hydrogen gas (150 cm3 min−1) for the reduction process. When the weight of pellet decreased to a certain unchanged value, change the temperature to the carburization temperature, then the H2 gas was switched to CH4 gas (300 cm3 min−1) for the carburization process. When the carburization proceeded a certain period, the methane was switched to argon. The flow rate of gases was controlled by mass flow controllers (Alicat Scientific).
(c) The quartz reaction tube was taken out with a large flow rate of argon gas to fast cool the specimen to the room temperature.
Characterization and magnetic properties of carburized specimens
The weight change of specimens during the H2 reduction and CH4 carburization process was measured with a thermobalance and kept a continuous record by a personal computer. The product specimens were ground into fine powder by an agate mortar, and marked with special numbers. The labeled A, B and C were respectively corresponded to the temperature of 973 K, 1023 K and 1073 K. The A1, A2, A3, A4, A5 and A6 were represented CH4 introducing time for 5 min, 8 min, 10 min, 12 min, 15 min and 30 min.The iron species present in the specimens after different experimental conditions were identified by means of the Mossbauer spectroscopy at room temperature on a constant acceleration and conventional standard transmission spectrometer (WissEl) with a 57Co(Pd) source. The drive velocity scale was calibrated with a 25 μm thick pure α-Fe foil. All isomer shifts were quoted relative to the center of the α-Fe calibration spectrum. The experimental 57Fe Mossbauer spectra were fitted by a least-squares regression fitting procedure. The phases in specimens were analyzed using XRD method (XRD, X′Pert PRO MPD) with copper Kα X-ray radiations. The carburized specimens were also observed by the transmission electron microscope (TEM, Phillips CM12 device) and Raman spectroscopy (Renishaw, RM2000). Isothermal magnetization measurements at room temperature were performed in a commercial super-conducting quantum interference device magnetometer (SQUID-VSM, Quantum Design).
Results and discussion
The dependence between carbon weight gain and the carburization degree
The related ref. 5 and 6 revealed that the formation of iron carbide included the three periods: incubation period, rapid conversion period, and decay period. The process consists of the following steps: the adsorption of methane on the surface of metallic iron; the methane decomposition to carbon and hydrogen; the diffusion of carbon into metallic iron and formation of supersaturated solution of carbon in iron; formation of iron carbide by reaction of iron with carbon.Therefore, appropriate methane decomposition rate directly determine the amount of carbon deposition, which is one of the most important factors for higher conversion rate of iron carbide.
Too slow rate of methane decomposition will cause the insufficient supplement of carbon, and it will retard the conversion of iron carbide. Too rapid methane decomposition leads to too much deposited carbon, which is not beneficial to the mass transfer of the methane into the pellet specimens. In addition, too much free carbon also decreases the purity of the carburized specimens. Therefore, the investigation of relationship between the CH4 decomposition and the formation of iron carbide is quite necessary. The main reactions (1) and (2) are shown as follows:23
The methane decomposition stage:
CH4 = 2H2 + C, ΔG0 = 90![[thin space (1/6-em)]](https://www.rsc.org/images/entities/char_2009.gif) 165 − 109.45T (J mol−1) 165 − 109.45T (J mol−1)
| (1) |
The carburization stage:
|
3Fe + C = Fe3C, ΔG0 = 26694 − 24.77T (J mol−1)
| (2) |
The carbon weight gain:
| m = mi − mr | (3) |
The mass ratio of carbon to iron (g C/g Fe):
| g C/g Fe = m/mFe | (4) |
The carburization degree:
| n = RFe3C/(RFe + RFe3C) × 100% | (5) |
The carbon utilization ratio:
| u = WFe3C/m × 100% | (6) |
The dependence of the carburization degree and the carbon weight gain versus the temperature (973 K to 1073 K) of reaction with CH4 for 10 min and 30 min are shown in Fig. 1. The histograms in Fig. 1 show the carburization degree changes with the different temperatures. Fig. 1(a) illustrates that the carburization degree increases with the temperature increases when reacted with CH4 for 10 min, and the carburization degree at 1023 K (82.40%) is only a bit lower than that of 1073 K (85.29%). Fig. 1(b) depicted that the carburization degree at 1023 K is highest of 95.54%. Considering the consumption of energy, the 1023 K is the optimal temperature for the preparation of iron carbide from high phosphorus oolitic hematite. The results are in good agreement with the previous studies by our research group and other academic researchers.5,22–24 The two curves in Fig. 1(a) and (b) correspond to the total carbon weight decomposed from methane and the carbon weight in Fe3C. The similar increase tendency of the two curves in Fig. 1(a) and (b) indicates that the increase carbon from the methane decomposition is propitious to the formation of iron carbide. However, the carbon weight (0.051 g) in Fe3C at 1023 K with CH4 for 30 min was much lower than that of the total carbon weight (0.33 g), the utilization ratio of the carbon to generate the iron carbide is only 15.45%. Meanwhile, the mole ratio of total carbon to iron in the carburized sample at 1023 K with CH4 for 30 min is 2.05, which is much higher than the stoichiometric ratio of carbon to iron in Fe3C of 0.33.
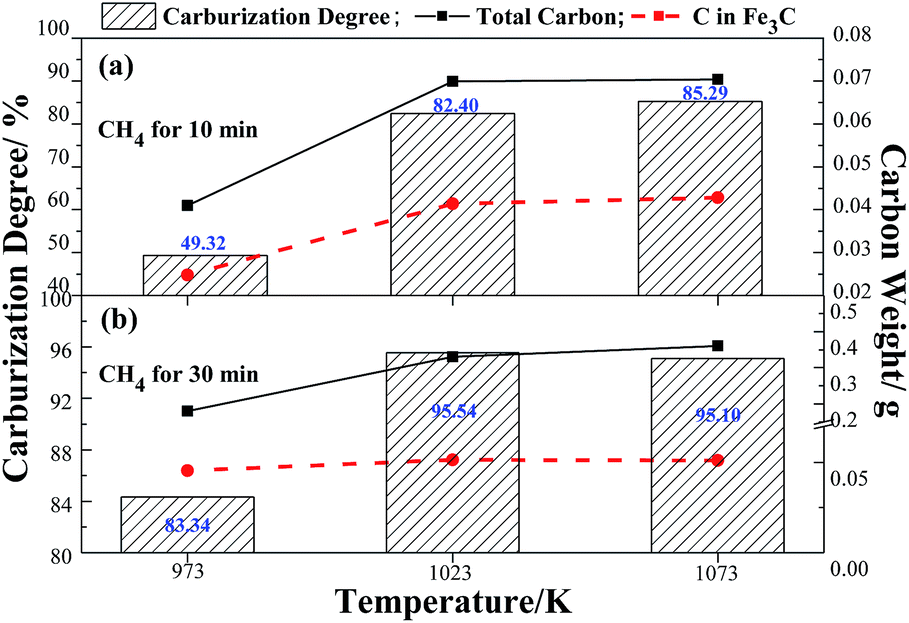 | ||
| Fig. 1 The dependence between carbon weight gain and carburization degree versus temperature in case of reaction with CH4 for 10 min (a) and 30 min (b). | ||
The further dependence among the carbon to iron mass ratio, carburization degree and the carbon utilization ratio at 1023 K versus time during the methane decomposition on the reduced pellet is shown in Fig. 2. The figure shows that the carburization degree increases with the time extension, and the curve increases at a rather slow rate before 200 s and subsequently at a relatively rapid rate from 200 s to 600 s. Then the carburization degree increases slowly after 600 s. The carbon utilization ratio increases rapidly to around 95% in 300 s, then the ratio decreases to around 16% when the time reaches to 1800 s. Based on the change of the carburization degree and the utilization ratio, it is not hard to find that the initial period of the CH4 contact time before 300 s, the highest carbon utilization ratio is 95% with the carburization degree of 13.29%. The results are similar to that by Narkiewicz and Arabczyk et al.14,25,26 they revealed that the carbon utilization ratio during the initial period of the carburization before 200–1000 s at 773–853 K was almost 100% by the methods of thermogravimetry and XRD. The differences may be due to the larger particle size of high phosphorus oolitic hematite and higher temperature of 973–1073 K at present work. The mass ratio of carbon to iron during the first 200 s reacted with CH4 was almost 0. The results indicated that after the complement of H2 reduction stage, the CH4 did not crack immediately. Some literatures have proved that the methane decomposition without catalyst cannot happen if the temperature is lower than 1473 K.27 It can be deduced that the reaction between CH4 and FeO, which is also called deep reduction, occurred during the initial 200 s of CH4 contact. The possible reaction should be reaction (7). The results are in well agreement with that of Takenaka et al.,17 they found the iron oxides in Fe2O3/Al2O3 catalysts were reduced to α-Fe by methane at 1073 K.
| 3FeO + CH4 = 3Fe + 2H2O + CO | (7) |
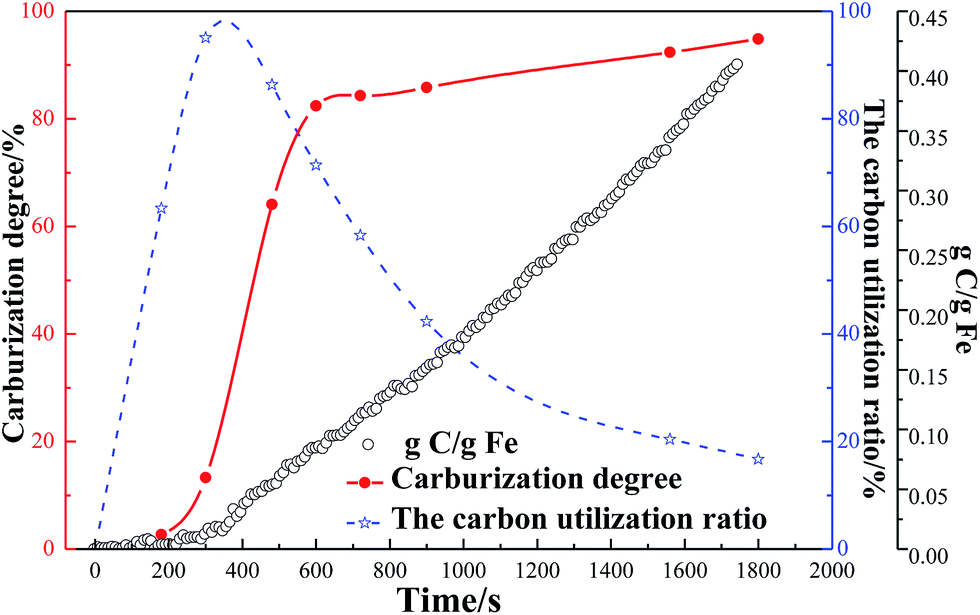 | ||
| Fig. 2 The dependence among the carburization degree, the carbon utilization and the mass ratio of carbon to iron at 1023 K. | ||
When the reaction (7) finished, the carbon weight gain increases gradually at a relative uniform rate. From the slope of the weight gain curve, the average rate of carbon weight gain is 8.4 × 10⁻⁴ g s−1.
From the carburization degree curve in the figure, the curve can be obviously divided into three stages: 0–200 s, 200–600 s, and 600–1800 s. The carbon weight gain during the 0–200 s stage is almost 0, which means the content of iron carbide should be very few. The carburization degree curve shows the carburization degree is only 2.67% in this stage. In the stage of 200–600 s, the carburization degree increases from 2.67 to 82.4%, at a rapid rate. As the time increases to 1800 s, the carburization degree increases from 82.4% to 95.54%, with a relatively smaller increase amplitude. Comparison of carbon weight gain and carburization degree curve, the reaction of methane decomposition and carburization occurred almost at the same time. After H2 reduction, the reduced metallic iron with great activity has a larger specific surface area, which has the significant effect on methane decomposition and carburization. Based on the above analysis, the schematic mechanism for the formation of iron carbide from high phosphorus oolitic hematite is depicted as shown in Fig. 3. First step is the stepwise reduction of hematite (Fe2O3) to metallic iron (Fe) by H2 gas, the second step should include the three parts: (i) the deep reduction of FeO to Fe by CH4 gas, (ii) the methane decomposition (CH4 → C + H2), (iii) the carburization of metallic iron (Fe + C → Fe3C). The mechanism is a little different from that of Zhang and Ni et al.,5,6 mentioned in the section of Introduction. The deep reduction of FeO by CH4 has been confirmed in this study, which may be contributed to the relatively complex structure of high phosphorus oolitic hematite than that of high-grade iron ore.
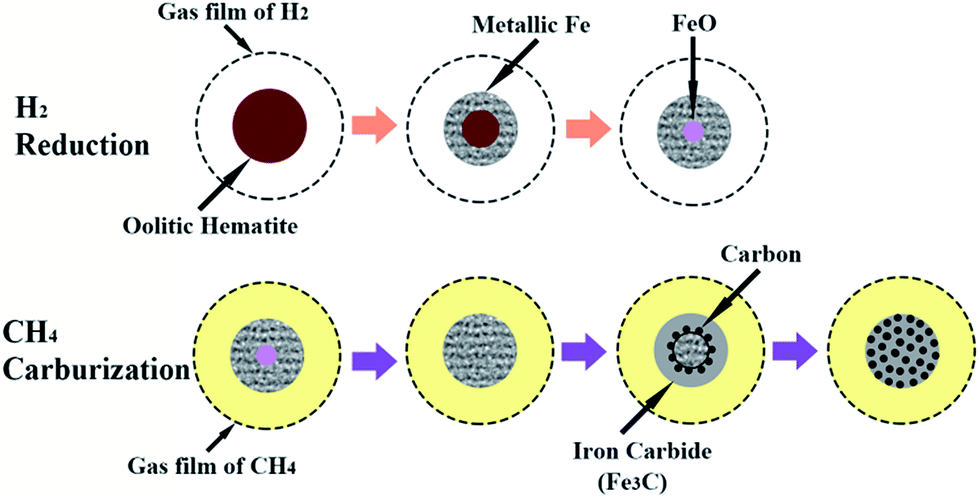 | ||
| Fig. 3 The schematic mechanism of iron carbide formation from high phosphorus oolitic hematite. | ||
XRD analysis
The results aforementioned indicates that higher reaction temperature causes larger amount of deposited carbon on the surface of metallic iron. Fig. 4 indicates that the phases of the specimens are composed of iron carbide (Fe3C), graphite (C), and quartz (SiO2). For the XRD patterns of the carburized products at 973 K and 1023 K for 30 min, the peaks (number 1) of orthorhombic crystal Fe3C are shown in Fig. 4. The intensity of the peak at 2θ = 37.63°, which attributes to the corresponding (1 2 1) reflections of Fe3C, according to the JCPDS no. 00-035-0772, can depict the relative content of Fe3C.25 Based on the intensity of three peaks at 2θ = 37.63°, the diffraction intensity of Fe3C at 1023 K for 30 min is relatively stronger than that of other two conditions. The results are in agreement with that drawn from Fig. 1. The strong and narrow nature of the peaks indicates that the well-crystallized iron carbide was obtained. Meanwhile, a diffraction peak at about 2θ = 26.69° (number 2) is assigned to the (1 0 1) reflection of the hexagonal SiO2 structure (JCPDS no. 01-086-1628). The peak at 2θ = 26.35° (number 3) can be indexed to graphite, which corresponding to (0 0 2) reflection of hexagonal graphite structure (JCPDS no. 00-001-0640). At 1073 K, the characteristic peak of carbon appeared, which illustrates that at higher temperature, the degree of methane decomposition is larger. So, the phase of carbon can be easily detected, and it further revealed that higher temperature promoted the formation of deposited carbon.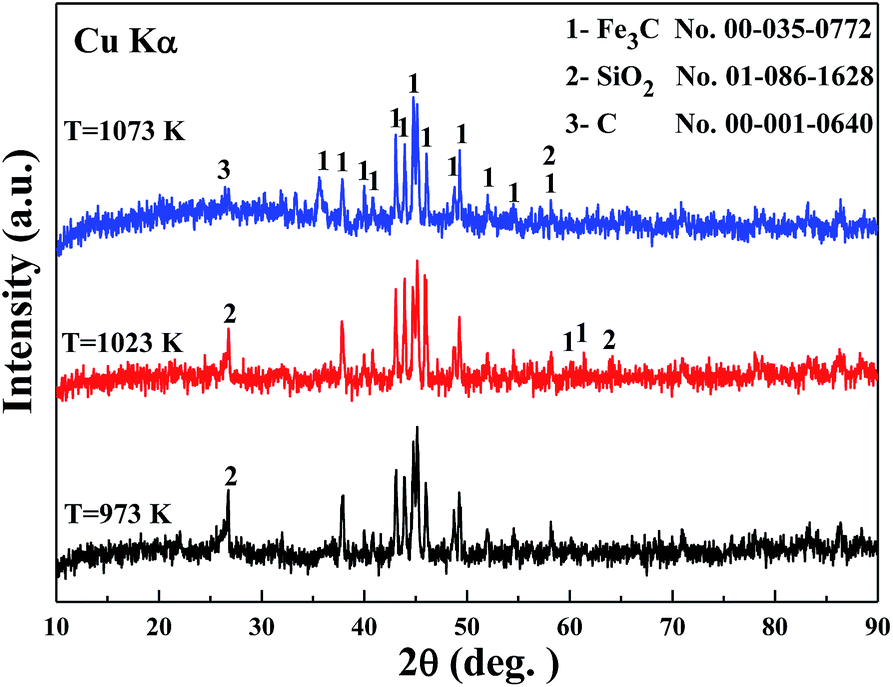 | ||
| Fig. 4 The XRD patterns for different temperatures of CH4 for 30 min. | ||
TEM observation
Further morphological and structural details of the carburized specimens were investigated by TEM as shown in Fig. 5. Fig. 5(a) and (c) shows the TEM images of the carburized products at 973 K and 1023 K in CH4 atmosphere for 30 min. It clearly indicates that the block-like particles have two parts: the dark part with the size of ca. 770 nm and grey layer in thickness of ca. 200 nm (see Fig. 5(a)). Fig. 5(c) depicts that the spherical-like particle (in dark) with the mean diameter of 300 nm and the thickness of 134 nm (in grey). The dark particles in Fig. 5(a) and (c) should be iron carbide, while the grey part should the mixture of graphite and the gangue materials especially quartz. It is interesting to find out some nanocarbon-fiber-like graphite in Fig. 5(c). The results are similar to the results by ref. 8, 25 and 28–30.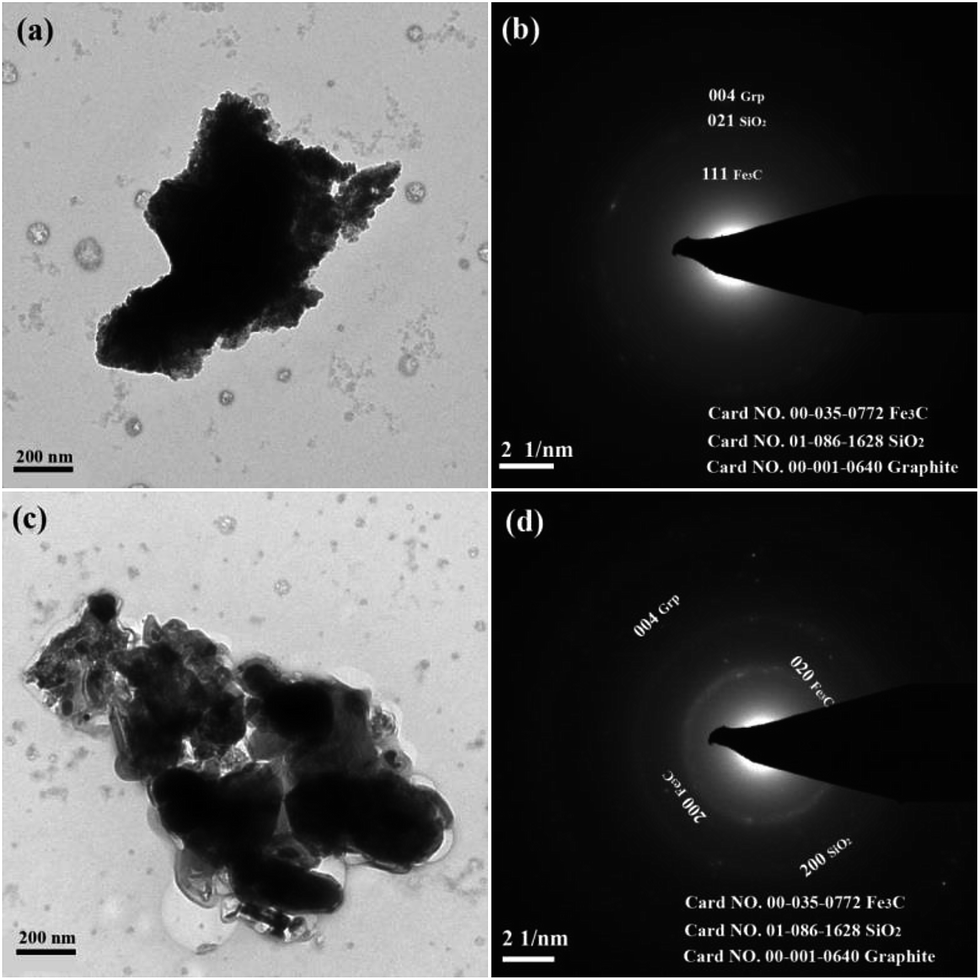 | ||
| Fig. 5 TEM and corresponding SAED images of A6 (a and b) and B6 (c and d) specimens. | ||
To index the powder-diffraction rings, a gold standard was used. Fig. 5(b) and (d) are the selected-area polycrystalline electron diffraction (SAPED), the interplanar distances in this SAPED are 0.1219 and 0.3020 nm, which are in good agreement with the expected value 0.1216 and 0.3024 nm, corresponding to the (1 3 3) and (1 1 1), planes of the orthorhombic Fe3C (JCPDS no. 00-035-0772). Meanwhile, the interplanar distance of 0.1965 nm and 0.1680 nm is consistent with the 0.1976 nm and 0.1690 nm, corresponding to the (0 2 1) plane of hexagonal SiO2 (JCPDS no. 01-086-1628) and the (0 0 4) plane of hexagonal graphite (JCPDS no. 00-001-0640). In similar index method, the (2 0 0) and (0 2 0) plane of orthorhombic Fe3C (JCPDS no. 00-035-0772), the (2 0 0) plane of hexagonal SiO2 (JCPDS no. 01-086-1628) and the (0 0 4) plane of hexagonal graphite (JCPDS no. 00-001-0640) are represent in Fig. 5(d).
The selected-area contains more Fe3C particles in Fig. 5(d) than that of Fig. 5(b), and the particles have larger size and good crystallization degree. The existence of (1 1 1), (0 2 0) and (2 0 0) planes is consistent with the XRD analysis. Both the two figures revealed that there exists the (0 0 4) plane of graphite, and the dim spot and uncontinuous diffraction ring of the graphite indicates that the crystal particles of graphite are small and the crystallization degree is very low. Also, SiO2 can be indexed from Fig. 5(b) and (d), which indicates that the selected-area contains few quartz particles and the crystallization degree is weak.
Raman spectroscopy
The ref. 31 has given the Raman spectra of a graphite spherulite and an iron carbide sample. Two strong peaks were observed at ca. 1350 and ca. 1580 cm−1, which doublet is attributed to the so-called D band and G band of graphite,32,33 and the peak around 2700 cm−1 is the 2× D1 band, also called higher disorder. The D band occurs at around 1350 cm−1 in amorphous sp2-bonded carbon species, such as pyrolytic graphite, glassy carbon and carbon powder. In crystalline graphite, only the G band is observed at around 1600 cm−1. Therefore, the D band grows with the decreasing fraction of graphite. In this work, the Raman spectra of carburized specimens are shown in Fig. 6. Compared with the Raman analysis in the ref. 31, as consistent with the wave number of D1, G and 2× D1, the phase of graphite exists in both B6 and C6 specimens, and the content of graphite in C6 specimen is a bit larger than that of B6. It reveals that the rate of methane decomposition at 1023 and 1073 K, and the degree of the decomposition is not increased too much. Despite the existence of peaks: D1, G and 2× D1, the B6, C6 specimens have some characteristic peaks around 200–500 cm−1 which should be represent for the iron carbide (Fe3C). The result is also in agreement with that in the ref. 31. The intensity of the iron carbide peaks for B6 specimen is higher than that of the C6 specimen, which further confirmed that the 1023 K is better to prepare iron carbide than that of 1073 K in case of reacting with CH4 for 30 min. The result is also consistent with that of Fig. 1. The Raman spectroscopy of B1 specimen has no peaks of D or G band, which means there exists no carbon. The result can deduce that the CH4 did not decompose in the first 5 min, and the deep reduction of CH4 with FeO occurred. In addition, the wavenumber of 691 cm−1 should be the characteristic peak of metallic iron for the Raman spectrum, which has rarely been mentioned in literatures. | ||
| Fig. 6 The Raman spectra of carburized specimens. | ||
Magnetic properties
Fig. 7 presents the magnetization versus magnetic field of carburized specimen obtained at 1023 K with different CH4 reaction time. The figure exhibits the typical characteristics: low coercive force (Hc) and magnetic remanence (Mr) of soft magnetic material. The specific magnetic property is shown in Table 2. Table 2 indicates that the saturation magnetization (Ms) decreases with the increase of carburization time with CH4. The Ms values of B3–B6 specimens are less than that of B1. The Hc values of B1 to B5 specimens are around 10 Oe, but that of B6 is 20 Oe. In addition, the Mr values of B1 to B6 specimens decreased with the increase of carburization time with CH4. Comparing B6 with B1, the decreased amplitude is 19.58%. The changes of magnetic property illustrated that the deep reduction of FeO to Fe occurred at the initial stage of reaction between reduced pellet with CH4. With the further extension of reaction time, the degree of methane decomposition began to rapidly increase on the metallic iron which greatly promoted the formation of iron carbide. But still some free carbon appeared and filled the voids of reduced pellet, which caused the saturation magnetization and the magnetic remanence decreased. Cristina et al.34 measured the magnetic properties of Fe3C nanoparticles by VSM method, and the Ms was 46.7 emu g−1. The results can be ascribed to the formation of a layer with spin disorder, while the carbon layer is not expected to contribute to the magnetization value. Ron Snovski et al.35 also conducted the VSM examination of nanosized Fe3C with some iron oxide, when the main phase is metallic iron, the Ms is around 150 emu g−1, and when the composition of 57.1% Fe3C, 27.8% Fe2O3 and 15.1% Fe3O4, the Ms is around 60 emu g−1. Comparing with Table 2, the magnetic property of iron carbide products prepared from high phosphorus oolitic hematite is relatively good, with high Ms, low Hc and Mr, which indicated the magnetic property has not be decreased much for the existence of gangue minerals from the iron ore.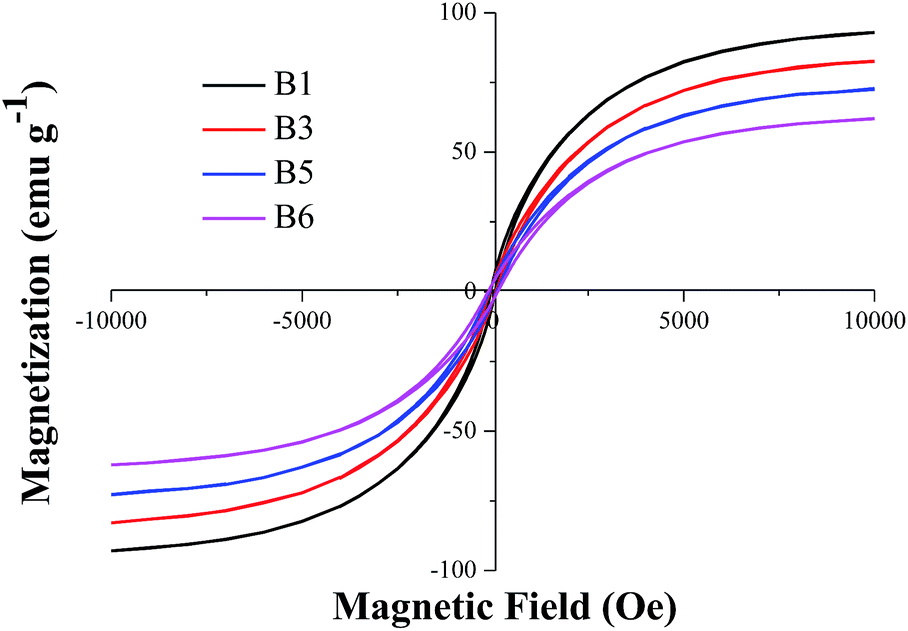 | ||
| Fig. 7 The magnetic hysteresis loops recorded for the B1–B6 samples. | ||
| Ms (emu g−1) | Hc (Oe) | Mr (emu g−1) | |
|---|---|---|---|
| B1 | 92.99 | 10 | 3.83 |
| B3 | 82.59 | 10 | 3.22 |
| B5 | 72.80 | 10 | 3.11 |
| B6 | 62.04 | 20 | 3.08 |
Conclusions
The high phosphorus oolitic hematite was reduced to iron by H2, and subsequently reacted with CH4 thus the iron carbide was prepared.During the initial period of the reaction between the reduced hematite with CH4, the residual FeO from the H2 reduction was deep reduced to the metallic iron without the proceeding of iron carbide formation. Then the iron carbide formed rapidly with the carburization degree of 13.29% and 95% in the first 300 s of the carburization process, which resulted from the reaction between the deposit carbon from the methane decomposition and the newly reduced iron. During the carburization, the methane decomposition rate increased uniformly. 1023 K is the optimal temperature to prepare iron carbide from high phosphorus oolitic hematite and the carburization degree reaches 95.54% after 30 min carburization.
The characteristic analysis reveals that a few graphite and quartz present in the carburized iron carbide products. Based on the selected-area polycrystalline electron diffraction, the crystallization degree of Fe3C in the carburized sample increased with the temperature increase. The methane decomposed on the surface of metallic iron and formed graphite with low crystallinity. Although the saturation magnetization (Ms) decreases from 92.99 to 62.04 emu g−1 with the increase of carburization time from 5 to 30 min, the iron carbide prepared has relatively high magnetic property as a kind of soft magnetic materials.
Acknowledgements
This work is financially supported by the National Natural Science Foundation of China (No. 51374159) and the Open Foundation of State Key Laboratory of Advanced Metallurgy, University of Science and Technology Beijing (No. KF12-06).Notes and references
- T. Masaru and I. Takayuki, Magnetic recording medium, Jap. Patent, JP 1994-152793, 1995.
- I. Takashi and T. Kiminori, Magnetic recording medium and its production, Jap. Patent, JP 1993-187293, 1995.
- R. Kodama, Magnetic nanoparticles, J. Magn. Magn. Mater., 1999, 200, 359 CrossRef CAS.
- T. Akiyama, A. Miyazaki, H. Nakanishi, M. Hisa and A. Tsutsumi, Int. J. Hydrogen Energy, 2004, 29, 721 CrossRef CAS.
- J. Q. Zhang and O. Ostrovski, ISIJ Int., 2001, 41, 333 CrossRef CAS.
- H. W. Ni, F. S. Zhang, D. Q. Cang and J. Jiang, J. Iron Steel Res. Int., 2001, 13, 1 CAS.
- H. F. Abbas and W. M. A. W. Daud, A review, Int. J. Hydrogen Energy, 2010, 35, 1160 CrossRef CAS.
- Y. Kameya and K. Hanamura, Carbon, 2012, 50, 3503 CrossRef CAS.
- R. Siriwardane, H. Tian and J. Fisher, Int. J. Hydrogen Energy, 2015, 40, 1698 CrossRef CAS.
- K. P. D. Jong and J. W. Geus, Catal. Rev.: Sci. Eng., 2000, 42, 481 Search PubMed.
- L. P. Biró, C. A. Bernardo, G. G. Tibbetts and P. Lambin, Carbon filaments and nanotubes: common origins, differing applications?, Springer, Netherlands, 2001 Search PubMed.
- G. Benedek, P. Milani and V. G. Ralchenko. Nanostructured carbon for advanced applications, Springer, Netherlands, 2001 Search PubMed.
- R. J. Wrobel, A. Hełminiak, W. Arabczyk and U. Narkiewicz, J. Phys. Chem. C, 2014, 118, 15434 CAS.
- W. Arabczyk, W. Konicki, U. Narkiewicz, I. Jasińska and K. Kałucki, Appl. Catal., A, 2004, 266, 135 CrossRef CAS.
- M. A. Ermakova, D. Y. Ermakov, A. L. Chuvilin and G. G. Kuvshinov, J. Catal., 2001, 201, 183 CrossRef CAS.
- M. A. Ermakova and D. Y. Ermakov, Catal. Today, 2002, 77, 225 CrossRef CAS.
- S. Takenaka, M. Serizawa and K. Otsuka, J. Catal., 2004, 222, 520 CrossRef CAS.
- Y. T. Li, C. Ma, X. D. Bian, S. J. Wang, J. G. Guo and P. X. Wang, Conservation and Utilization of Mineral Resources, 2010, 4, 33 Search PubMed.
- Y. M. Zhao and C. E. Bi, Mineral Deposits, 2000, 19, 350 CAS.
- G. Q. Li, H. H. Wang, J. Yang and J. H. Ma, Adv. Mater. Res., 2014, 881–883, 98 Search PubMed.
- G. Q. Li, J. Yang, H. H. Wang and J. H. Ma, J. Chongqing Univ., 2015, 38, 1 Search PubMed.
- H. H. Wang, G. Q. Li, J. Yang, J. H. Ma and B. S. Khan, Metall. Mater. Trans. B, 2016, 47, 2571 CrossRef CAS.
- D. Stull and H. Prophet, JANAF Thermochemical Tables, US Government Printing Office. Washington, DC, 2nd edn, 1971 Search PubMed.
- G. Q. Li, J. H. Ma, H. W. Ni, Q. Z. Shen and F. Tsukihashi, ISIJ Int., 2006, 46, 981 CrossRef CAS.
- U. Narkiewicz and W. Arabczyk, J. Mater. Res., 2005, 20, 386 CrossRef CAS.
- U. Narkiewicz, W. Arabczyk and W. Konicki, Fullerenes, Nanotubes, Carbon Nanostruct., 2005, 13, 99 CrossRef CAS.
- D. X. Li. Investigation on methane catalytic decomposition reaction on Ni-based and Fe-based catalysts, Ph. D thesis, Tianjin university, Tianjin, China, 2008.
- U. Narkiewicz, W. Arabczyk, I. Pelech, N. Guskos, J. Typek, M. Maryniak, M. J. Woźniak, H. Matysiak and K. J. Kurzydłowski, Mater. Sci.-Pol., 2006, 24, 1067 CAS.
- A. Helminiak, E. Mijowska and W. Arabczyk, Mater. Sci.-Pol., 2013, 31, 29 CrossRef CAS.
- N. Luo, X. J. Li, X. H. Wang, H. H. Yan, C. J. Zhang and H. T. Wang, Carbon, 2010, 48, 3858 CrossRef CAS.
- S. K. Pradhan, B. B. Nayak, B. K. Mohapatra and B. K. Mishra, Metall. Mater. Trans. A, 2007, 38, 2363 CrossRef.
- G. Katagiri, H. Ishida and A. Ishitani, Carbon, 1988, 26, 565 CrossRef CAS.
- A. Fayer, O. Glozman and A. Hoffman, Appl. Phys. Lett., 1995, 67, 2299 CrossRef CAS.
- G. Cristina, K. Alexer, S. C. Wimbush and A. Markus, Small, 2010, 6, 1859 CrossRef PubMed.
- R. Snovski, J. Grinblat, M. T. Sougrati, J. C. Jumas and S. Margel, J. Magn. Magn. Mater., 2014, 349, 35 CrossRef CAS.
| This journal is © The Royal Society of Chemistry 2017 |