 Open Access Article
Creative Commons Attribution 3.0 Unported Licence
QD-aptamer as a donor for a FRET-based chemosensor and evaluation of affinity between acetamiprid and its aptamer†
Li Xianga and
Jianshe Tang *ab
*ab
aDepartment of Environment and Energy Engineering, Anhui Jianzhu University, 230601, Hefei, People's Republic of China. E-mail: tjs28@ahjzu.edu.cn; Tel: +86-551-63828122
bKey Laboratory of Water Pollution Control and Waste Water Resources in Anhui Province, Hefei, 230601, People's Republic of China
First published on 24th January 2017
Abstract
The sensitive and convenient detection of pesticides has become an important issue in food safety and environmental pollution. In this work, a unique aptamer biosensor for the detection of acetamiprid based on fluorescence resonance energy transfer (FRET) between complementary aptamer-modified CdTe quantum dots (QDs) and aptamer-modified Cy5.5 dye molecules was developed. Hybridization results in the transfer of excitation energy from the QDs to the dye. The Förster radius (R0) and the distance between the donor and acceptor pair (r) were 4.815 nm and 5.134 nm, respectively, based on an analysis of the ratio of donor- to acceptor-dependent FRET efficiency. The Kd was 0.58 μmol L−1 for the Cy5.5-aptamer with acetamiprid. In the presence of acetamiprid, the specific and strong interaction between the aptamer and target inhibited the conjugation of the donor and acceptor, thus leading to a decrease in energy transfer efficiency. A limit of detection (LOD) of 0.02 μM and a wide assay range from 0.01 μM to 10 μM for acetamiprid detection were achieved by fitting the dose-dependent energy transfer efficiency using a 4-parameter model. The proposed method was also successfully applied to measure acetamiprid in spiked water samples, demonstrating its reliability and repeatability.
1. Introduction
The wide use of pesticides in agricultural production inevitably leads to pesticide residues as common contaminants in soil, air, water and on non-target organisms.1 Due to the serious environmental problems and food safety issues caused by pesticide residues, global attention to pesticide residues is increasing. Acetamiprid, N-[(6-chloro-3-pyridyl)methyl]-N′-cyano-N-methyl-acetamidine, a new broad-spectrum insecticide, has been widely used to control sucking-type insects on various crops due to its relatively low acute and chronic mammalian toxicity.2,3 Although acetamiprid is not considered a human carcinogen, it is still potentially harmful to humans, particularly where its use may be subject to abuse. A recent study has implicated acetamiprid as a cause of erectile dysfunction in human males, and acetamiprid may be responsible for declining human fertility.4 The main routes of dissipation of imidacloprid in the environment are aqueous photolysis and plant uptake. When not exposed to light, imidacloprid breaks down slowly in water and soil and, thus, has the potential to persist in the environment. Due to high water solubility (0.5–0.6 g L−1) of imidacloprid, the environmental pollution problems from imidacloprid could be more seriously in areas where soils are permeable and the water table is shallow. Hence, the development of an efficient and convenient analytical strategy with simple handling for acetamiprid detection is of great significance.Analytical methods for pesticide residues are mainly based on chromatography methods (e.g., liquid chromatography,5 gas chromatography,6 chromatography coupled with mass spectrometry,7 capillary electrophoresis,8 enzyme immunoassay,9 and electrochemical analysis10). However, these methods suffer from disadvantages such as requiring complicated sample treatment, high time consumption, sophisticated equipment, and skilled operation staff.
Fluorescent sensors have become valuable tools in environmental contaminant analysis because of their sensitivity and simplicity. In particular, analysis methods based on fluorescence resonance energy transfer (FRET) technology have been used to detect pesticide residues in some primary reports.11–13 In addition, aptamers have drawn increasing attention from researchers for the development of FRET sensors.14
Aptamers are small DNA or RNA oligonucleotides that can recognize their ligands with high affinity and specificity, often comparable to or better than antibodies.15 Aptamers, one of the most prevalent biomaterials, have been envisioned for numerous applications, such as diagnostic and therapeutic tools, biosensing probes, new drug development, and drug delivery, due to their unique properties (e.g., wide target choice, high ligand specificity, production in vitro, and robustness against thermal and chemical denaturation).16 In addition, aptamers can easily be modified without obvious deactivation and thus may be used as effective recognition elements for ligand detection.
In recent years, in-depth understanding of nucleic-acid aptamers in terms of their conformational and ligand-binding properties led to a range of biosensor methods. Analogous to immunoassays based on the antigen antibody interaction, aptamer-based biosensor can adopt different assay configurations, which could be classified as electrochemical, optical and mass-sensitive, according to their signal-harvesting method in a review paper. Recently, a simple and highly sensitive aptamer-based sensor was developed in terms of chrominance and the detection limit reached 0.37 nM for selective detection of Microcystin-LR.17 Zhao et al.18 have also have developed a novel and ultrasensitive photoelectrochemical (PEC) sensing platform based on anti-17βestradiol aptamer as the biorecognition element onto CdSe nanoparticles-modified TiO2 nanotube arrays. The low detection limit of 33 fM to 17β-estradiol was obtained due to the preponderant tubular microstructure and excellent photoelectrical activity of platform.
A facile aptamer-based sensing strategy was developed for dopamine detection based on FRET from rhodamine B to gold nanoparticles.19 A sensor composed of a free aptamer, a gold nanoparticle coated with biotinylated partially complementary DNA, and Cy3-conjugated streptavidin was assembled to detect ochratoxin A based on shielding effect-induced inhibition of FRET.20 An aptamer-based strategy was presented using multicolour dyes as donors and carbon nanoparticles as acceptors in FRET for the simultaneous detection of V. parahaemolyticus, S. aureus, and S. typhimurium with their corresponding aptamers.21,22 Hu and co-workers14 developed an aptamer-based upconversion nanosensor with FRET between a Yb and Ho co-doped upconversion material and gold nanoparticles to quantify acetamiprid. Although sensors based on FRET between nanoparticles and dyes have been developed and used in detection, the stoichiometric ratio of donor to acceptor and the association constant between the aptamer-modified nanomaterial and ligand remain unclear.
Previously, we successfully developed an MIP-based quantum dot (QD) fluorescence quenching sensor for parathion detection.23 To address the problems described above, here, we report a novel FRET configuration that uses a QD as the donor and a dye as the acceptor entirely concentric with the QD. In combination with the use of aptamers as recognition elements, the developed FRET system was validated as a rapid, sensitive and specific method to detect acetamiprid. In addition, we also estimated the Kd for the Cy5.5-aptamer with acetamiprid.
2. Materials and methods
2.1 Reagents and instruments
Acetamiprid was purchased from Sigma-Aldrich. Water-soluble carboxyl-functionalized CdTe quantum dots with a maximum emission wavelength of 650 nm were purchased from China Beijing Beida Jubang Science & Technology Co., Ltd. N-Hydroxysuccinimide (NHS) and 1-ethyl-3-(3-dimethylaminopropyl)carbodiimide hydrochloride (EDC·HCl) were obtained from Sinopharm Chemical Reagent Co., Ltd. (Shanghai, China). All chemicals were of analytical grade and used as received. All experiments were performed in phosphate-buffered saline (PBS; 10 mM, pH 7.2). Milli-Q water was used to prepare all buffers and solutions.Cy5.5-modified acetamiprid-binding aptamers with a sequence of 5′-Cy5.5-CTGAC ACCATATTAT GAAGA-3′ and the amino-functionalized complementary structures of the acetamiprid-binding aptamer were purchased from Sangon Biological Engineering Technology & Co., Ltd. (Shanghai, China).24 An amine group was introduced in 5 of the secondary aptamers.
The absorption spectra were obtained on a 2600 UV-vis spectrophotometer (Shimadzu, Japan). The fluorescence spectra were recorded on an F-7000 fluorescence spectrophotometer (Hitachi, Japan). The fluorescence emission spectra of samples in 96-well plates were measured using a Gemini XPS Microplate Reader (Molecular Devices, USA).
2.2 Preparation of captamer-terminated QDs
The acetamiprid aptamer-conjugated QDs were prepared using the active ester method, as described previously.25 Briefly, 0.5 mg of amino-functioned CdTe quantum dots was dispersed in 2.5 mL of PBS buffer (the QD concentration was 2.0 μmol L−1). Next, 100 μL of 0.1 M EDC (the EDC to QD molar ratio was 10) and 100 μL of 0.1 M NHS were added to the solution and reacted for 30 min under stirring. Then, 50 μL of the acetamiprid-binding aptamer was added, and the mixture was further agitated for 12 h at room temperature. The desired material was obtained by centrifuging for 20 min at 10![[thin space (1/6-em)]](https://www.rsc.org/images/entities/char_2009.gif) 000 rpm for separation. The pellet was dispersed in a PBS buffer solution (0.01 M, pH 7.2) and washed several times to completely remove free acetamiprid aptamer. The final conjugates were incubated in BSA solution (100 μL of 3% BSA (w/v)) at room temperature for approximately 30 min. BSA was adopted to block possible active sites and prevent non-specific absorption.
000 rpm for separation. The pellet was dispersed in a PBS buffer solution (0.01 M, pH 7.2) and washed several times to completely remove free acetamiprid aptamer. The final conjugates were incubated in BSA solution (100 μL of 3% BSA (w/v)) at room temperature for approximately 30 min. BSA was adopted to block possible active sites and prevent non-specific absorption.
2.3 General procedures for the assessment of FRET efficiency and detection of acetamiprid
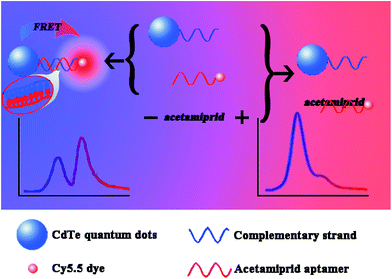
A 200 μL aliquot of a mixture composed of equal volumes of the QD-C-aptamer and Cy5.5-aptamer solutions was measured in a 96-well plates using a fluorescence reader. When the QD-C-aptamer concentration was fixed at 0.24 μM, the molar ratio of Cy/QD ranged from 1 to 10. The molar ratio of Cy/QD was varied from 0.02 to 0.64 to obtain a final Cy5.5-aptamer concentration of 2.4 μM (Scheme 1).To assess the effect of acetamiprid on the FRET efficiency between the QD-C-aptamer and the Cy5.5-aptamer, 50 μL samples of acetamiprid solutions of different concentrations were mixed with 50 μL of 1.5 μM Cy5.5-aptamer. Then, the mixtures were incubated for 20 min to permit sufficient reaction between acetamiprid and the Cy5.5-aptamer. Then, 50 μL of 0.24 μM QD-C-aptamer was added and incubated for 20 min. The fluorescence spectra were subsequently recorded with excitation at 400 nm at room temperature.
3. Results and discussion
3.1 FRET efficiency analysis
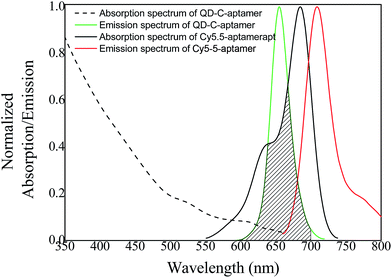
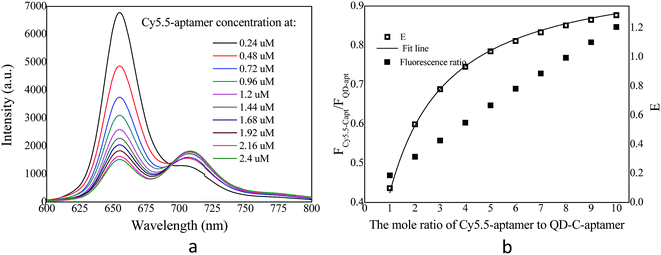
The overlap of the UV-vis absorption spectrum of the Cy5.5-aptamer with the fluorescence spectrum of the QD-C-aptamer is shown in Fig. 1. There was no crosstalk between the emissions of the QD-C-aptamer and the Cy5.5-aptamer. Thus, the typical FRET process occurred between the QD-C-aptamer and the Cy5.5-aptamer (Fig. 2), as increasing the amount of Cy5.5-aptamer decreased the QD-aptamer fluorescence. The QD-C-aptamer mixture exhibited an emission peak at 655 nm. Upon adding Cy5.5-captamer, the emission intensity changed, decreasing at 655 nm and increasing at 708 nm (Fig. 2a).Fig. 2b shows the intensity ratio of the 708 nm emission to the 655 nm emission as a function of added Cy5.5-aptamer; the y-axis represents ICy/IQD, where ICy/IQD is evaluated from I708/I655. When the added Cy5.5-aptamer was increased, the ICy/IQD value increased due to the enhanced intensity at 708 nm and quenched intensity at 655 nm. This finding indicates that energy transfer from the QD to the dye occurred in response to the increasing amount of Cy5.5-aptamer.
We fixed the QD-C-aptamer concentration at 0.24 μmol L−1 and varied the concentration of Cy5.5-aptamer from 0.2 to 6.4 μmol L−1. The value of N (i.e., the Cy5.5-aptamer/QD-C-aptamer ratio) ranged from 1 to 32. The value of E was calculated by the formula E = 1 − (IDA/ID).26 E depends on the inverse of the sixth power of the distance between the donor and acceptor pair (r) and is given by E = R06/(R06 + r6), where R0 is the Förster radius at which half of the excitation energy of the donor is transferred to the acceptor chromophores.27 The energy transfer efficiency from a QD conjugated to exactly n acceptors at a distance r from the QD centre is described as E = nR06/(nR06 + r6).28 R0 depends on the fluorescence quantum yield of the donor in the absence of an acceptor (fd), the refractive index of the solution (η), the dipole angular orientation of each molecule (κ2) and the spectral overlap integral of the donor–acceptor pair (J) and is given by R0 = 9.78 × 10³(η−4 × fd × J)1/6A0.29 The spectral overlap integral is calculated using the equation  . Here, FD(λ) is the normalized fluorescence emission spectrum of the donor at a specific wavelength, ε(λ) is the acceptor's extinction coefficient spectrum in L mol−1 cm−1, and λ is the wavelength in nm. The dipole orientation factor κ2 has a value of 2/3. The software Photochem CAD 2.1 was used to calculate the spectral overlap integrals J and the Förster radius R0, with the given parameters of n = 1.33 and ψ (quantum yield of the donor) = 0.50. R0 was calculated as 4.815 nm, and r was calculated as 5.134 nm by inputting the formula into the Origin software package and drawing the regression curve of E vs. N.
The distance between the FRET donor and acceptor determines the type of energy transfer between the QD-C-aptamer and the Cy5.5-aptamer. The resonance energy transfer mechanism of FRET and/or surface energy transfer could be responsible for quenching of the donor in the presence of acceptor.20 Since the distance of 4.815 nm is shorter than 10 nm, the quenching of QD-C-aptamer fluorescence is mainly attributable to the FRET mechanism.
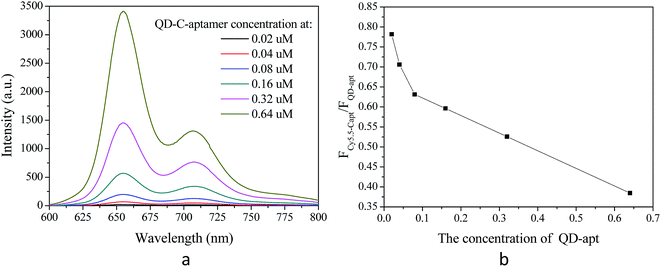
The fluorescence spectra of the QD-C-aptamer and Cy5.5-aptamer configuration are shown in Fig. 3a with a fixed Cy5.5-aptamer concentration of 2.4 μmol L−1 and QD-C-aptamer concentrations 0.01–0.5 times higher than that of the Cy5.5-aptamer. As expected, increasing the QD concentration caused the Cy5.5-aptamer signal to increase progressively. In addition, the fluorescence emission of the QD-C-aptamer continued to increase. The decreasing trend of energy transfer efficiency from the QD-C-aptamer to Cy5.5-aptamer with increasing QD concentration is shown in Fig. 3b, which plots the ICy/IQD fluorescence emission ratios as a function of Cy/QD.
3.2 Reduction of FRET efficiency by the acetamiprid
A mixture of the QD-C-aptamer and the Cy5.5-aptamer (N = 5) complex in PBS buffer solution (pH = 7.2) was used to investigate the ability of acetamiprid to restore the QD-aptamer fluorescence quenching. The original complex, with E = 0.7974 and FC/Q = 0.8438, exhibited remarkable FRET in the absence of acetamiprid. When acetamiprid was added to the complex, E and FC/Q decreased significantly. Various concentrations of acetamiprid were added to the QD-aptamer–Cy5.5 complexes, and the mixtures were incubated for 0.5 h at room temperature. The fluorescence was scanned with an emission window of 600–800 nm with excitation at 400 nm. The spectrum is shown in Fig. 4. To assess the FRET restoration efficiency using a different incubation sequence, two incubation modes of the FRET-based aptasensor were investigated: (a) co-incubation of the donor, acceptor and pesticide and (b) incubation of acceptor and pesticide before donor addition (Fig. S1†). The fluorescence intensity of the QDs at 655 nm was slightly higher prior to pesticide incubation with the Cy5.5-captamer. However, no difference in the Cy5-captamer fluorescent intensity at 708 nm was observed. These observations indicate that the pesticide did not disrupt the interaction between the QD-C-aptamer and the Cy5.5-aptamer, whereas the QD-C-aptamer disturbed the interaction between the Cy5.5-aptamer and the pesticide.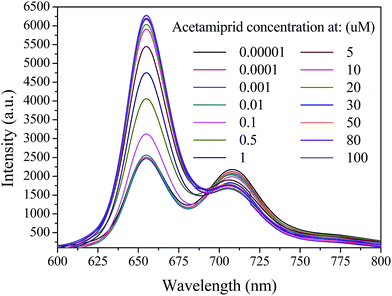 | ||
| Fig. 4 Emission spectra of 0.24 μM QD-C-aptamer and 2.4 μM Cy5.5-aptamer complexes in the presence of acetamiprid at different concentrations ranging from 10−5 to ∼102 μM. | ||
3.3 Determination of acetamiprid
The plots of E and FC/Q against the acetamiprid concentration are shown in Fig. 5. A four-parameter inhibition curve was used to quantity acetamiprid: , where A is the minimum y value, D is the maximum y value, C is the x value (acetamiprid concentration) at the point of inflection, and B is the slope factor. The quantity curve range was 0.01–10 μM, with the equation
  . The limit of detection (LOD) for acetamiprid was 0.02 μM, obtained using the calculation LOD = 3/s. The limit of quantification (LOQ) was 0.05 μM (LOQ = 10/s). To confirm the applicability of the developed method, acetamiprid was detected in spiked water samples. The recovery test was performed using the standard addition and filtering pretreatment procedure. The results are shown in Table S2.† The recoveries obtained varied from 98.0% to 103%, which confirmed that the established FRET aptasensor could be applied to acetamiprid detection.
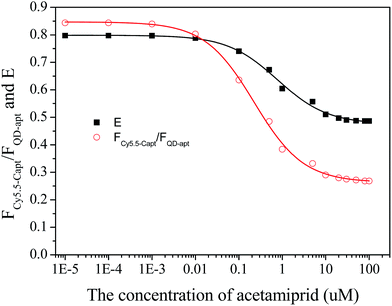 | ||
| Fig. 5 Calibration plots of the fluorescence peak intensity ratio and the FRET efficiency vs. acetamiprid concentration. | ||
For comparison, we have listed the analytical performance of different acetamiprid detection methods described in recent studies in Table S1.† Although the lowest LOD from this work is inferior to that of the electrochemical method, the broad quantitative concentration range and relatively low LOD are merits of the present method.
3.4 Assessment of Kd
The FRET configuration can also be adopted to assess the Kd between acetamiprid and the aptamer. As more acetamiprid molecules are introduced into the QD-aptamer–Cy5.5 system, the FRET efficiency decreases. A 2.4 μM solution of Cy5.5-aptamer sequence was incubated with different concentrations of acetamiprid before adding the QD-aptamer. We calculated n based on the E value using the equation described above. Then, the combined and free pesticide molecules were determined in the presence of various concentrations of added acetamiprid.The equation B = B0KbF/(1 + KbF) can be used to measure the association constant of ligand to its target.30 As for the aptamer of acetamiprid, Liu and co-workers24 assessed the dissociation constant of aptamer to acetamiprid by transfer this equation into B/F = −Kb × B + B0 × Kb, where Kb is reciprocal of Kd. We assumed Kd based on the equation B/F = −1/Kd × B + B0/Kd, where B is the concentration of the complex, F is the concentration of free acetamiprid, B/F is the binding ratio, Kd is the dissociation constant, and B0 is the net binding sites at saturation.30 The results are shown in Fig. 6. A total of 0.75 μM aptamer/target complexes can be formed in a mixture of 5 μM ssDNA and 10 μM target.24 Approximately 0.76 μM binding complexes were generated when 2.4 μM Cy5.5-aptamer solution was incubated with 10 μM acetamiprid. This assay yielded a similar Kd value of 0.58 μmol L−1, as calculated using Origin software. Interestingly, there were two entirely different slopes in the Scatchard plots (Fig. S2†). In addition, the Kd1 for nonspecific binding (0.046 μmol L−1) was significantly lower than that for specific binding (with Kd2 = 0.60 μmol L−1). Thus, there was very strong binding of the specific aptamer with acetamiprid.
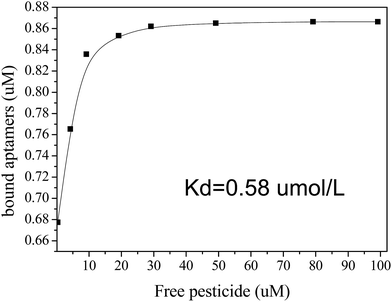 | ||
| Fig. 6 Determination of the dissociation constant (Kd) of the Cy5.5-aptamer complex and acetamiprid. | ||
4. Conclusion
In conclusion, the FRET configuration comprised a combination of QD-C-aptamer and Cy5.5-aptamer and was arranged concentrically around a QD with fluorescence emission centred at 655 nm. A biosensor based on this FRET configuration was proposed to detect acetamiprid through the binding of the complementary aptamer to the QDs and the aptamer of acetamiprid to Cy5.5 dye. The sensor was applied to detect acetamiprid in water in the concentration range of 0.05–1 μM with a recovery of 98–103%. This contribution provides a promising tool for organophosphorus pesticide determination and will trigger broad applications of FRET aptamer sensors for small-molecule contamination.Acknowledgements
The authors acknowledge financial support from the National Natural Science Foundation of China (No. 21205001), the Natural Science Foundation of Anhui Province (No. 1208085 MB16), the Key Technologies Research and Development Program of China (No. 2012BAJ08B03), and the Competitive Project from Huizhou Construction Engineering Technology Research Center (No. 2012 hjy-04).References
- W. Aktar, D. Sengupta and A. Chowdhury, Interdiscip. Toxicol., 2009, 2, 1–12 CrossRef PubMed.
- H. Takahashi, N. Takakusa, J. Suzuki and T. Kishimoto, J. Pestic. Sci., 1998, 23, 193–198 CrossRef CAS.
- T. Yamada, Abstr. Pap. Am. Chem. Soc., 1997, 214, 17–AGRO Search PubMed.
- J. C. Mo, C. Y. Pan, S. M. Zhang, C. R. Chen, H. Y. He and J. A. Cheng, J. Pestic. Sci., 2005, 30, 187–191 CrossRef CAS.
- L. Chen, J.-F. Wang, P. Du, X.-G. Tang, K.-X. Zhao and C.-P. Pan, Chin. J. Anal. Chem., 2008, 36, 1364–1368 CAS.
- M. Tokieda, M. Ozawa and T. Gomyo, J. Pestic. Sci., 1999, 24, 181–185 CrossRef CAS.
- C. Sirtori, A. Agueera, I. Carra and J. A. Sanchez Perez, Anal. Bioanal. Chem., 2014, 406, 2549–2558 CrossRef CAS PubMed.
- Z. Lin, L. Huang, G. Chen and S. P. Chin, J. Chromatogr., 2009, 27, 9–18 CAS.
- E. Watanabe, S. Miyake, K. Baba, H. Eun and S. Endo, Anal. Bioanal. Chem., 2006, 386, 1441–1448 CrossRef CAS PubMed.
- L. Fan, G. Zhao, H. Shi, M. Liu and Z. Li, Biosens. Bioelectron., 2013, 43, 12–18 CrossRef CAS PubMed.
- K. Zhang, T. Yu, F. Liu, M. Sun, H. Yu, B. Liu, Z. Zhang, H. Jiang and S. Wang, Anal. Chem., 2014, 86, 11727–11733 CrossRef CAS PubMed.
- K. Zhang, Q. Mei, G. Guan, B. Liu, S. Wang and Z. Zhang, Anal. Chem., 2010, 82, 9579–9586 CrossRef CAS PubMed.
- X. Yan, H. Li, X. Wang and X. Su, Talanta, 2015, 131, 88–94 CrossRef CAS PubMed.
- W. Hu, Q. Chen, H. Li, Q. Ouyang and J. Zhao, Biosens. Bioelectron., 2016, 80, 398–404 CrossRef CAS PubMed.
- H. Zhang, P. G. Stockley and D. Zhou, Faraday Discuss., 2011, 149, 319–332 RSC.
- M. Yuce, N. Ullah and H. Budak, Analyst, 2015, 140, 5379–5399 RSC.
- X. Li, R. Cheng, H. Shi, B. Tang, H. Xiao and G. Zhao, J. Hazard. Mater., 2016, 304, 474–480 CrossRef CAS PubMed.
- L. Fan, G. Zhao, H. Shi, M. Liu, Y. Wang and H. Ke, Environ. Sci. Technol., 2014, 48, 5754–5761 CrossRef CAS PubMed.
- J. Xu, Y. Li, L. Wang, Y. Huang, D. Liu, R. Sun, J. Luo and C. Sun, Dyes Pigm., 2015, 123, 55–63 CrossRef CAS.
- Y. Liu, J. Yu, Y. Wang, Z. Liu and Z. Lu, Sens. Actuators, B, 2016, 222, 797–803 CrossRef CAS.
- N. Duan, W. Gong, Z. Wang and S. Wu, Anal. Methods, 2016, 8, 1390–1395 RSC.
- N. Duan, S. Wu, S. Dai, T. Miao, J. Chen and Z. Wang, Microchim. Acta, 2015, 182, 917–923 CrossRef CAS.
- J. Tang and L. Xiang, Pol. J. Environ. Stud., 2016, 25, 787–793 CrossRef.
- J. He, Y. Liu, M. Fan and X. Liu, J. Agric. Food Chem., 2011, 59, 1582–1586 CrossRef CAS PubMed.
- B. Lin, Y. Yu, R. Li, Y. Cao and M. Guo, Sens. Actuators, B, 2016, 229, 100–109 CrossRef CAS.
- W. R. Algar, M. G. Ancona, A. P. Malanoski, K. Susumu and I. L. Medintz, ACS Nano, 2012, 6, 11044–11058 CrossRef CAS PubMed.
- T. Förster, J. Biomed. Opt., 2012, 17, 011002 CrossRef PubMed.
- T. Pons, I. L. Medintz, X. Wang, D. S. English and H. Mattoussi, J. Am. Chem. Soc., 2006, 128, 15324–15331 CrossRef CAS PubMed.
- A. R. Clapp, I. L. Medintz and H. Mattoussi, ChemPhysChem, 2006, 7, 47–57 CrossRef CAS PubMed.
- Q. G. Wang, Y. M. Wang, G. A. Luo and S. B. Yang, Chin. J. Anal. Chem., 2000, 28, 731–734 CAS.
Footnote |
| † Electronic supplementary information (ESI) available. See DOI: 10.1039/c6ra26118c |
| This journal is © The Royal Society of Chemistry 2017 |

