 Open Access Article
Hydrothermal synthesis of TiO2 nanoparticles doped with trace amounts of strontium, and their application as working electrodes for dye sensitized solar cells: tunable electrical properties & enhanced photo-conversion performance†
Hadja Fatima Mehnane ,
Changlei Wang,
Kiran Kumar Kondamareddy,
Wenjing Yu,
Weiwei Sun,
Haimin Liu,
Sihang Bai,
Wei Liu*,
Shishang Guo* and
Xing-Zhong Zhao*
School of Physics and Technology, Key Laboratory of Artificial Micro/Nano Structures of Ministry of Education, Wuhan University, Wuhan 430072, China. E-mail: xzzhao@whu.edu.cn; gssyhx@whu.edu.cn; wliu@whu.edu.cn
First published on 12th January 2017
Abstract
Strontium (Sr) doped TiO2 nanoparticles are investigated with a view to studying the performance parameters of dye sensitized solar cells (DSSCs). Sr is used in trace levels (parts per million, ppm hereafter). The Sr doped TiO2 and undoped TiO2 nanoparticles are synthesized by the hydrothermal method and thin films of TiO2 electrodes are prepared using these particles (average grain size of 24 nm). The electrodes are characterized by X-ray diffraction (XRD), Scanning Electron Microscopy (SEM), surface area (BET) and UV-vis absorption spectrometry. DSSCs are fabricated using the doped and undoped TiO2 nanoparticle photoanodes. Their photovoltaic characteristics are studied by employing J–V measurements and electrochemical impedance spectroscopy (EIS). XRD studies reveal that the doping of Sr into the TiO2 lattice slightly inhibits the growth of the particles and causes lattice distortions. The optical studies indicate a reduction in band-gap upon doping of TiO2 films and a simultaneous enhancement in the photocurrent density (Jsc) and the photovoltage (Voc). The photoanode doped with 50 ppm Sr exhibits the highest power conversion efficiency (PCE) of about 7.88% which is 12.73% higher than that of undoped TiO2 cells. The effect of the Sr dopant on electron transport is studied by using EIS measurements. An improvement in electron life time is observed on the doping of TiO2.
1. Introduction
Low cost solar power harvesting on a massive scale is a challenge which has led to the development of new photovoltaic technologies that pave the way for affordable renewable energy. One of the leading solar cell candidates is the dye sensitized solar cell (DSSC).1–3 DSSCs based on nanocrystalline TiO2 photoanodes have been regarded as one of the most promising alternatives to conventional solar cells due to their low cost, ease of fabrication, environmentally friendly nature and flexibility of design in view of their colors and transparencies and relatively high power conversion efficiencies (PCEs). These features make DSSCs the ideal photovoltaic devices for commercial applications,4,5 and extensive research has been devoted to the development of high performance DSSCs.6 The usage of a mesoporous TiO2 n-type semiconductor electrode in DSSCs as a photoanode of high internal surface area has led to a step change in the fields of photoelectrochemistry and photovoltaics. For state-of-the-art DSSCs, the architecture of the mesoporous TiO2 electrode in the devices has seen much improvement since 1991, in terms of light absorption, light scattering, charge transport, suppression of charge recombination and alteration of the interfacial energetics.5 TiO2 is still the most successfully used wide band gap oxide material among other wide band semiconductor oxides such as ZnO, SnO2, Nb2O5 and SrTiO3, due to its stability, non-toxicity and highly refractive nature.7 Therefore the development of advanced photovoltaic anode materials that effectively utilize solar energy from the visible region is an appealing challenge, particularly for DSSC applications, as the light absorption and charge collection take place at the dye sensitized mesoporous photoanode.8,9 One of the effective ways to tailor the electronic properties of TiO2 photoanodes is by deliberately inserting impurities into the TiO2 lattice.10 Such doping is also important in improving the performance of other kinds of mesoscopic solar cells.11,12 Doping of DSCCs with TiO2 is expected to control the morphology of the TiO2 with the prospect of maximizing both the dye/TiO2 interface area and the light absorption.13,14Metallic15–17 and non-metallic elements18,19 are used in doping of TiO2 photoanodes. Doping by rare earth and transition metal ions, in particular, are reported by many researchers. However, studies on alkaline earth metal ion doped TiO2 nanoparticles for DSSC photoanode applications, and investigations on their photovoltaic properties have rarely been carried out. The alkaline earth metals are interesting cationic dopants as they might donate s electrons from their outer shells when they are introduced into TiO2 nanocrystals.12 Peng et al.20 reported that the substitution of Mg2+ ions into the anatase lattice affected its band edge movement and charge recombination and improved the open circuit voltage (Voc) of DSSCs. Liu et al.21 demonstrated that Ca doped TiO2 photoanodes showed a positive shift in flat band potential of TiO2 which caused an increase in efficiency of electron injection and improved electron transport properties. Sr doped TiO2 electrodes of nanotube arrays were fabricated to improve the photo-conversion efficiency for water splitting applications.22 Sr doped TiO2 nanoparticles have been employed as photocatalysts where they showed enhanced photocatalytic activity due to their high surface area, improved charge transfer rate at the solid–liquid interface and suppression of electron–hole pair recombination.23 DSSCs based on TiO2 nanotube arrays that had been surface treated by strontium oxide (SrO) showed a higher photovoltaic performance.24 However, a study of TiO2 nanoparticles doped with the alkaline earth element Sr at ppm level concentrations for photoanodes of DSSCs has not previously been reported. Therefore the present investigations are aimed at employing a Sr doped TiO2 photoanode and studying its influence on the photovoltaic performance of DSSCs. For the first time, the authors report on TiO2 nanoparticles doped with trace amounts (several parts per million (ppm)) of Sr for DSSC applications. The photoanodes were prepared by the hydrothermal method and characterized by X-ray diffraction (XRD), scanning electron microscopy (SEM), and UV-visible absorption spectrometry. The influence of the dopant Sr on the electron transport and recombination processes in the photoanode is monitored by J–V characterisation studies and electrochemical impedance spectroscopy (EIS) measurements. It is found that doping with trace amounts of Sr is effective in enhancing the short circuit current density (Jsc) and Voc simultaneously which contribute to a significant improvement in the conversion efficiency for DSSCs.
2. Experimental section
2.1. Materials
Titanium isopropoxide (TTIP, Ti[OCH(CH3)2]4) and strontium nitrate (Sr(NO3)2·9H2O) were used as precursors of Ti and Sr respectively. In order to set the concentration of the solutions, following the earlier report,25 two kinds of ethyl cellulose were employed to prepare an ethanolic mixture. Fluorine doped SnO2 conductive glass (FTO, sheet resistance 10–15 U sq.−1; Asahi Glass, Japan), N719 dye (Solaronix, Switzerland), iodine (12, 99.8%; Beijing Yili chemicals, China); lithium iodide (LiI, 99%), guanidine thiocyanate (GNCS) and 4-tert-butylpyridine (TBP) (Acros); and propylene carbonate (PC; Sinopharm Chemical Reagent Corporation, China) were used as received without any modifications.2.2. Synthesis of TiO2 and Sr doped TiO2 paste
The pure and Sr doped TiO2 pastes were prepared using the hydrothermal method as described elsewhere.18 In a typical synthesis process, 2.1 g of acetic acid was dispersed into 10 ml of titanium isopropoxide (TTIP) using ultrasonic mixing for 10 min and the dispersion was then quickly dropped into 50 ml of deionized water under stirring to start the hydrolysis reaction. After 1 hour, Sr precursors of various trace concentrations (molar ratios: 20 ppm, 50 ppm, 80 ppm) were added to TTIP hydrolyzed solutions to prepare doped TiO2 samples (and an undoped TiO2 sample was also prepared). The hydrolysis was continued under vigorous stirring for 3 h at room temperature. Then 0.68 ml of nitric acid was added to each resultant precursor solution under continuous stirring. The temperature was maintained at a constant 80 °C for 4 h to obtain transparent solutions which were then filtered to wipe off insoluble impurities. The volume of each solution was adjusted to 68 ml by adding deionized water and each sample was then heated at 220 °C in a 100 ml autoclave for 12 h. After the hydrothermal process 0.4 ml of nitric acid was added to each sol–gel and it was stirred for 5 h. Finally each sol–gel was dispersed ultrasonically. In order to get final pure and Sr doped TiO2 nanoparticles, the dispersed sol–gels were centrifuged and then dispersed in ethanol, ethyl cellulose and terpineol successively after proper drying. The mixtures were pulverized in an agate vial using a ball mill (QM-3SP2) for 12 h and sonicated for 30 min. These steps were alternately repeated three times in order to obtain homogenous solutions. During the pulverization, a plastic deformation of the TiO2 crystal lattice took place which resulted in stresses and strains that distorted the lattice and formed many defects in the TiO2 particles. Furthermore, the high surface energy and lattice distortion energy facilitated the achievement of the required activation energy for atomic and ionic diffusion at room temperature. The collisions that occurred among the grains of powder and the balls of the mixer mill caused a rise in interface temperature which induced the homogeneous incorporation of dopants. After the pulverization, ethanol was removed from the mixtures using rotary evaporation to extract the final pastes of pure and Sr doped TiO2.2.3. Preparation of the photoelectrodes and different DSSC devices
Films of uniform thickness were obtained by coating the pure and Sr doped TiO2 pastes onto the FTO using the doctor-blade method. The films were dried on a hotplate at 125 °C and then sintered for 30 min at 500 °C in an oven to obtain the mesoporous electrodes. A TiO2 scattering layer26 was added to each electrode using the doctor blade method, and this was followed by annealing at 500 °C for 30 min. The pre-heated (125 °C for 30 min) mesoporous electrodes were then immersed in 0.5 mM ethanolic N719 solution at room temperature for 24 h and were washed with ethanol to remove the excess dye molecules. After ensuring that the nanocrystalline TiO2 electrodes were covered by a monolayer of dye molecules, the electrodes were dried at 60 °C in air. Finally DSSCs were fabricated by sandwiching the electrolyte27 layer between a N719 dye-loaded photoelectrode and Pt-coated FTO counter electrode. The Pt counter electrode was prepared by the sputtering method while the liquid electrolyte solution was prepared by dissolving 0.05 M LiI (lithium iodide, 99%), 0.03 M I2 (iodine, 99.8%), 0.01 M PMII (1-methyl-3-propyl imidazolium iodide), 0.1 M GNCS (guanidine thiocyanate) and 0.5 M TBP (4-tert-butylpyridine) into a solvent composed of acetonitrile and PC (volume ratio: 1![[thin space (1/6-em)]](https://www.rsc.org/images/entities/char_2009.gif) :
:![[thin space (1/6-em)]](https://www.rsc.org/images/entities/char_2009.gif) 4).
4).
2.4. Characterization of DSSCs
The actual concentrations of Sr dopant were measured using inductively coupled plasma atomic emission spectroscopy (ICP-AES) [ESI, Table 1†] which confirmed that the concentrations were in the ppm range, albeit at lower levels than had been added to the precursor solutions. The structural analysis of the pure and Sr doped TiO2 photoanodes was carried out by XRD studies, SEM and UV-vis spectroscopy. XRD patterns of the photoanodes were recorded using a Bruker XRD system (D8 Advanced, Germany) employing Cu Kα radiation. The morphology of the samples was monitored by field emission (FE)-SEM (Sirion, FEG). Specific surface area, pore volume, and pore size diameter were measured using nitrogen adsorption–desorption isotherms at 77 K obtained using a JW-BK122W analyzer (China). The optical absorption spectra were taken in the range of 300–800 nm using UV-vis spectrophotometry (Lambda 650S PerkinElmer). The amounts of dye loaded on the photoanodes were measured from the UV-vis spectra of the dye desorbed from the as prepared photoanodes upon immersion in an aqueous solution of NaOH (0.1 M). X-ray photoelectron spectroscopy (XPS) was carried out on a Thermo Fisher ESCALAB 250Xi, employing monochromatic Al Kα radiation (1486.68 eV), an ultrahigh vacuum under CAE mode with a pass energy of 20 eV and a step size of 0.05 eV. The binding energies were calibrated with respect to the carbon (C1s) peak (284.8 eV). Photovoltaic measurements of the devices were performed using a solar simulator CHI660C electrochemical workstation (CH Instruments, Shanghai, China), which provides AM 1.5 G illumination with an equivalent light intensity of 1000 W m−2 (under 1 Sun illumination) at room temperature. The irradiated area of each cell was confined to 0.25 cm2 by using a light tight metal mask.3. Results and discussion
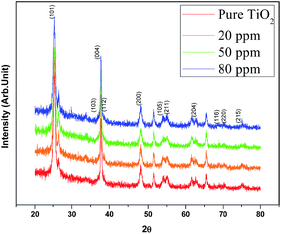
XRD patterns of the Sr doped and undoped TiO2 films are shown in Fig. 1. The well resolved sharp peaks indicate that the samples are crystallized into the anatase phase which was stable even after doping, implying that the doping with Sr has no effect on the phase structure of TiO2. Kumaresan et al.23 have reported similar results in which Sr did not promote an anatase to rutile transformation. The average crystallite size of the crystalline anatase was calculated by the Scherrer equation:28
 | (1) |
The surface morphologies of the pure and Sr doped (50 ppm) TiO2 films are illustrated in Fig. 2(A) and (B), respectively. The morphology of both samples is highly crystalline which is in good agreement with the XRD results. It can also be seen from the SEM images that the photoelectrodes have typical porous structures. The average size of the nanoparticles is in the range of 20–30 nm. The cross section morphology of the films is provided in Fig. 2(c). The thickness of the films measured from SEM images is found to be around (12 μm ± 0.5).
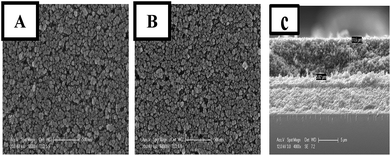 | ||
| Fig. 2 SEM images displaying the surface morphologies of undoped photoanode (A) and the Sr doped TiO2 photoanode (B); SEM image showing the cross section morphology of the films (C). | ||
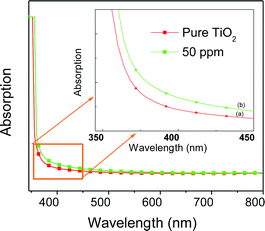
The results of BET specific surface area values for doped and undoped samples are listed in Table 1. All the samples possess quite high specific surface area values, ranging from about 60 to 80 m2 g−1. The mean pore size diameter calculated by the BJH method is around 16–24 nm for all of the samples. A clear correlation exists among the various morphological parameters. The Sr doped TiO2 photoanodes display higher pore size diameters, which increase up to 50 ppm of dopant, indicating that the doped samples may be more efficient compared to the undoped one with respect to dye loading. Additionally the measurements of pore size diameter show that 50 ppm doped samples have the most uniform structure, which might be attributed to their porous morphology. These parameters can influence the absorption capability of the photoanodes. Fig. 3 shows the UV-visible absorption spectra of undoped and Sr doped TiO2 films. The absorption curve of Sr doped (50 ppm) TiO2 film is red shifted relative to the undoped TiO2 film. The red shift of the absorption edge suggests a reduction of the energy band gap. The Tauc model33 was employed to determine the optical band gap energy using the following equation:
| αhν = A(hν − Eg)r | (2) |
| Sample ppm | Specific surface area m2 g−1 | Pore volume cm3 g−1 | Pore size diameter nm |
|---|---|---|---|
| 0 | 77.13 | 0.537 | 16.237 |
| 20 | 82.66 | 0.726 | 16.616 |
| 50 | 77.10 | 0.819 | 24.733 |
| 80 | 61.46 | 0.559 | 22.430 |
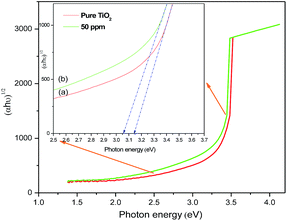 | ||
| Fig. 4 Plots of (αhν)1/2 vs. photon energy of (a) pure TiO2 and (b) Sr (50 ppm) doped TiO2 photoanodes. | ||
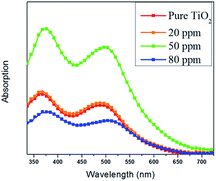
The adsorbed amount of dye for each film was determined by UV-vis absorption measurements. UV-vis absorption spectra of the desorbed dye from TiO2 films measured in NaOH solution are shown in Fig. 5. It can be noted that the 50 ppm Sr doped TiO2 film has the strongest dye absorption peak around 340–550 nm, indicating the higher dye loading in this film compared with that of the pure TiO2, 20 ppm, and 80 ppm films. The variation in pore volume and pore size diameter can be directly correlated to dye loading. The high dye loading exhibited by the 50 ppm Sr doped TiO2 film can be attributed to its bigger pore volume and pore size.
XPS core level spectra of the undoped and doped TiO2 nanoparticles for Sr are shown in the ESI [Fig. 1(a)–(e)].† It is difficult to find Sr in the Sr3d, Sr3s, and Sr3p regions as Sr is at ppm range. It is also difficult to identify the peaks corresponding to Sr4p and Sr4s from the regions of O2s and Ti3p as the peaks of Sr are superimposed by O and Ti peaks, respectively. However, it is found that peaks related to the O2s and Ti3p are shifted to higher binding energies with doping of up to 50 ppm Sr, and returned to lower binding energies for 80 ppm Sr which indicates an influence of the incorporated Sr dopant.
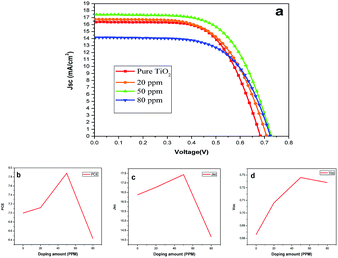
Fig. 6(a) represents the J–V characteristics of DSSCs of undoped and Sr doped TiO2 photoanodes. The photovoltaic parameters including Voc, Jsc, fill factor (FF), and PCE are listed in Table 2. Compared with the pure TiO2, the Sr doped TiO2 photoanodes showed better photovoltaic performances. A maximum PCE of 7.88% was obtained for the 50 ppm Sr doped TiO2 based DSSC which is an improvement of 12.73% relative to that of the DSSC based on the pure TiO2 photoanode. Fig. 6(b) shows the varying PCEs of the DSSCs of undoped and doped TiO2 films. A significant improvement in the Jsc values was observed for DSSCs of TiO2 nanoparticle electrodes doped with 20 or 50 ppm Sr. The Jsc of the DSSC is increased from 16.37 mA cm−2 (undoped TiO2) to a maximum value of 17.43 mA cm−2 for the 50 ppm Sr doped TiO2 cell (Fig. 6(c)). This enhancement in Jsc is one of the reasons for improved efficiency.36 Fig. 6(d) illustrates the variation of Voc with different concentrations of dopant. The value of Voc increased from 0.683 V for the pure TiO2 cell to 0.728 V for the 50 ppm Sr doped cell, and then decreased to 0.724 V for the 80 ppm Sr doped cell. The simultaneous improvement of Jsc and Voc values has been reported by many researchers.24,30,34
| Doping amount (ppm) | Jsc (mA cm−2) | Voc (V) | PCE (%) | FF (%) |
|---|---|---|---|---|
| 0 | 16.37 | 0.683 | 6.99 | 0.62 |
| 20 | 16.77 | 0.708 | 7.11 | 0.59 |
| 50 | 17.43 | 0.728 | 7.88 | 0.62 |
| 80 | 14.16 | 0.724 | 6.43 | 0.62 |
The improvement in Jsc is due to both the narrowed band gap of the 50 ppm Sr doped TiO2 that facilitates the better photoexcitation of the semiconductor, and the increased dye absorption. The efficient photoexcitation of TiO2 and enhanced photo-injection contributes to the higher electron density. Furthermore, the introduction of Sr2+ leads to the generation of oxygen vacancies, as expressed by the following equation:37
These oxygen vacancy lattice defects, resulting from the substitution of Sr2+ in the sites of Ti4+, can trap photo-generated holes, elongating the life of the photo-excited electrons and holes and thereby increasing Jsc.23,29,30,34 The life times of the photon excited charges were measured using EIS studies and are presented in the next section. The increase in Voc for Sr doped TiO2 samples up to 50 ppm is due to the enhancement in the number of electrons being injected and/or the suppression of recombination of injected electrons. The substitution of Ti4+ ions by Sr2+ leads to the distortion of TiO6 octahedra and the introduction of oxygen vacancies thus generating dipole moments as well as internal polarization fields in the structure which facilitate the better charge separation efficiency of photo-generated electrons and holes38 and decrease the recombination probability.39 All of the above reasons are beneficial for a higher Voc.
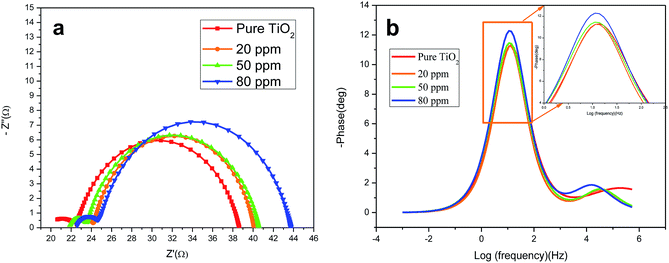
EIS was carried out in the frequency range of 0.1 to 105 Hz to investigate the effect of Sr doping on the charge transport properties of the DSSCs. Based on the theoretical analysis of charge transport, the experimental data were fitted to the equivalent circuit model of the DSSCs which is given in Scheme 1. The EIS parameters of the DSSCs determined by fitting the experimental data to the equivalent circuit model are given in Table 3. EIS plots (Fig. 7(a)) of the cells of doped and undoped TiO2 taken at the applied bias of Voc under one Sun illumination contain two semicircles. The smaller semicircle in the high frequency region is attributed to the charge transfer resistance (R2) at the two respective interfaces (electrolyte/Pt counter electrode) and (FTO/TiO2) and the larger semicircle in the low frequency region is mainly related to the charge recombination resistance R3 across the TiO2/electrolyte interface with a partial contribution from electron transport and accumulation in TiO2 photoanodes.39
| Electrodes (ppm) | R1 | R2 | R3 | fmax | τe (ms) |
|---|---|---|---|---|---|
| 0 | 19.48 | 3.227 | 16.642 | 13.803 | 11.533 |
| 20 | 22.49 | 1.751 | 16.882 | 11.220 | 14.18 |
| 50 | 21.80 | 1.737 | 17.681 | 7.413 | 21.47 |
| 80 | 22.53 | 2.239 | 19.129 | 9.120 | 17.45 |
The Nyquist plots show that the resistance related to electron recombination (R3) increases with Sr content. The R3 values are 16.642 Ω, 16.882 Ω, 17.681 Ω, 19.129 Ω for the undoped and 20 ppm Sr, 50 ppm Sr and 80 ppm Sr doped TiO2 based cells, respectively. The higher values of R3 indicate reduced electron recombination in Sr doped electrodes.40 The life time (τe) of the photoelectrons is estimated using the relation:41
 | (3) |
4. Conclusions
The present work provides a characterization of the effect of dopant (at very low concentrations) on the structural and electronic properties of TiO2 nanocrystalline photoanodes for DSSC applications, and describes significant improvements in the performance of DSSCs. XRD and SEM studies reveal the formation of lattice distortions and crystal defects introduced by Sr insertion. Moreover, Sr doping leads to a reduction in the energy band gap of TiO2 which plays an essential role in enhancing the performance parameters of the devices. The dye adsorption is improved by doping as a consequence of increased pore volume and pore diameter. DSSCs fabricated using a series of Sr doped TiO2 photoanodes, show an overall conversion efficiency of 7.88% at 50 ppm Sr doping, which is 12.73% higher than that of cells made of pure TiO2. In addition, the values of Jsc and Voc of Sr doped TiO2 photoanodes increase simultaneously with increasing concentration of Sr dopant up to 50 ppm. Recombination of charges is effectively suppressed by doping TiO2 with Sr. The highest electron life time is achieved for 50 ppm Sr doped TiO2. Thus it is reasonable to infer that the Sr doped TiO2 may be developed as a promising material for future photo-conversion energy devices.Acknowledgements
This work is financially supported by the National Basic Research Program of China (2011CB933300), the National Natural Science Foundation of China (Grants 51132001, 61474084, 51272184 and 81272443), the Fundamental Research Funds for the Central Universities (Grant 2014202020202), the Ph.D. Programs Foundation of the Ministry of Education of China (No. 20130141110059), the National Science Fund for Talent Training in Basic Science (No. J1210061), and the Fundamental Research Funds for the Central Universities (2042014kf0235).Notes and references
- M. Jørgensen, J. E. Carlé, R. R. Søndergaard, M. Lauritzen, N. A. Dagnæs-Hansen, S. L. Byskov, T. R. Andersen, T. T. Larsen-Olsen, A. P. Böttiger and B. Andreasen, Sol. Energy Mater. Sol. Cells, 2013, 119, 84–93 CrossRef.
- M. Graetzel, R. A. Janssen, D. B. Mitzi and E. H. Sargent, Nature, 2012, 488, 304–312 CrossRef CAS PubMed.
- A. Hagfeldt, G. Boschloo, L. Sun, L. Kloo and H. Pettersson, Chem. Rev., 2010, 110, 6595–6663 CrossRef CAS PubMed.
- B. O'Regan and M. Grätzal, Nature, 1991, 353, 737–740 CrossRef.
- N. Tétreault and M. Grätzel, Energy Environ. Sci., 2012, 5, 8506–8516 Search PubMed.
- S. Mathew, A. Yella, P. Gao, R. Humphry-Baker, B. F. Curchod, N. Ashari-Astani, I. Tavernelli, U. Rothlisberger, M. K. Nazeeruddin and M. Grätzel, Nat. Chem., 2014, 6, 242–247 CrossRef CAS PubMed.
- X. Xu, S. Bai, Y. Fang, A. Chen, D. Li and Y. Lin, Electrochim. Acta, 2014, 145, 286–290 CrossRef CAS.
- Y. J. Kim, M. H. Lee, H. J. Kim, G. Lim, Y. S. Choi, N. G. Park, K. Kim and W. I. Lee, Adv. Mater., 2009, 21, 3668 CrossRef CAS.
- J. Wu, Z. Lan, J. Lin, M. Huang, Y. Huang, L. Fan and G. Luo, Chem. Rev., 2015, 115, 2136–2173 CrossRef CAS PubMed.
- R. L. Hoye, K. P. Musselman and J. L. MacManus-Driscoll, APL Mater., 2013, 1, 060701 CrossRef.
- F. Giordano, A. Abate, J. P. C. Baena, M. Saliba, T. Matsui, S. H. Im, S. M. Zakeeruddin, M. K. Nazeeruddin, A. Hagfeldt and M. Grätzel, Nat. Commun., 2016, 7, 10379 CrossRef CAS PubMed.
- B. Roose, S. Pathak and U. Steiner, Chem. Soc. Rev., 2015, 44, 8326–8349 RSC.
- Z.-S. Wang, H. Kawauchi, T. Kashima and H. Arakawa, Coord. Chem. Rev., 2004, 248, 1381–1389 CrossRef CAS.
- X. Chen and S. S. Mao, Chem. Rev., 2007, 107, 2891–2957 CrossRef CAS PubMed.
- Y. Duan, N. Fu, Q. Liu, Y. Fang, X. Zhou, J. Zhang and Y. Lin, J. Phys. Chem. C, 2012, 116, 8888–8893 CAS.
- J. Zhang, W. Peng, Z. Chen, H. Chen and L. Han, J. Phys. Chem. C, 2012, 116, 19182–19190 CAS.
- J. J. Teh, S. L. Ting, K. C. Leong, J. Li and P. Chen, ACS Appl. Mater. Interfaces, 2013, 5, 11377–11382 CAS.
- Y. Xie, N. Huang, S. You, Y. Liu, B. Sebo, L. Liang, X. Fang, W. Liu, S. Guo and X.-Z. Zhao, J. Power Sources, 2013, 224, 168–173 CrossRef CAS.
- T. Ma, M. Akiyama, E. Abe and I. Imai, Nano Lett., 2005, 5, 2543–2547 CrossRef CAS PubMed.
- T. Peng, K. Fan, D. Zhao and J. Chen, J. Phys. Chem. C, 2010, 114, 22346–22351 CAS.
- Q. Liu, Y. Zhou, M. Wang, X. Zhao and Y. Lin, J. Alloys Compd., 2013, 548, 161–165 CrossRef CAS.
- H. A. Hamedani, N. K. Allam, H. Garmestani and M. A. El-Sayed, J. Phys. Chem. C, 2011, 115, 13480–13486 CAS.
- L. Kumaresan, M. Mahalakshmi, M. Palanichamy and V. Murugesan, Ind. Eng. Chem. Res., 2010, 49, 1480–1485 CrossRef CAS.
- J.-G. Chen, C.-Y. Chen, C.-G. Wu, C.-Y. Lin, Y.-H. Lai, C.-C. Wang, H.-W. Chen, R. Vittal and K.-C. Ho, J. Mater. Chem., 2010, 20, 7201–7207 RSC.
- S. Ito, T. N. Murakami, P. Comte, P. Liska, C. Grätzel, M. K. Nazeeruddin and M. Grätzel, Thin Solid Films, 2008, 516, 4613–4619 CrossRef CAS.
- H. Liu, L. Liang, T. Peng, H. F. Mehnane, B. Sebo, S. Bai, Z. Yu, W. Yu, W. Liu and S. Guo, ElectrochimicaActa, 2014, 132, 25–30 CrossRef CAS.
- S. Bai, L. Liang, C. Wang, H. F. Mehnane, C. Bu, S. You, Z. Yu, N. Cheng, H. Hu and W. Liu, J. Power Sources, 2015, 280, 430–434 CrossRef CAS.
- R. van de Krol, A. Goossens and E. A. Meulenkamp, J. Electrochem. Soc., 1999, 146, 3150–3154 CrossRef CAS.
- H. A. Hamedani, N. K. Allam, M. A. El-Sayed, M. A. Khaleel, H. Garmestani and F. M. Alamgir, Adv. Funct. Mater., 2014, 24, 6783–6796 CrossRef CAS.
- A. Bakhshayesh and N. Bakhshayesh, J. Colloid Interface Sci., 2015, 460, 18–28 CrossRef CAS PubMed.
- T. j. Chen and P. Shen, J. Phys. Chem. C, 2008, 113, 328 Search PubMed.
- L.-L. Long, A.-Y. Zhang, J. Yang, X. Zhang and H.-Q. Yu, ACS Appl. Mater. Interfaces, 2014, 6, 16712–16720 CAS.
- J. Tauc, Amorphousand Liquid, PlenumPress, London, NewYork, 1st edn, 1974 Search PubMed.
- A. Bakhshayesh and N. Bakhshayesh, Mater. Sci. Semicond. Process., 2016, 41, 92–101 CrossRef CAS.
- S. Naraginti, T. Thejaswini, D. Prabhakaran, A. Sivakumar, V. Satyanarayana and A. A. Prasad, Spectrochim. Acta, Part A, 2015, 149, 571–579 CrossRef CAS PubMed.
- Q. Liu, Electrochim. Acta, 2014, 129, 459–462 CrossRef CAS.
- W. Li, J. Yang, J. Zhang, S. Gao, Y. Luo and M. Liu, Mater. Res. Bull., 2014, 57, 177–183 CrossRef CAS.
- Y. J. Kim, M. H. Lee, H. J. Kim, G. Lim, Y. S. Choi, N. G. Park, K. Kim and W. I. Lee, Adv. Mater., 2009, 21, 3668–3673 CrossRef CAS.
- Z. Zhao and Q. Liu, J. Phys. D: Appl. Phys., 2008, 41, 085417 CrossRef.
- W. Sun, X. Sun, T. Peng, Y. Liu, H. Zhu, S. Guo and X.-Z. Zhao, J. Power Sources, 2012, 201, 402–407 CrossRef CAS.
- R. Kern, R. Sastrawan, J. Ferber, R. Stangl and J. Luther, Electrochim. Acta, 2002, 47, 4213–4225 CrossRef CAS.
Footnote |
| † Electronic supplementary information (ESI) available. See DOI: 10.1039/c6ra26012h |
| This journal is © The Royal Society of Chemistry 2017 |

