DOI:
10.1039/C6RA25951K
(Paper)
RSC Adv., 2017,
7, 2019-2024
Synthesis, structure and magnetic properties of (Eu1−xMnx)MnO3−δ†
Received
28th October 2016
, Accepted 6th December 2016
First published on 13th January 2017
Abstract
The solid solution (Eu1−xMnx)MnO3−δ (0 ≤ x ≤ 0.126) has been synthesized using a conventional solid-state method. Powder X-ray diffraction and selected area electron diffraction data reveal that all samples crystallize in the space group Pnma. Magnetic measurements indicate that the temperature of the paramagnetic to antiferromagnetic phase transition increases with an increase of Mn in the Eu sites. The neutron diffraction data for 153EuMnO3 at 3 K confirmed that the magnetic structure of EuMnO3 at low temperature is a canted A-type antiferromagnetic structure with the magnetic space group Pnma1′.
Introduction
Studies of LnMnO3 (Ln = Y, Eu, Gd, Tb, Dy, Ho, Er, Tm, Yb, Lu) have been enhanced after the discovery of both magnetic and ferroelectric order (called multiferroics) in TbMnO3,1 YMnO3,2 and HoMnO3.3 Lots of studies have focused on the doping of LnMnO3 (ref. 4–10) at the Ln and/or Mn sites to find better multiferroics. Particularly, several reports indicate that Mn can be doped into the Ln site.11–17 This may help us to understand that the properties of LnMnO3 reported in the literature can be different because the composition may be different. Therefore, it should be very useful to have a systematic study on the relationship between the properties and the composition of Ln1−xMnxMnO3. Although it is known that Mn can be doped into the Eu site of EuMnO3,18 detailed studies are fewer. In addition, our previous work15–17 has indicated that Tb1−xMnyMnO3 can show very interesting magnetic properties. Therefore, careful studies into the synthesis, structure and magnetic properties of Mn doped EuMnO3 are performed. The details are presented below.
Experimental
Samples with the nominal formula (Eu1−xMnx)MnO3−δ (x = 0, 0.025, 0.05, 0.075, 0.1, 0.125 and 0.15) (named M1, M2, M3, M4, M5, M6 and M7, respectively) were synthesized using a traditional solid-state reaction from stoichiometric amounts of Eu2O3 (99.95%) or 153Eu2O3 (99.995%), and MnCO3 (A.R.). Here the formula is noted as (Eu1−xMnx)MnO3−δ instead of (Eu1−xMnx)MnO3 to highlight that the oxygen component is not exactly analyzed. Some oxygen vacancies may appear in the samples. The oven-dried reagents were mixed and homogenized through about thirty minutes of grinding with an agate mortar and a pestle. The mixtures were subjected to 6 h of calcination at 800 °C. They were then pressed into pellets to undergo four 12 h heat treatments at 1200 °C, followed by a furnace cooling every time with intermediate grinding. All the treatments were carried out under air. The weights of the samples were monitored before and after heat treatment. The maximum difference was about 4 mg for the 6 g samples. Therefore, the final compositions of the samples were considered the same as the initial ones. Powder X-ray diffraction (PXRD) data were collected on a PANalytical X'Pert3 Powder diffractometer with Cu Kαα (λ1 = 0.15405 nm and λ2 = 0.15443 nm) radiation (2θ range: 5–120° for 2 h; step size: 0.0131°) at 40 kV and 40 mA at room temperature. Neutron powder diffraction (NPD) data for 153EuMnO3 were collected on the instrument Echidna at the OPAL reactor (Lucas Heights, Australia) at the Australian Nuclear Science and Technology Organization (ANSTO), at λ = 1.62150 Å. The X-ray diffraction data were analyzed using GSAS software.19,20 The magnetic properties were investigated using a Cryogenic physical property measurement system (PPMS) from 2 to 300 K. Selected area electron diffractions (SAED) were carried out on a JEM2100F, with a 200 kV accelerating voltage. The X-ray photoelectron spectroscopy (XPS) patterns were obtained with a UK Kratos AxisUltra spectrometer with an Al Kα X-ray source operating at 15 kV and 15 mA. The chamber pressure was less than 5.0 × 10⁻⁹ torr. Electron binding energies were calibrated against C 1s emission at Eb = 284.8 eV.
Results and discussion
Solid solution of (Eu1−xMnx)MnO3−δ
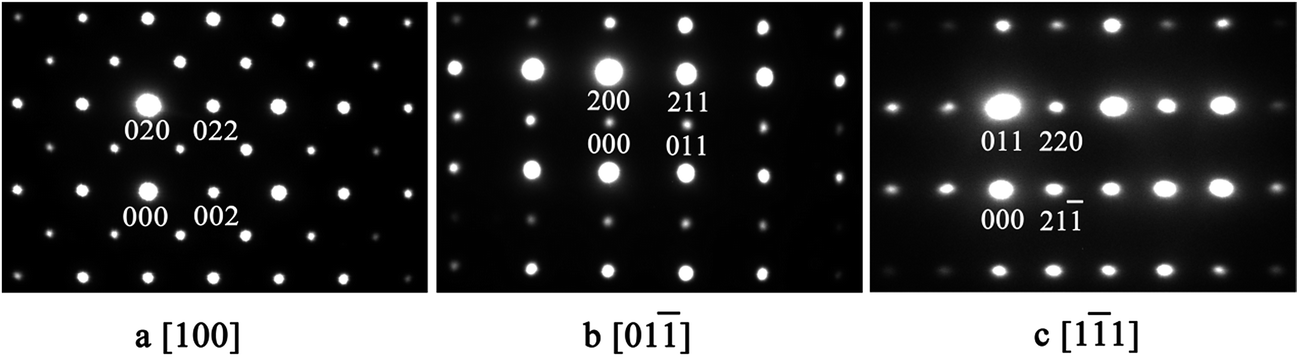
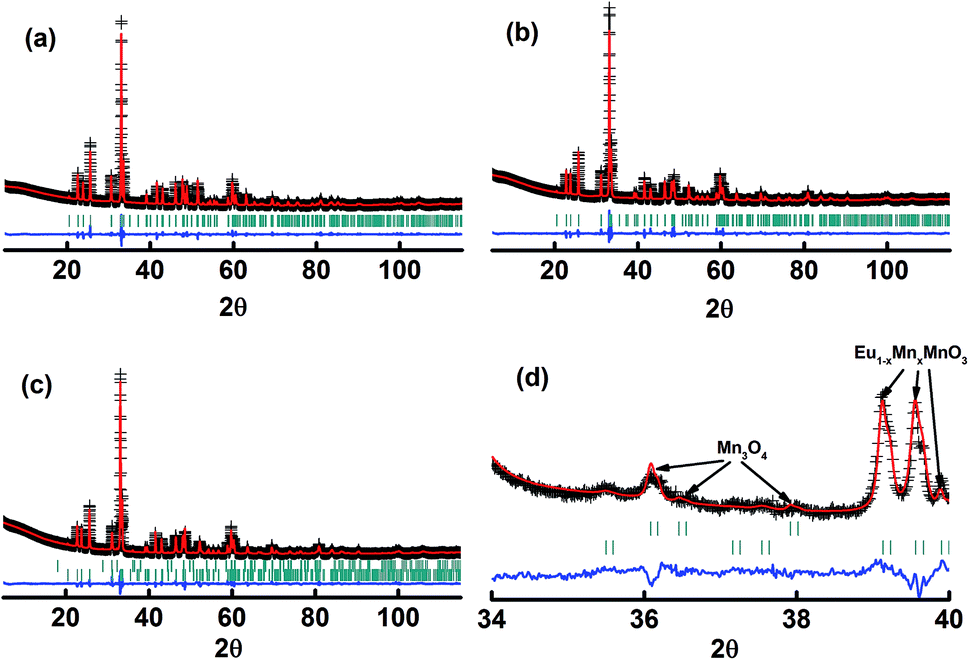
The X-ray diffraction patterns of the studied samples are shown in Fig. 1. The data for M1 to M6 are very similar, with the reflections moving systematically to a higher angle when more Mn is in the samples. These patterns agree well with that reported for EuMnO3 (ref. 21) in the space group Pnma, which indicates that the space group Pnma may be fitted to describe the structure of these samples. After considering that the true structure for a Perovskite compound is very complex,22–24 selected area electron diffraction (SAED) patterns of the above samples have been obtained and analyzed. The typical data are shown in Fig. 2, which confirm that the space group Pnma can be used to describe the structure of M1 to M6. Then the structure of EuMnO3 is used to refine the corresponding data, with the supposition that some Mn occupies Eu sites, using the Rietveld method using GSAS. Good refinement is obtained for all of the data with Rwp ≤ 0.023 and Rp ≤ 0.013 (the corresponding data is listed in Tables S1 and S2 in the ESI†). Typical Rietveld plots are shown in Fig. 3. For M7, a small amount of Mn3O4 impurity was detected, which has been marked in Fig. 3d. Then a two phase model is used to refine the data for M7.
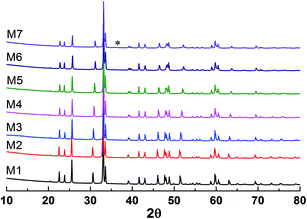 |
| | Fig. 1 Powder X-ray diffraction patterns of the samples with the nominal formula (Eu1−xMnx)MnO3−δ. * reflections from the impurity. | |
 |
| | Fig. 2 Selected area electron diffraction patterns of M5 along the [100], [01![[1 with combining macron]](https://www.rsc.org/images/entities/char_0031_0304.gif) , and [11] directions in the space group Pnma. , and [11] directions in the space group Pnma. | |
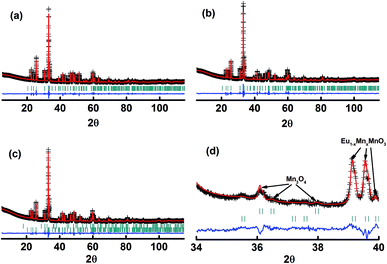 |
| | Fig. 3 Rietveld plots of the powder X-ray diffraction patterns for the samples M1 (a), M6 (b), and M7 (c and d). The symbol “+” represents the observed value, the solid line represents the calculated value, the marks below the diffraction patterns are the calculated reflection positions, and the difference curve is shown at the bottom of the figure. | |
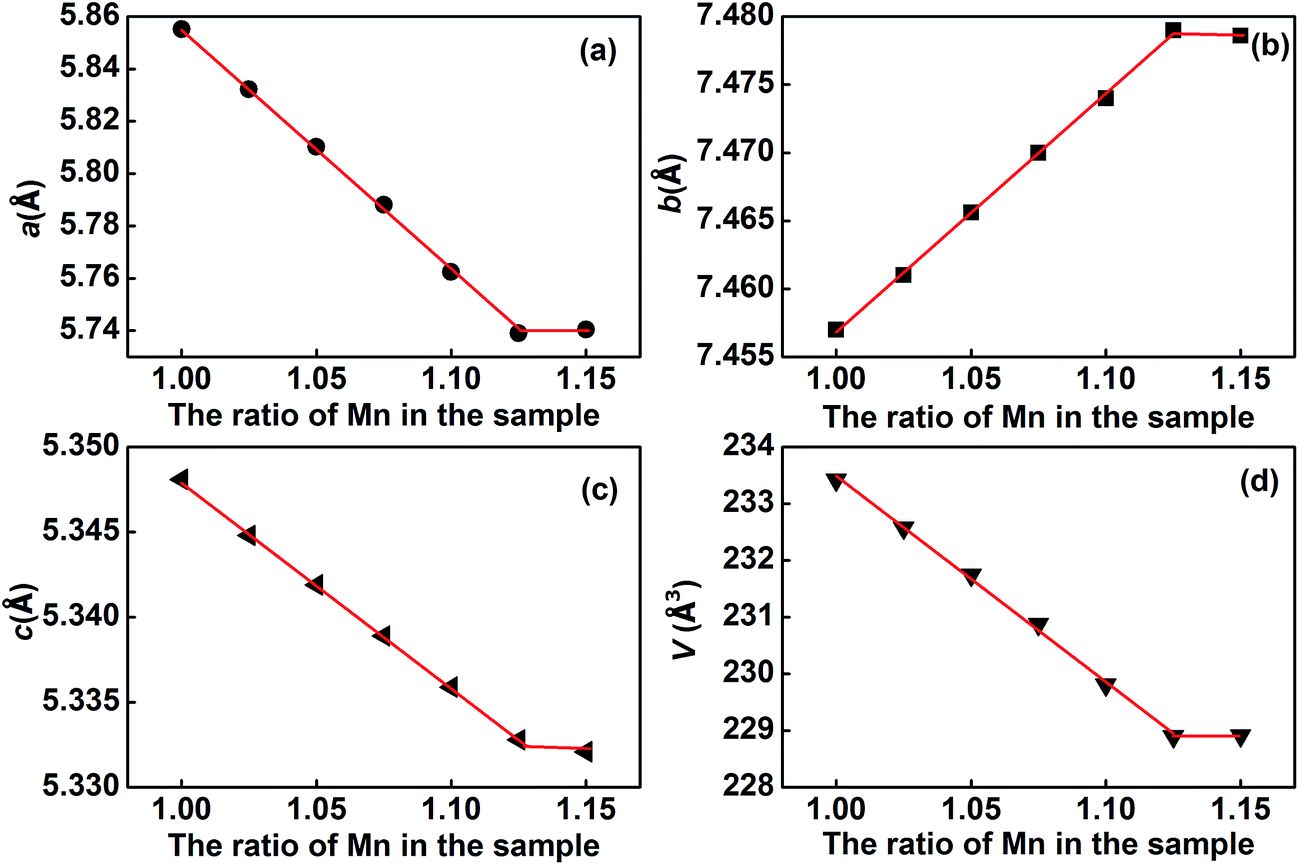
As shown in Fig. 4, with an increase in Mn in (Eu1−xMnx)MnO3−δ, the lattice parameters a and c decrease, and b increases, which agrees well with Vegard's law:25,26
| | |
aOx = aO0(1 − x) + aO1x
| (1) |
| | |
bOx = bO0(1 − x) + bO1x
| (2) |
| | |
cOx = cO0(1 − x) + cO1x
| (3) |
where
aOx(
bOx,
cOx),
aO0(
bO0,
cO0), and
aO1(
bO1,
cO1) are the lattice parameters
a (
b,
c) of orthorhombic (Eu
1−xMn
x)MnO
3−δ, pure orthorhombic EuMnO
3 and supposed orthorhombic MnMnO
3.
x is the composition variable, given by Mn/(Eu + Mn). Using the data shown in
Fig. 4 and
eqn (1)–(3), the maximum value for
x in the solid solution (Eu
1−xMn
x)MnO
3−δ is found to be 0.126. That is, the range for the solid solution (Eu
1−xMn
x)MnO
3−δ is 0 ≤
x ≤ 0.126. The lattice parameters of the solid solution (Eu
1−xMn
x)MnO
3−δ follow well the relationship

, which indicates that the solid solution (Eu
1−xMn
x)MnO
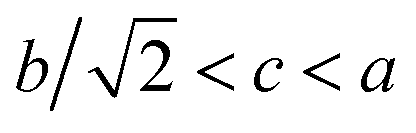
3−δ belongs to an orthorhombic OI structure.
27
 |
| | Fig. 4 Variation of the lattice parameters a (a), b (b), c (c) and the volume of the unit cell V (d) for the solid solution (Eu1−xMnx)MnO3−δ. | |
XPS data for (Eu1−xMnx)MnO3−δ
In order to assess the oxidation states of Eu and Mn in the samples, XPS analysis has been performed. The corresponding data are shown in Fig. 5. The XPS spectra for Eu 3d in the samples M1 to M6 are almost the same. The two peaks at around 1135.6 and 1165.2 eV are attributed to Eu 3d5/2 and Eu 3d3/2, which indicates that the valence state of Eu in the samples is +3.28,29 The XPS spectra of Mn 2p are also almost the same for all six samples, as shown in Fig. 5b. The corresponding Mn 2p3/2 peak is located at about 641.9 eV, which agrees well with the binding energy of Mn 2p3/2 in α-Mn2O3.30,31 Thus, the valence state of Mn is +3 in the solid solution (Eu1−xMnx)MnO3−δ.
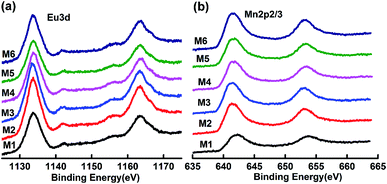 |
| | Fig. 5 XPS spectra of Eu 3d5/2 (a) and Mn 2p3/2 (b) for M1 to M6. | |
Magnetic properties
As reported previously,32 “negative magnetization” in the ZFC (zero field cooling) curve can be easily observed for M1 (EuMnO3), which is attributed to the effect of a trapped negative field in the solenoid of a superconducting magnet. Two characteristic temperatures can be assigned to M1: the temperature where the ZFC and FC (field cooling) curves start to depart, which is attributed by us to the phase transition temperature from PM to AFM, noted as TN1, which is 52 K; and the peak temperature in the ZFC curves, which is attributed to the phase transition temperature from AFM to cAFM, noted as TN2, which is 45 K, as listed in Table 1. These values agree well with data reported by other researchers.33–36
Table 1 The TN1, TN2, Curie constant (C), θ, μcal, and μexp for M1 to M6
| Sample |
M1 |
M2 |
M3 |
M4 |
M5 |
M6 |
| TN1 (K) |
52 |
53 |
55 |
58 |
64 |
70 |
| TN2 (K) |
45 |
42 |
32 |
40 |
42 |
42 |
| C (emu mol−1 K) |
4.87 |
5.10 |
5.18 |
5.21 |
5.24 |
5.25 |
| θ (K) |
−84 |
−54.0 |
−48.6 |
−36.1 |
−19.6 |
−21.9 |
| μcal (μB) |
5.96 |
5.99 |
6.02 |
6.04 |
6.07 |
6.09 |
| μexp (μB) |
6.24 |
6.39 |
6.44 |
6.45 |
6.47 |
6.48 |
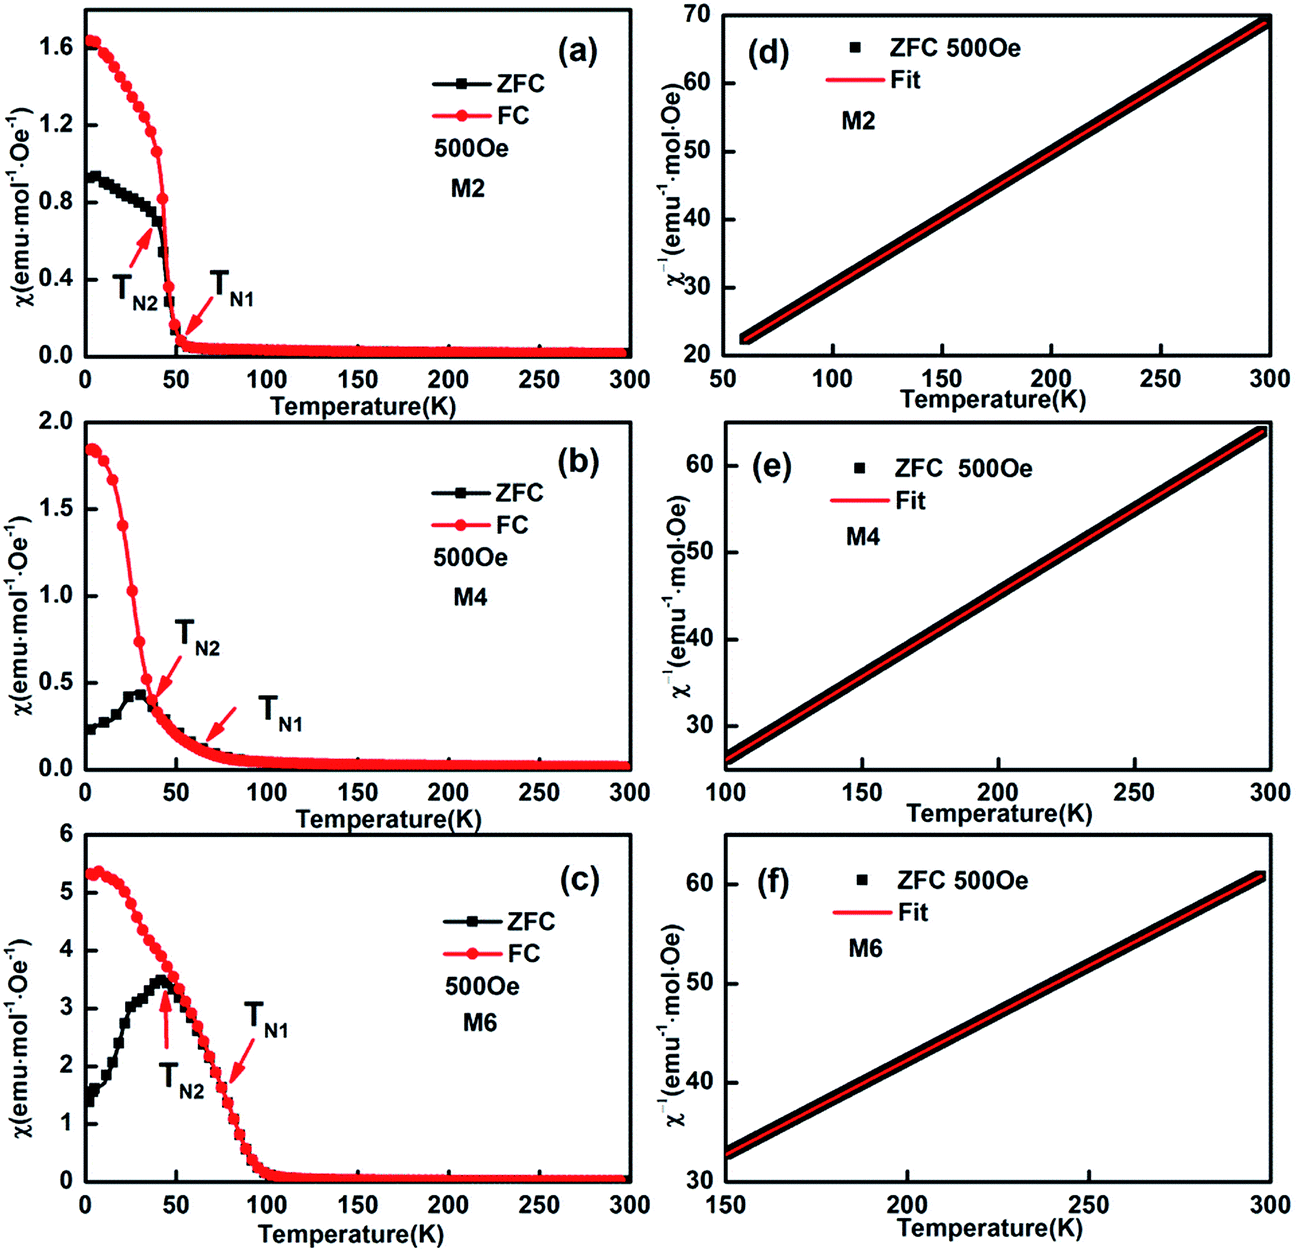
With an increase of Mn in the samples, the “negative magnetization” in the ZFC curve disappears, as shown in Fig. 6. Similarly to M1 (EuMnO3), two characteristic temperatures, TN1 and TN2, can be obtained from the temperature dependence of the magnetic susceptibility in the samples M2 to M6 in ZFC and FC modes, which are listed in Table 1. It is found that with an increase of Mn in the system, the PM to AFM phase transition temperature, TN1, increases. This means that Mn is a good dopant to increase TN1 in Eu1−xMnxMnO3−δ. A similar phenomenon is also found for Mn doped TbMnO3.17
 |
| | Fig. 6 Typical temperature dependence of the magnetization of (Eu1−xMnx)MnO3−δ: χ–T and χ−1–T curves for M2 (a and d), M4 (b and e), and M6 (c and f), respectively. | |
The linearity of χ−1(T) above the temperature TN1 shown in Fig. 6d–f suggests that the reciprocal magnetic susceptibility follows the Curie–Weiss (CW) law, χ = C/(T − θ), where χ is the magnetic susceptibility of the paramagnetic phase, C is the Curie constant, T is the temperature, and θ is the Weiss constant. The corresponding Curie constants C, Weiss constants θ and effective paramagnetic moments are obtained and presented in Table 1. The effective magnetic moment calculated from the Curie constant C increases with an increase in Mn in the sample, and agrees well with the expected value under the supposition37 that μeff2 = (1 + x)μeff2(Mn3+) + (1 − x)μeff2(Eu3+), with μ(Mn3+) = 4.90 μB, and μ(Eu3+) = 3.40 μB. The obtained Weiss constant θ is negative, which indicates that the magnetic interaction is antiferromagnetic in nature.
The magnetic hysteresis loops at selected temperatures have been measured and typical data are shown in Fig. 7. The magnetic hysteresis loops show a clear butterfly shape at 10 K, indicating that the samples are metamagnetic at this temperature. The maximum magnetization value, at H = 7 T at 10 K, increases from 12.8 to 38.9 emu g−1 with an increase in Mn content from 0.025 to 0.125, indicating that doping of Mn at the Eu site makes Eu1−xMnxMnO3 easier to magnetize, which is similar to Eu1−xYxMnO3 (ref. 4) and Eu1−xSrxMnO3.38
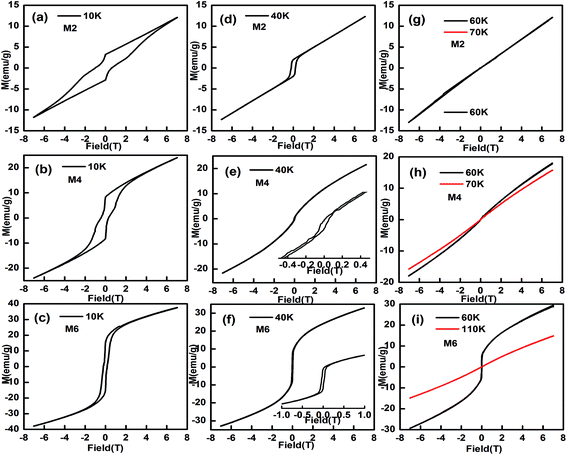 |
| | Fig. 7 The magnetic hysteresis loops for M2, M4 and M6 ((Eu1−xMnx)MnO3−δ, x = 0.025 (a, d, g), 0.075 (b, e, h), and 0.125 (c, f, i)) at selected temperatures. | |
When the temperature increases, the butterfly shape of the M–H curve changes to a normal shape, as shown in Fig. 7d–f, which indicates that the samples become canted antiferromagnetic, rather than metamagnetic. At 60 K, a straight line is observed for M2 and M3, which agrees well with the finding that the PM to AFM phase transition temperature TN1 for M2 and M3 is lower than 60 K, as listed in Table 1. But for M4, M5, and M6, the M–H curves are not straight lines at 60 K.
Neutron diffraction of 153EuMnO3
As mentioned previously,32,39 it is hard to get neutron diffraction data for EuMnO3 because the neutrons can be absorbed by Eu. Therefore, the magnetic structure of EuMnO3 has not been solved until now, although T. Goto et al.34 have predicted that it has a phase transition from PM to ICAFM (incommensurate antiferromagnetic) at ∼50 K, and a further transition from ICAFM to cAAFM (canted A-type antiferromagnetic) ordering at ∼44 K. It has been reported that neutron diffraction data can be obtained for 153EuMnO3,39 where only data from around room temperature has been presented, which confirms that 153EuMnO3 crystallizes in the space group Pnma. Therefore, 153EuMnO3 has been synthesized in our lab and sent away for neutron diffraction data collection at 60 and 3 K. As shown in Fig. 8a, the neutron diffraction data for 153EuMnO3 at 60 K can be refined well using the space group Pnma with the parameters listed in Table 2, which may indicate that the structure of 153EuMnO3 does not change between 300 K and 60 K. However, new diffraction peaks are found in the neutron data from 153EuMnO3 at 3 K, which can be attributed to the A-type40 magnetic ordering of Mn in 153EuMnO3, as shown in Fig. 8c with the refinement parameters listed in Table 2. In the first work on the magnetic structure of Mn in the doped perovskite LaMnO3, E. O. Wollan et al.40 established a note system of A, B, C, D, E, F, and G type to note the different possible magnetic structures of Mn. Specially, A-type magnetic ordering means that the magnetic moment arrangement of Mn is similar to that shown in Fig. 8c. That is, the magnetic moments of the four-close-neighboring Mn in the first and the second layer are inversed. As shown in Fig. 8c, the moment of Mn in the first layer directs to the positive c-axis, while the moment of Mn in the second layer directs to the negative c-axis. Our results confirm the prediction of a cAAFM phase for EuMnO3 by T. Goto et al.34 More careful studies are planned to confirm the ICAFM phase for 153EuMnO3.
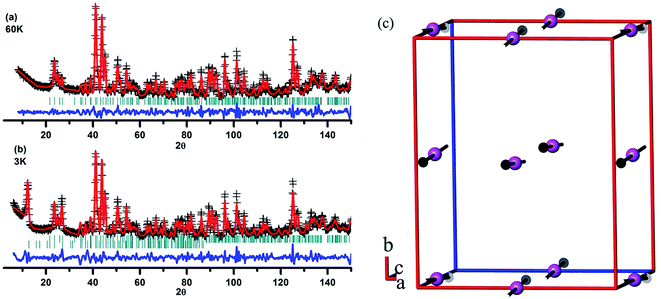 |
| | Fig. 8 Rietveld plots of the neutron diffraction data from 153EuMnO3 at 60 K (a) and 3 K (b), and the magnetic structure of 153EuMnO3 at 3 K (c). | |
Table 2 Rietveld refinement details for the neutron diffraction data from 153EuMnO3 at 60 K and 3 K
| |
60 K |
3 K |
| Rp is sum(|I0 − IC|)/sum(I0), and Rwp is the weighted R factor for the neutron diffraction data. |
| Phase 1 |
Nuclear phase |
Nuclear phase |
| Space group |
Pnma |
Pnma |
| Lattice parameters (Å) |
a = 5.8217(2), b = 7.2138(3), c = 5.3242(8) |
a = 5.8183(2), b = 7.2082(3), c = 5.3269(2) |
| Atom |
x, y, z |
x, y, z |
| Eu |
0.0787(3), 0.2500, 0.9844(3) |
0.0800(3), 0.2500, 0.9845(3) |
| Mn |
0.0000, 0.0000, 0.5000 |
0.0000, 0.0000, 0.5000 |
| O1 |
0.4722(3), 0.2500, 0.0957(3) |
0.4678(3), 0.2500, 0.0974(3) |
| O2 |
0.3236(3), 0.0462(3), 0.7063(3) |
0.3249(3), 0.0478(3), 0.7066(3) |
| Phase 2 |
|
Magnetic phase |
| Space group |
|
Pnma1′ |
| Lattice parameters (Å) |
|
a = 5.8183(2), b = 7.2082(3), c = 5.3269(2) |
| Atom |
|
(x, y, z)/(Mx, My, Mz) |
| Mn |
|
(0.0000, 0.0000, 0.5000)/(−0.554, 0.190, 2.868) |
| R factora |
Rwp = 0.033, Rp = 0.026 |
Rwp = 0.041, Rp = 0.031 |
Conclusions
Solid solution Eu1−xMnxMnO3−δ has been synthesized using a conventional solid state method at 1200 °C under air. The powder X-ray diffraction and selected area electron diffraction data confirm that all samples crystallize in the space group Pnma at room temperature. The range of x for the solid solution obtained in the present case is assessed to be 0 ≤ x ≤ 0.126. With the doping of Mn in the Eu site, the paramagnetic to antiferromagnetic phase transition moves to a higher temperature. In addition, the neutron diffraction data from 153EuMnO3 at 3 K confirmed that the magnetic structure of EuMnO3 at low temperatures is canted A-type antiferromagnetic.
Acknowledgements
This work is supported by the National Key Basic Research Project of China (2010CB833103), and the National Natural Science Foundation of China (Grants 21271014, 11275012). We thank Dr M. Avdeev for assistance in collecting the neutron power diffraction data at the OPAL facility.
References
- T. Kimura, T. Goto, H. Shintani, K. Ishizaka, T. Arima and Y. Tokura, Nature, 2003, 426, 55 CrossRef CAS PubMed.
- M. Fiebig, T. Lottermoser, D. Fröhlich, A. V. Goltsev and R. V. Pisarev, Nature, 2002, 419, 818 CrossRef CAS PubMed.
- T. Lottermoser, T. Lonkai, U. Amann, D. Hohlwein, J. Ihringer and M. Fiebig, Nature, 2004, 430, 541 CrossRef CAS PubMed.
- J. Hemberger, F. Schrettle, A. Pimenov, P. Lunkenheimer, V. Y. Ivanov, A. A. Mukhin, A. M. Balbashov and A. Loidl, Phys. Rev. B: Condens. Matter Mater. Phys., 2007, 75, 035118 CrossRef.
- V. Cuartero, J. Blasco, J. García, G. Subías, C. Ritter and J. Alberto Rodríguez-Velamazán, Phys. Rev. B: Condens. Matter Mater. Phys., 2010, 81, 224117 CrossRef.
- D. O'Flynn, C. V. Tomy, M. R. Lees, A. Daoud-Aladine and G. Balakrishnan, Phys. Rev. B: Condens. Matter Mater. Phys., 2011, 83, 174426 CrossRef.
- H. D. Zhou, J. C. Denyszyn and J. B. Goodenough, Phys. Rev. B: Condens. Matter Mater. Phys., 2005, 72, 224401 CrossRef.
- P. P. Rout, S. K. Pradhan and B. K. Roul, Ceram. Int., 2014, 40, 9647 CrossRef CAS.
- A. Nandy and S. K. Pradhan, Dalton Trans., 2015, 44, 17229 RSC.
- A. Astudillo, J. Izquierdo, F. J. Bonilla, G. Bolaños and O. Morán, IEEE Trans. Magn., 2013, 49, 4590 CrossRef CAS.
- E. Pollert and Z. Jirak, J. Solid State Chem., 1980, 35, 262 CrossRef CAS.
- G. Lescano, F. M. Figueiredo, F. M. B. Marques and J. Schmidt, J. Eur. Ceram. Soc., 2001, 21, 2037 CrossRef CAS.
- I. Gélard, N. Jehanathan, H. Roussel, S. Gariglio, O. I. Lebedev, G. Van Tendeloo and C. Dubourdieu, Chem. Mater., 2011, 23, 1232 CrossRef.
- A. N. Ulyanov, N. E. Pismenova, D. S. Yang, V. N. Krivoruchko and G. G. Levchenko, J. Alloys Compd., 2013, 550, 124 CrossRef CAS.
- R. Wang, C. X. Yang, M. Fan, M. M. Wu, C. H. Wang, X. H. Yu, J. L. Zhu, J. R. Zhang, G. B. Li, Q. Z. Huang, D. F. Chen, T. N. Jin, T. Kamiyama, F. H. Liao and J. H. Lin, J. Alloys Compd., 2013, 554, 385 CrossRef CAS.
- H. Zhang, R. Flacau, J. L. Sun, G. B. Li, F. H. Liao and J. H. Lin, Inorg. Chem., 2014, 53, 4535 CrossRef CAS PubMed.
- H. Zhang, R. Flacau, X. Du, P. Manuel, J. Z. Cong, Y. Sun, J. L. Sun, S. H. Yang, G. B. Li, F. H. Liao and J. H. Lin, ChemPhysChem, 2016, 17, 1098 CrossRef CAS PubMed.
- O. M. Fedorova, V. F. Balakirev and Yu. V. Golikov, Inorg. Mater., 2007, 43, 994 CrossRef CAS.
- H. M. Rietveld, J. Appl. Crystallogr., 1969, 2, 65 CrossRef CAS.
- B. H. Toby, J. Appl. Crystallogr., 2001, 34, 210 CrossRef CAS.
- N. V. Kasper and I. O. Troyanchuk, J. Phys. Chem. Solids, 1996, 57, 1601 CrossRef CAS.
- G. B. Li, S. X. Liu, F. H. Liao, S. J. Tian, X. P. Jing, J. H. Lin, Y. Uesu, K. Kohn, K. Saitoh, M. Terauchi, N. L. Di and Z. H. Cheng, J. Solid State Chem., 2004, 177, 1695 CrossRef CAS.
- H. Wang, C. H. Wang, G. B. Li, T. N. Jin, F. H. Liao and J. H. Lin, Inorg. Chem., 2010, 49, 5262 CrossRef CAS PubMed.
- H. Wang, C. X. Yang, J. Lu, M. M. Wu, J. Su, K. Li, J. R. Zhang, G. B. Li, T. N. Jin, T. Kamiyama, F. H. Liao, J. H. Lin and Y. C. Wu, Inorg. Chem., 2013, 52, 2388 CrossRef CAS PubMed.
- L. Vegard, Z. Phys., 1921, 5, 17 CrossRef CAS.
- L. Vegard, Z. Kristallogr., 1928, 67, 239 Search PubMed.
- T. S. Chan, R. S. Liu, C. C. Yang, W. H. Li, Y. H. Lien, C. Y. Huang and J. F. Lee, J. Phys. Chem. B, 2007, 111, 2262 CrossRef CAS PubMed.
- Y. U. wamino, T. Ishizuka and H. Yamatera, J. Electron Spectrosc. Relat. Phenom., 1984, 34, 67 CrossRef.
- D. F. Mullica, C. K. C. Lok, H. O. Perkins, G. A. Benesh and V. Young, J. Electron Spectrosc. Relat. Phenom., 1995, 71, 1 CrossRef CAS.
- M. Oku, K. Hirokawa and S. Ikeda, J. Electron Spectrosc. Relat. Phenom., 1975, 7, 465 CrossRef CAS.
- V. Di Castro and G. Polzonetti, J. Electron Spectrosc. Relat. Phenom., 1989, 48, 117 CrossRef CAS.
- A. M. Yang, Y. H. Sheng, M. A. Farid, H. Zhang, X. H. Lin, G. B. Li, L. J. Liu, F. H. Liao and J. H. Lin, RSC Adv., 2016, 6, 13928 RSC.
- I. O. Troyanchuk, N. V. Samsonenko, N. V. Kasper, H. Szymczak and A. Nabialek, Phys. Status Solidi A, 1997, 160, 195 CrossRef CAS.
- T. Goto, T. Kimura, G. Lawes, A. P. Ramirez and Y. Tokura, Phys. Rev. Lett., 2004, 92, 257201 CrossRef CAS PubMed.
- W. S. Ferreira, J. A. Moreira, A. Almeida, M. R. Chaves, J. P. Araújo, J. B. Oliveira, J. M. M. Da Silva, M. A. Sá, T. M. Mendonça, P. S. Carvalho, J. Kreisel, J. L. Ribeiro, L. G. Vieira, P. B. Tavares and S. Mendonça, Phys. Rev. B: Condens. Matter Mater. Phys., 2009, 79, 054303 CrossRef.
- R. Das and P. Poddar, RSC Adv., 2014, 4, 10614 RSC.
- J. H. Van Vleck, J. Appl. Phys., 1968, 39, 365 CrossRef CAS.
- Y. Tadokoro, Y. J. Shan, T. Nakamura and S. Nakamura, Solid State Ionics, 1998, 108, 261 CrossRef CAS.
- B. Dabrowski, S. Kolensnik, A. Baszcuk, O. Chmaissem, T. Maxwell and J. Mais, J. Solid State Chem., 2005, 178, 629 CrossRef CAS.
- E. O. Wollan and W. C. Koehler, Phys. Rev., 1955, 100, 545 CrossRef CAS.
Footnote |
| † Electronic supplementary information (ESI) available. See DOI: 10.1039/c6ra25951k |
|
| This journal is © The Royal Society of Chemistry 2017 |
Click here to see how this site uses Cookies. View our privacy policy here. 
 Open Access Article
 This Open Access Article is licensed under a
  b,
Aimei Yangb,
M. A. Farid
b,
Aimei Yangb,
M. A. Farid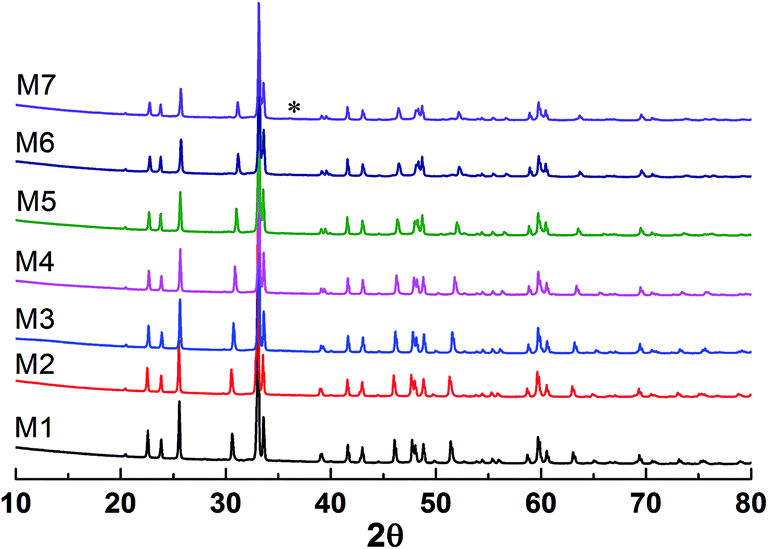
 , which indicates that the solid solution (Eu1−xMnx)MnO3−δ belongs to an orthorhombic OI structure.27