DOI:
10.1039/C6RA25915D
(Paper)
RSC Adv., 2017,
7, 1075-1081
Color tunable emission and energy transfer in LaSi3N5:Ce3+,Tb3+ phosphors for UV white LEDs†
Received
28th October 2016
, Accepted 29th November 2016
First published on 4th January 2017
Abstract
A series of new blue-green emitting LaSi3N5:Ce3+,Tb3+ phosphors were obtained through a high temperature solid-state method. The crystal structure, photoluminescence properties and energy transfer from Ce3+ to Tb3+ were investigated. The doped ions Ce3+ and Tb3+ were confirmed to occupy the same crystallographic sites as La3+ using a Rietveld structure refinement method. The emission spectra of these phosphors was composed of a blue emission band attributed to the d–f transition of Ce3+, together with several sharp lines ascribed to the emission of Tb3+ under UV light excitation. Thus a color tunable emission from blue to green was obtained via controlling the doping concentration of Tb3+. In addition, the mechanism of energy transfer, efficiency of energy transfer, chromaticity coordinates and thermal stability of these phosphors were investigated. The results indicated that the Ce3+,Tb3+ co-activated LaSi3N5 phosphors with color-tunable blue-green emission and high quantum efficiency may have potential for UV white LEDs.
1. Introduction
Phosphor-converted white light-emitting diodes (WLEDs) have received considerable attention as a new-fashioned lighting source due to their high conversion efficiency, long lifetime and environment-friendly characteristics compared with the conventional incandescent and fluorescent lamps.1–3 Most commercially available WLEDs are fabricated by combining the yellow-emitting Y3Al5O12:Ce3+ phosphor with (In,Ga)N-LED chips.4 However, the major shortcoming of this phosphor is the lack of a red spectral component, which results in a low color rendering index (Ra < 75) and high color temperature (Tc > 7000 K) limiting their application.5 To further improve the luminescence efficiency of these LEDs, near-UV (380–420 nm, short as n-UV) LED chips combined with blue, green and red phosphors was reported.6,7 Especially, w-LEDs fabricated with n-UV chips coated with tricolor (red, green and blue) phosphors are regarded as the main trend in the market of the LED lighting industry.8,9 Therefore, it is essential to develop new phosphors that emit blue, green or red light, which can be efficiently excited by the n-UV LED chips.
Recently, Ce3+ doped LaSi3N5-based phosphors with blue emission have drawn much attention due to their intense emission and high thermal stability.10 The structure of LaSi3N5, which was first reported by Inoue et al.11 in 1980, is composed of a three-dimensional network with vertex-sharing [SiN4] tetrahedral. Moreover, LaSi3N5 are reported to hold similar structure of Si3N4, hinting that LaSi3N5 may have rigid skeleton structure and some other special properties. Thus, LaSi3N5 might be an interesting host for phosphor. In recent years, the luminescence properties of Ce3+-activated LaSi3N5 blue phosphors have been studied.10,12–14 In 2011, Park et al.15 reported that both the excitation and emission bands were getting slightly shift to long wavelength by doping Al. It is well known that Ce3+ ions not merely exhibit excellent luminescent properties with broadband emission but also can act as an efficient sensitizer due to its high efficiency of energy transfer. Typically, the energy transfer from Ce3+ to Tb3+ has been widely studied and the energy could be transferred from the 5D level of Ce3+ to the 5D3,4 level of Tb3+ in the proper matrix.16–19 Therefore, it is may be attractive to develop a new phosphor in LaSi3N5 matrix by Ce3+ and Tb3+ co-doping. To the best of our knowledge, the luminescence properties of LaSi3N5:Ce3+,Tb3+, as well as the mechanism of energy transfer, have not been reported in the literature.
In this work, we have synthesized a series of LSN:Ce3+,Tb3+ phosphors and studied the structure, photoluminescence properties, energy transfer mechanism and energy transfer efficiency in detail. The luminescent properties study suggests that LSN:Ce3+,Tb3+ may have potential application for UV WLEDs.
2. Experimental
2.1 Synthesis
A series of Ce3+ and Ce3+,Tb3+-activated LaSi3N5 (LSN) phosphors were prepared via conventional high temperature solid state reactions. The raw materials LaN (99.5%), CeN (99.5%), and TbN (99.99%) were supplied by General Research Institute for Nonferrous Metals, and Grirem Advanced Materials Co. Ltd, Beijing, China, together with Si3N4 (>99.9%) bought from Sigma-Aldrich. The starting powders were weighted and mixed in an agate mortar for 15 min per each sample. All these operation were performed in a purified-nitrogen-filled glove box with oxygen and water vapor content maintained below 1 ppm. The mixed powders were placed in BN crucible and heated at 1900 °C for 10 h with pressure of nitrogen gas maintained at 2.0 MPa in the graphite resistance furnace. The prepared phosphors were cooled down to room temperature followed by ball-milling and water washing.
2.2 Characterization
The phase purity of samples was examined by the X-ray diffraction (XRD, Rigaku, Japan) with Co-Kα radiation (λ = 0.178752 nm), performing at 40 kV and 100 mA in the 2θ range from 10° to 80° with scanning speed of 6° per minute. The data for Rietveld structure refinement were collected from D8 Focus diffractometer (Bruker) operating at 40 kV and 40 mA with Cu Kα radiation (λ = 1.54 Å). The morphology of LaSi3N5:0.09Ce3+,0.08Tb3+ was inspected by using scanning electron microscopy (SEM, S4800, Hitachi, Japan). Diffuse reflection spectra were measured on a UV-vis-NIR spectrophotometer (Shimadzu UV-2550) attached to an integral sphere and using BaSO4 as reference standard. The photoluminescence (PL) and photoluminescence excitation (PLE) spectra were measured on a Hitachi F-4500 spectrophotometer equipped with a 150 W Xe lamp as the excitation source. The decay curves of Ce3+ with different Tb3+ concentrations were measured by a TemPro-01 time-resolved fluorescence spectrophotometer (Horiba Jobin Yvon, Japan) with a tunable pulse laser radiation as the excitation source. The Commission International de L'Eclairage (CIE) chromaticity coordinates were obtained from a HAAS-2000 light (Everfine, China). All above measurements were performed at room temperature.
3. Results and discussion
3.1 Crystal structure and morphology
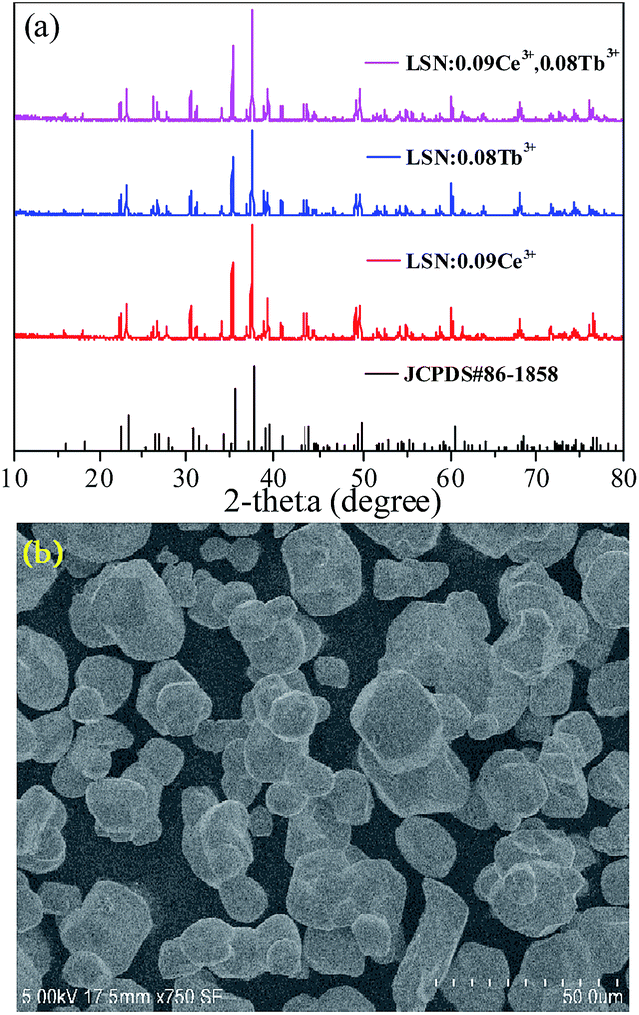
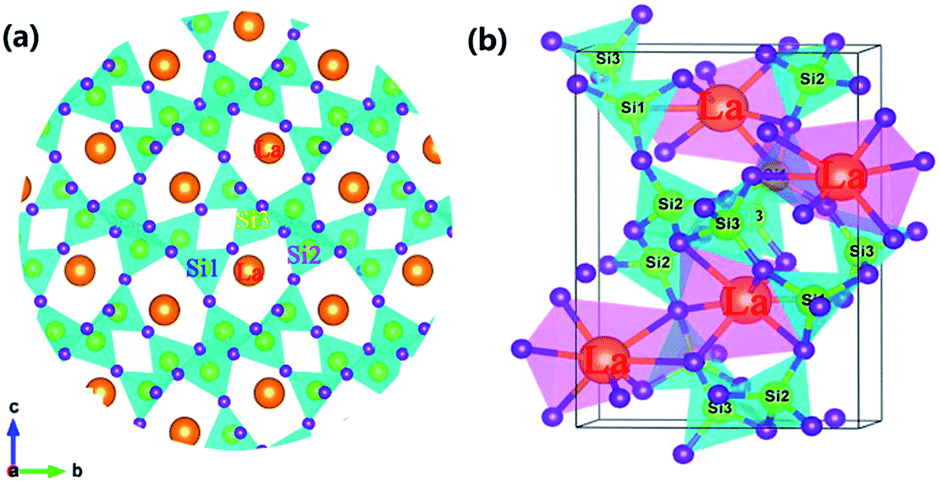
Fig. 1(a) depicts the powder XRD patterns of the as-prepared LSN:0.09Ce3+, LSN:0.08Tb3+, LSN:0.09Ce3+,0.08Tb3+ phosphors. All the diffraction peaks of these samples are consistent with the JCPDS Standard Card No. 86-1858 of CeSi3N5, suggesting phase purities were formed and with the space group P212121. The peaks were shown no obvious shift due to the very close ion radii of La3+ (1.06 Å), Ce3+ (1.03 Å) and Tb3+ (0.923 Å). Here, CeSi3N5 were chosen as references and reasons are following: first, the nitridosilicates LnSi3N5 (Ln = Ce, Pr, Nd) compounds are isostructural with LaSi3N5 as reported by Michael et al. It is worth noting that the lattice parameters of a, b, c and V for LaSi3N5 and CeSi3N5 are basically same;20 second, the phase purity of LaSi3N5 are obtained by Zhou,21 Ibrahim12 and Suehiro,10 and all of the diffraction peaks of LaSi3N5 accompanying with different doping rare earth Ce3+ are in good agreement with CeSi3N5. However, few peaks in the 2θ range at 47–52°are observed in the samples prepared by Park et al.14,15 and they are regarded as impurity peaks compared with the JCPDS 42-1144 of LaSi3N5. It is possible that the JCPDS standard pattern of LaSi3N5 should be further confirmed. To further confirm the structure of the obtained samples, Rietveld structure refinement of LaSi3N5 has been performed by using the Fullprof suite software,22 as shown in Fig. 2. The crystal structure data of LSN (reported by Woike23) is used as the initial structure model and the main cell parameters and residual factors are summarized in Table 1. All of the peaks are obtained with goodness of fit parameters Rwp = 11.3, Rp = 8.82, Rexp = 7.33 and χ2 = 2.37, indicating that all atom positions, residual factors and temperature factors well suitable the reflection condition. Fig. 3(a) and (b) represent the crystal structure of LSN. In the LSN host, there is only one La site and La atom is located between the corresponding pentagonal holes which occur at one unit intervals along the c-axis, indicating that there is only one kind of crystallographic site for Ce3+ ion in this phosphor. The fundamental of LSN consists of SiN4 tetrahedra that are linked by sharing their corners to form rings of five tetrahedral units. The characteristics of LSN structure are similar to Si3N4, which means that LSN may have intrinsically the same properties as silicon nitride, such as thermally stability. The morphology of LaSi3N5:0.09Ce3+,0.08Tb3+ sample was obtained by SEM shown in Fig. 1(b). Most particles show nearly spherical with clear edges and average diameter of about 15 μm, which is sufficiently separated from other particles. It is revealed that the particles may be suitable for fabricating with whites LEDs. Therefore, it is indicate that the synthesis conditions are appropriate.
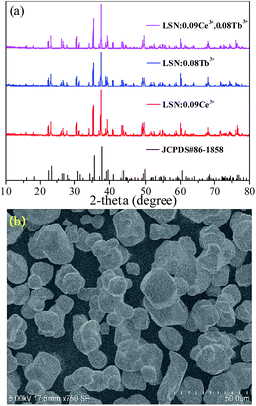 |
| | Fig. 1 (a) Powder XRD patterns of La0.91Si3N5:0.09Ce3+, La0.92Si3N5:0.08Tb3+ and La0.83Si3N5:0.09Ce3+,0.08Tb3+ phosphors. The standard data of CeSi3N5 (JCPDS No. 86-1858) is show as a reference. (b) SEM image of the as-prepared La0.83Si3N5:0.09Ce3+,0.08Tb3+ phosphor. | |
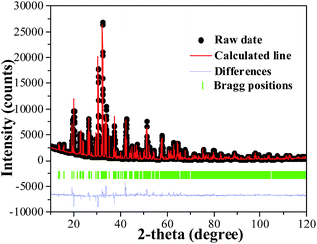 |
| | Fig. 2 Rietveld refinement of the XRD pattern of LaSi3N5. Bragg reflections are indicated with green tick marks. | |
Table 1 Selected crystallographic parameters from Rietveld refinement for the LaSi3N5 sample
| Formula |
LaSi3N5 |
| X-ray source |
Cu Kα |
| 2θ (deg) |
10–120 |
| Symmetry |
Orthorhombic |
| Space group |
P212121 |
| Lattice parameters |
a = 7.85 Å, b = 11.26 Å, c = 4.81 Å |
| α = β = γ = 90° |
| Residual factors |
Rp = 8.82%, Rwp = 11.3%, Rexp = 7.33, χ2 = 2.37 |
 |
| | Fig. 3 (a) Crystal structure of LaSi3N5 along a-axis direction. The orange, yellow and purple represent the La, Si and N atoms, respectively. (b) The same coordination environment of La atoms. | |
3.2 Luminescence properties of Ce3+,Tb3+ doped and co-doped LaSi3N5 phosphors
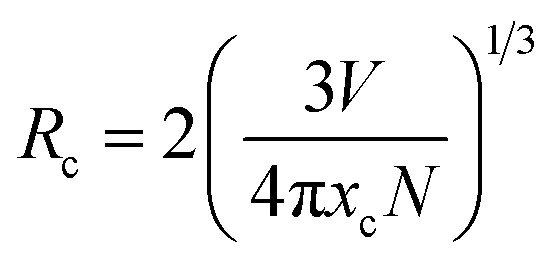
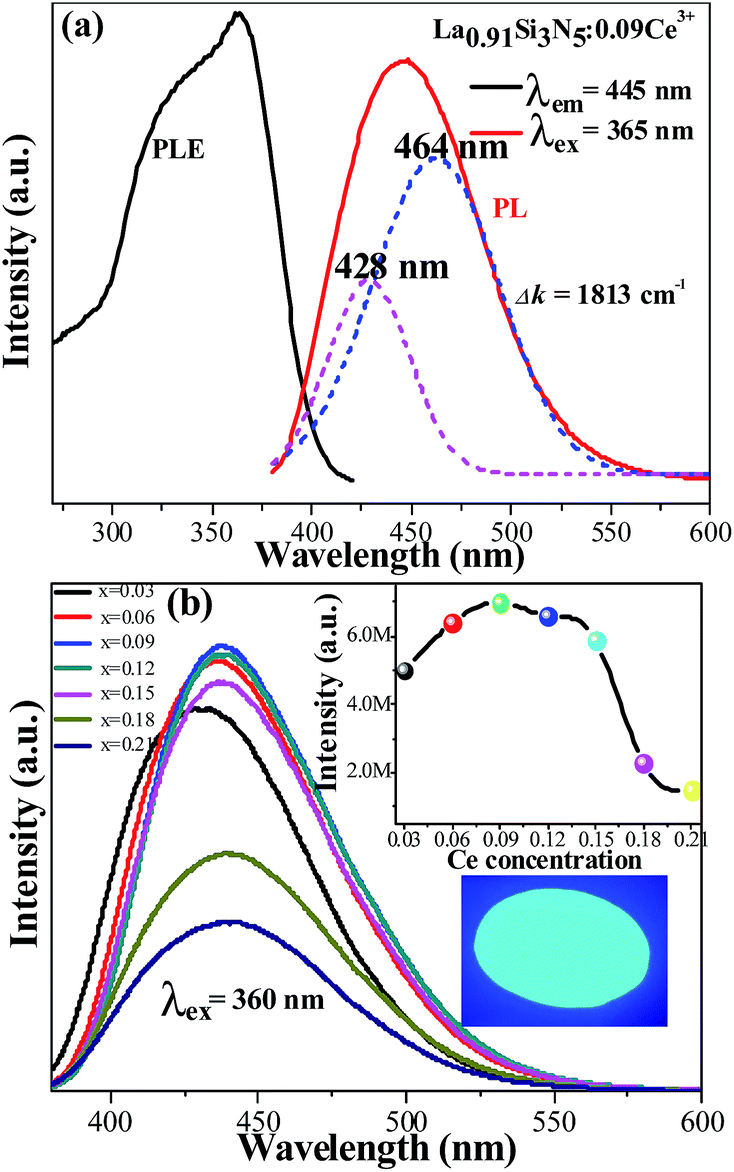
Fig. 4(a) shows the PLE and PL spectra of the LSN:0.09Ce3+ phosphor. The sample shows an excitation band from 250 to 425 nm, indicating that it is suitable for the excitation absorption of the n-UV LED chip. At the excitation of 360 nm, the phosphor exhibits an asymmetric emission spectrum that covers the region from 375 to 540 nm with a peak centered at 445 nm. The doublet bands attributed to the Ce3+ ions from the 5d excited state to the 2F5/2 and 2F7/2 ground states cannot be distinguished directly. Furthermore, the emission spectra can be fitted into two well-separated Gaussian components (the dotted lines) with peak at 428 nm (23![[thin space (1/6-em)]](https://www.rsc.org/images/entities/char_2009.gif) 364 cm−1) and 464 nm (21551 cm−1). The energy gap between two bands is calculated to be 1813 cm−1, which is very closed to the theoretical value of ∼2000 cm−1.24,25 This result illustrates that Ce3+ ions substitute only one site in host lattice. Fig. 4(b) shows the intensity of PL spectra of LSN:xCe3+ with different doping Ce3+ contents (x = 0.03, 0.06, 0.09, 0.12, 0.15, 0.18, 0.21). The peak wavelength shows a red-shifting from 425 nm to 446 nm, which can be explained by the increased energy transfer between the 5d energy levels26,27 and the enhanced crystal-field strength with the increasing Ce3+ content. The optimal emission intensity is obtained around 0.09 due to the concentration quenching effect (inset in Fig. 4(b)). The critical energy transfer distance (Rc) can be calculated using the following relation:28
364 cm−1) and 464 nm (21551 cm−1). The energy gap between two bands is calculated to be 1813 cm−1, which is very closed to the theoretical value of ∼2000 cm−1.24,25 This result illustrates that Ce3+ ions substitute only one site in host lattice. Fig. 4(b) shows the intensity of PL spectra of LSN:xCe3+ with different doping Ce3+ contents (x = 0.03, 0.06, 0.09, 0.12, 0.15, 0.18, 0.21). The peak wavelength shows a red-shifting from 425 nm to 446 nm, which can be explained by the increased energy transfer between the 5d energy levels26,27 and the enhanced crystal-field strength with the increasing Ce3+ content. The optimal emission intensity is obtained around 0.09 due to the concentration quenching effect (inset in Fig. 4(b)). The critical energy transfer distance (Rc) can be calculated using the following relation:28| |
 | (1) |
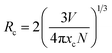
where V is the volume of the unit cell, xc is the critical concentration, N is the number of cations in the unit cell that can be substituted by the activator ions. In this host, V = 423.342 Å3, xc = 0.09 and N = 4, the critical distance is calculated to be 13.1 Å.
 |
| | Fig. 4 (a) PL and PLE spectra of the as-synthesized LSN:0.09Ce3+ phosphor; (b) the emission spectra of LSN:xCe3+ with different Ce3+ contents. The inset above shows PL intensity of the LSN:Ce3+ samples as a function of the Ce3+ concentration and the inset below shows the photograph of the LSN:0.09Ce3+ phosphor under 365 nm excitation. | |
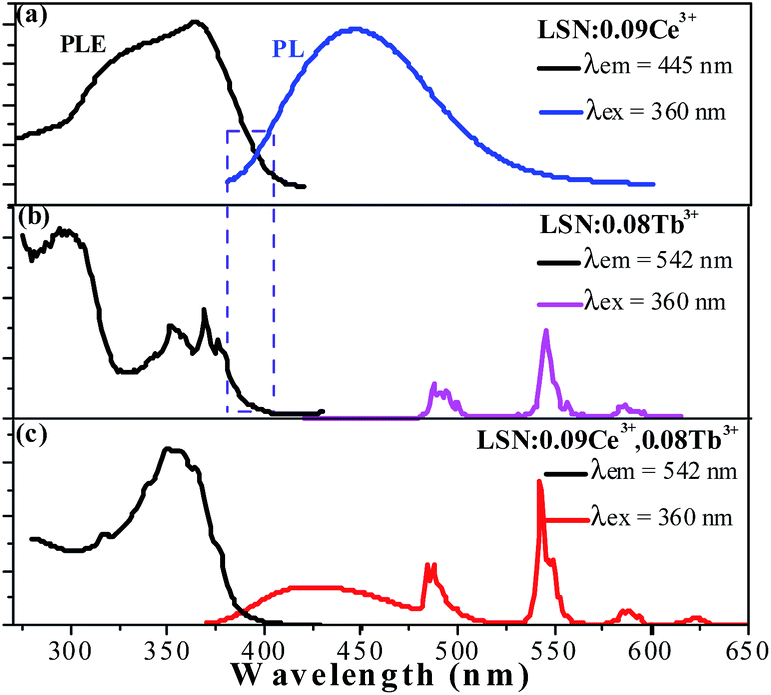
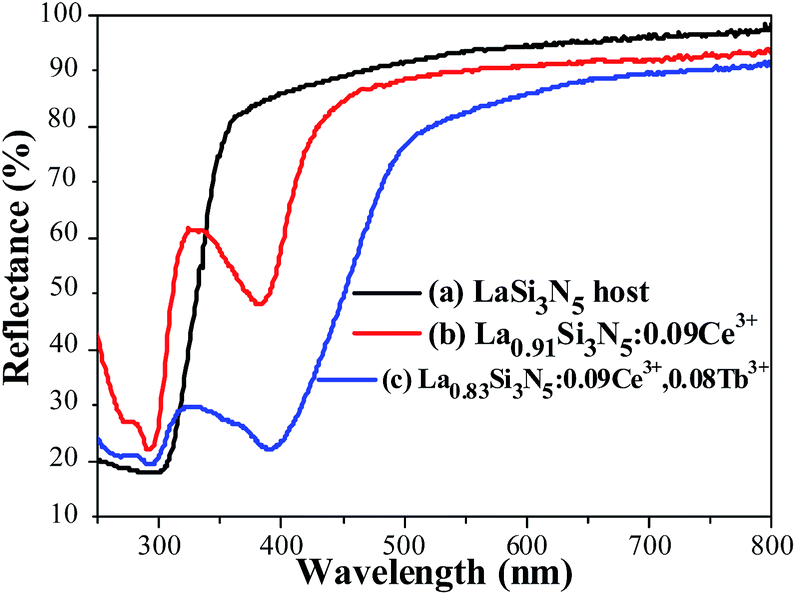
The PLE and PL spectra of LSN:0.09Ce3+ (a), LSN:0.08Tb3+ (b) and LSN:0.09Ce3+,0.08Tb3+ (c) are presented in Fig. 5. It can be seen that excitation bands of Tb3+ are observed in the region from 300 to 450 nm, which could be referred to the f–f transition absorption of the Tb3+ ions. Under 360 nm excitation, the PL spectra of LSN phosphor singly doped with Tb3+ shows several weak emissions with peaks at 485, 542, 582 and 623 nm, due to the typical 5D4 → 7FJ (J = 6, 5, 4, 3) multiple transitions of the Tb3+ ions.29 However, as a green phosphor, it is hard to be applied in LED due to the lack of efficiency. In order to enhance the absorption intensity in the n-UV region for the Tb3+ emission, Ce3+ ions can be co-doped as sensitizers to transfer excitation energy to Tb3+ ions. It is observed that there is significant spectral overlap between the emission band of LSN:0.09Ce3+ and the PLE spectrum of LSN:0.08Tb3+ from Fig. 5(a) and (b). Energy transfer is expected to occur from Ce3+ to Tb3+ in LSN host, it can be further confirmed in Fig. 5(c). At the excitation of 360 nm, the emission intensity of LSN:0.09Ce3+,0.08Tb3+ in the region from 375 to 485 nm decreases compared with LSN:0.09Ce3+, while the green lines from Tb3+ simultaneously increases. To further investigate the energy absorption of the LaSi3N5 host lattice, the reflectance spectra of LSN, LSN:0.09Ce3+, and LSN:0.09Ce3+, 0.08Tb3+ phosphors are presented in Fig. 6. The LaSi3N5 host exhibits low energy absorption in the UV region, which is assigned as the host absorption. However, two obvious broad absorption bands with peaking at 298 nm and 380 nm of the LSN:0.09Ce3+ are observed due to the f–d absorption of the Ce3+ ions. Moreover, the absorption band of LSN:0.09Ce3+,0.08Tb3+ is similar to LSN:0.09Ce3+. The PLE spectrum and reflectance spectrum demonstrate that LSN:Ce3+,Tb3+ has broad absorption bond, which matches well with n-UV LED chips.
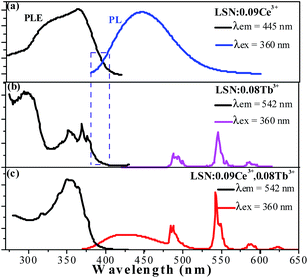 |
| | Fig. 5 The PL and PLE spectra of the as-synthesized LSN:0.09Ce3+ phosphor (a), LSN:0.08Tb3+ (b), and LSN:0.09Ce3+,0.08Tb3+ (c). | |
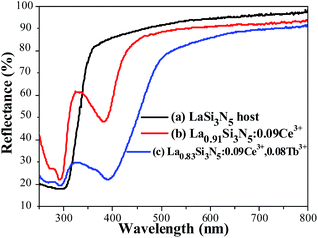 |
| | Fig. 6 Reflectance spectra of LaSi3N5 host (a), La0.91Si3N5:0.09Ce3+ (b), and La0.83Si3N5:0.09Ce3+,0.08Tb3+ (c). | |
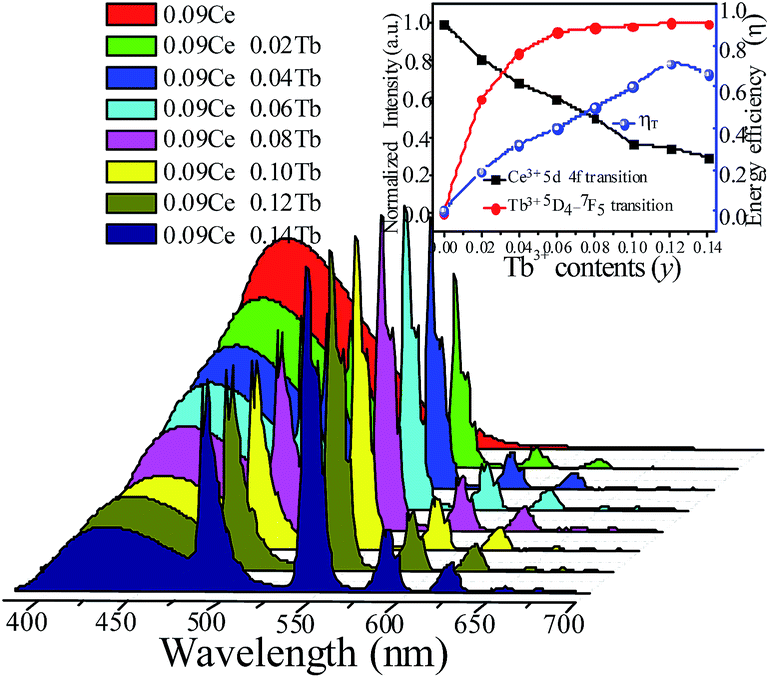
In order to study the relative intensities of the two emissions, a series of LSN:0.09Ce3+,yTb3+ phosphors have been prepared. Fig. 7 shows the emission spectra of LSN:0.09Ce3+,yTb3+ phosphors with y varying from 0 to 0.14 excited at 360 nm. With the increase of Tb3+ concentration, it is directly observed that the PL intensity of the Ce3+ decreases monotonically, whereas the green emission peaks of Tb3+ reach a maximum value at y = 0.12, and then decrease due to the nonradiative energy transfer of Tb3+. This result strongly illustrates the energy transfer from the Ce3+ to Tb3+ ions in the LSN host lattice and is shown in the inset of Fig. 7. Therefore, the CIE of the LSN:Ce3+,Tb3+ phosphor could be tuned by appropriately adjusting the relative ratio of Ce3+/Tb3+. The energy transfer efficiency (ηT) from the Ce3+ to Tb3+ can be calculated by the following equation:30,31
| |
 | (2) |
where
IS and
IS0 are the luminescence intensity of the sensitizer (Ce
3+) ion in the presence and absence of the activator (Tb
3+), respectively. The inset of
Fig. 7 displays the curve of
ηT of Ce
3+–Tb
3+ in LSN:0.09Ce
3+,
yTb
3+. As Tb
3+ content increases, the distance between Ce
3+ ions and Tb
3+ ions becomes shorter, which enhances the efficient energy transfer. The optimal
ηT (∼71%) is obtained when
y reached 0.12.
 |
| | Fig. 7 PL spectra for LSN:0.09Ce3+,yTb3+ phosphors on Tb3+ doping content (y) excited at 360 nm. The inset shows the emission intensity of Ce3+ and Tb3+ with different Tb3+ contents and energy transfer efficiency on changing Tb3+ contents. | |
3.3 Energy transfer mechanism of LSN:Ce3+,Tb3+ phosphors
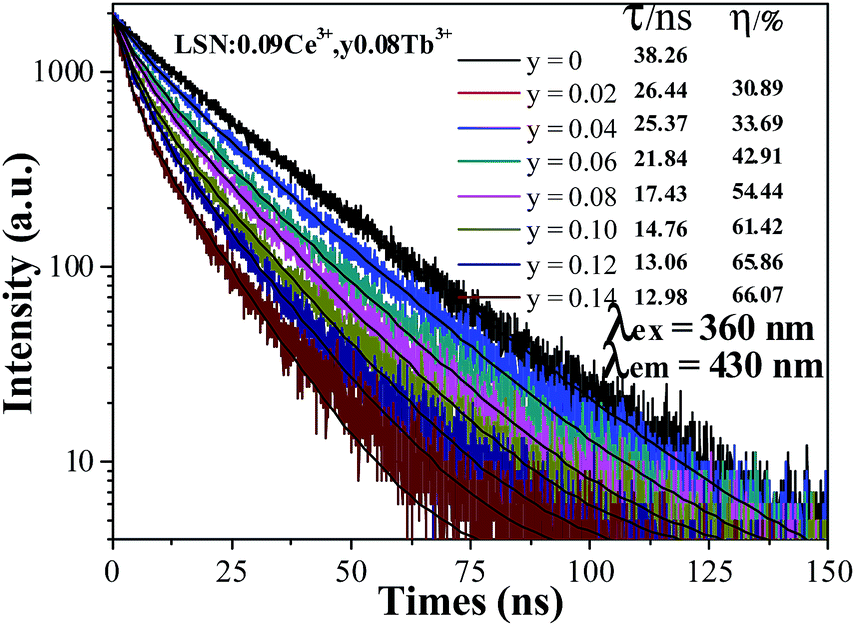
In order to further verify the process of energy transfer from Ce3+ to Tb3+ in LSN:Ce3+,yTb3+, the fluorescence decay curves of Ce3+ were measured by monitoring at 430 nm with excitation of 360 nm. As shown in Fig. 8, the decay curve of LSN:Ce3+ is agreeable to the single exponential rule with a lifetime of about 38.26 ns, due to single luminescent center in the host. However, the rest of decay curves deviates from the single exponential function and this phenomenon becomes more obvious with increase concentration of the Tb3+. Therefore, the experimental curves were fitted by the sum of two exponential decays using the formula:| | |
I(t) = I0 + A1exp(−t/τ1) + A2exp(−t/τ2)
| (3) |
where the I(t) represents the luminescence intensity at time t, A1 and A2 are constants, τ1 and τ2 are the decay times for the exponential components. The average decay time (τ) were estimated to be 26.44, 25.37, 21.84, 17.43, 14.76, 13.06 and 12.98 ns with function for the LSN:Ce3+,yTb3+ phosphors with y = 0.02, 0.04, 0.06, 0.08, 0.10, 0.12 and 0.14, respectively. The lifetimes of the Ce3+ ions decreased, which is the direct evidence for energy transfer from Ce3+ to Tb3+. Moreover, the energy transfer efficiency from Ce3+ to Tb3+ was also calculated from the decay lifetime by the equation:19| |
 | (4) |
where τS and τS0 are the lifetimes of Ce3+ ions with and without the presence of Tb3+ ions, respectively. As shown in the inset of Fig. 8, the energy transfer efficiency gradually increased and reached 65.86% for Tb3+ concentrations at y = 0.12, which is closed to the above result (∼71%).
 |
| | Fig. 8 Decay curves for the luminescence of Ce3+ ions in LSN:0.09Ce3+,yTb3+ phosphors (excited at 360 nm, monitored at 430 nm). | |
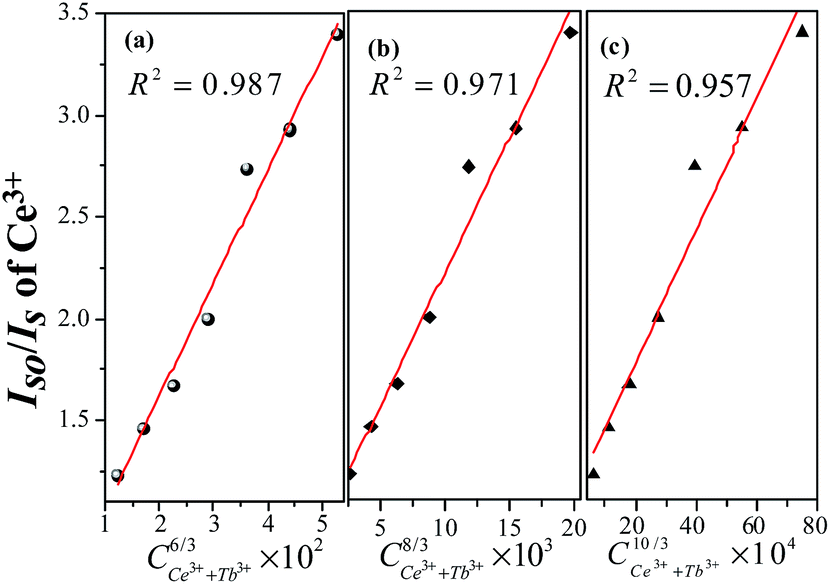
Normally, the energy transfer from sensitizer to activator may take place via exchange interaction and electric multipolar interaction.32,33 The exchange interaction would take place when the critical distance (Rc) between the doping ions was shorter than 4 Å. Base on the eqn (1), xc is the total concentration of Ce3+ and Tb3+ ion. For LSN:0.09Ce3+,0.08Tb3+ sample, V = 423.342 Å3, xc = 0.17 and N = 4, thus the Rc is determined to be 10.6 Å. It can be inferred that there is no mechanism of exchange interaction because the value of Rc (10.6 Å) is larger than 4 Å. The energy transfer occurs via multipolar interaction based on the Dexter theory:34
where
η0 and
η are the luminescence quantum efficiencies of the sensitizer (Ce
3+) ion in the absence and presence of the activator (Tb
3+),
C is the sum concentration of Ce
3+ and Tb
3+. The value of
η0/
η can be approximately calculated by the
IS0/
IS (relative luminescence intensity ratio). The value of
n is 6, 8, and 10 for dipole–dipole, dipole-quadrupole and quadrupole–quadrupole interactions, respectively. The relationships between
IS0/
IS and
Cn/3 are illustrated in
Fig. 9. It can be observed that the linear reaches the optimal when
n = 6 with
R2 = 0.987, indicating that energy transfer from Ce
3+ to Tb
3+ in the LaSi
3N
5 host should mainly through the dipole–dipole interaction. The energy transfer model Ce
3+–Tb
3+ in the LaSi
3N
5 is presented in Fig. S2.
†
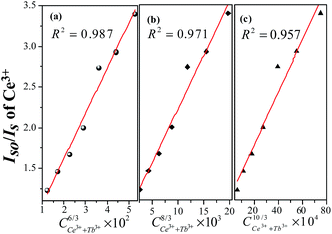 |
| | Fig. 9 Dependence of IS0/IS of Ce3+ on (a) C6/3, (b) C8/3 and (c) C10/3. The red lines indicate the fitting behaviors. | |
3.4 Thermal stability and chromaticity coordinates of LSN:Ce3+,Tb3+ phosphors
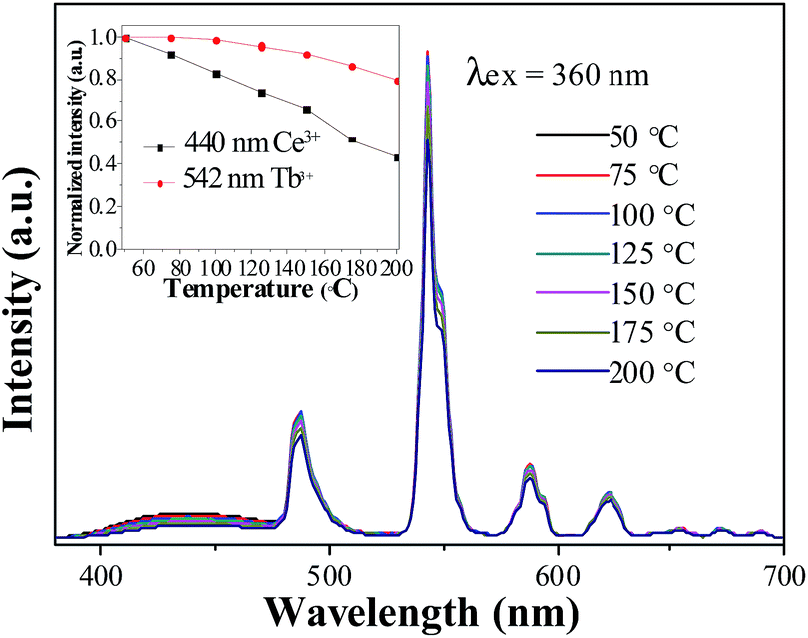
The thermal stability of phosphor is one of key parameters for practical phosphors. The temperature dependence of the luminescence for the LSN:0.09Ce3+,0.12Tb3+ phosphor under 360 nm excitation was investigated as a function of temperature in the range of 50–200 °C, as shown in Fig. 10. As the temperature is increased to 200 °C, the PL intensities of Ce3+ and Tb3+ decrease to 44% and 80% of the corresponding initial value (50 °C), which suggests that LSN:Ce3+,Tb3+ is a promising green phosphor for UV white LED. The shift of CIE coordinates is neglectable (x = 0.2763, y = 0.4439 → x = 0.2788, y = 0.4452) due to the relative weak component of blue emission. As the essential of thermal quenching is the result of interaction between electron and lattice under varying temperatures, leading to nonradiative transitions. Since the d–f transition of Ce3+ is more affected by crystal field environment than f–f transition of Tb3+, thus, the reason for different degradation rate of Ce3+ and Tb3+ is due to different degree of interactions between transition electron and lattice.
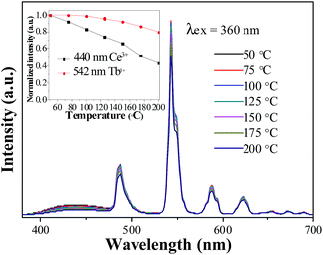 |
| | Fig. 10 Temperature-dependent emission spectra of LSN:0.09Ce3+,0.12Tb3+ phosphor. Inset shows the relative emission intensities as a function of temperature. | |
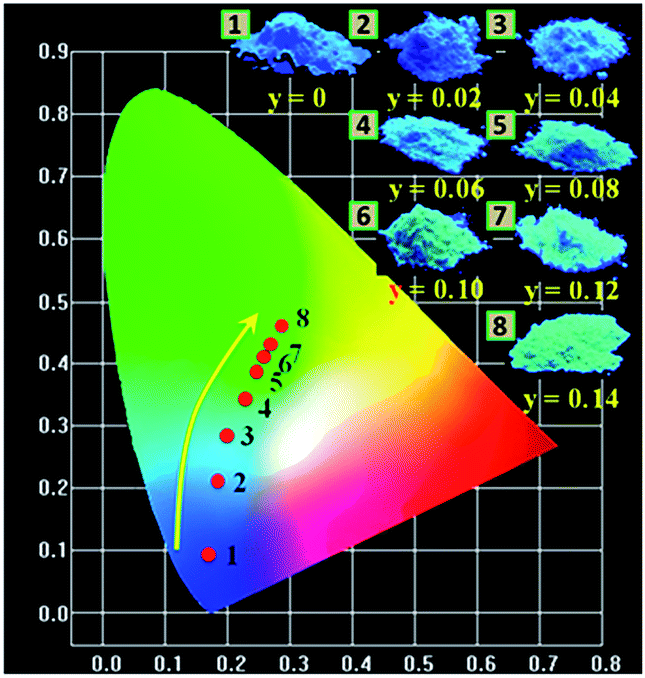
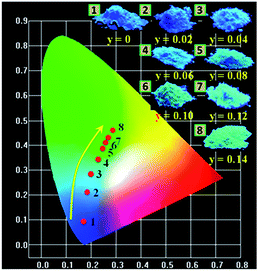
The CIE chromaticity diagram and a series of digital photographs of LSN:0.09Ce3+,yTb3+ phosphors upon 365 nm UV lamp excitation are presented in Fig. 11. The values of CIE (x, y) for LSN:0.09Ce3+,yTb3+ with different doping contents are listed in Table 2. It can be found that color-tunable of LSN:0.09Ce3+,yTb3+ phosphors can be obtained with increasing content of Tb3+ due to efficient Ce3+–Tb3+ energy transfer. The corresponding features of the chromaticity coordinates for the LSN:0.09Ce3+,yTb3+ phosphors could be changed from blue (0.1842, 0.0947) to green (0.2845, 0.4653) by adjusting the different emission compositions of the Ce3+ and Tb3+ concentration. Based on the results, it is clear that new blue-green emitting LSN:0.09Ce3+,yTb3+ phosphors can be efficiently excited in the UV range. It is suggesting that LSN:Ce3+,Tb3+ phosphor can act as a potential blue-green phosphor for WLEDs.
 |
| | Fig. 11 CIE chromaticity coordinates diagram of LSN:0.09Ce3+,yTb3+ (y = 0, 0.02, 0.04, 0.06, 0.08, 0.10, 0.12, 0.14) (point no. 1-8) and the digital photographs of corresponding samples under 365 nm UV lamp. | |
Table 2 CIE chromaticity coordinates (x, y) for LSN:0.09Ce3+,yTb3+ (y = 0, 0.02, 0.04, 0.06, 0.08, 0.10, 0.12, 0.14) phosphors upon excitation at 365 nm
| Sample no. |
Sample composition (y) |
CIE coordinates (x, y) |
| 1 |
0 |
(0.1824, 0.0947) |
| 2 |
0.02 |
(0.1924, 0.2092) |
| 3 |
0.04 |
(0.2216, 0.2899) |
| 4 |
0.06 |
(0.2400, 0.3423) |
| 5 |
0.08 |
(0.2553, 0.3853) |
| 6 |
0.10 |
(0.2703, 0.4287) |
| 7 |
0.12 |
(0.2763, 0.4439) |
| 8 |
0.14 |
(0.2845, 0.4653) |
4. Conclusions
A series of Ce3+/Tb3+ co-activated LaSi3N5 phosphors were synthesized through high temperature solid state reaction. The obtained phosphors show a broad excitation spectral range from 280 to 400 nm, which can meet the application requirements for UV LED chips. The energy transfer from Ce3+ to Tb3+ in LSN host has been investigated by PL and PLE spectra, together with the contents of Tb3+, and the decay curves of Ce3+. The energy transfer from Ce3+ to Tb3+ was mainly via a dipole–dipole reaction. The critical distance of energy transfer was calculated and has also been evaluated by the concentration quenching method. By adjusting Tb3+ doping concentration in LSN:0.09Ce3+,yTb3+, the emission of the phosphors can be tuned appropriately from blue (0.1824, 0.0947) to green (0.2845, 0.4653) and the luminescence efficiency of green emission reached the maxima at the Tb3+ concentration of 0.12. The LaSi3N5:Ce3+,Tb3+ phosphor could be potentially used as a green emitting phosphor for WLEDs.
Acknowledgements
The present work was supported by the Ministry of Science and National Key Research Program of China (No. 2016YFB0400600) and (No. 2016YFB0400605) and the National Key Basic Research Program of China (2014CB643801).
References
- C. Feldmann, T. Justel, C. R. Ronda and P. J. Schmidt, Adv. Funct. Mater., 2003, 13, 511–516 CrossRef CAS.
- R. J. Xie, N. Hirosaki, T. Suehiro, F. F. Xu and M. Mitomo, Chem. Mater., 2006, 18, 5578–5583 CrossRef CAS.
- L. Chen, R. H. Liu, W. D. Zhuang, Y. H. Liu, Y. S. Hu, X. F. Zhou and X. L. Ma, J. Alloys Compd., 2015, 627, 218–221 CrossRef CAS.
- Y. C. Jia, Y. J. Huang, Y. H. Zheng, N. Guo, H. Qiao, Q. Zhao, W. Z. Lv and H. P. You, J. Mater. Chem., 2012, 22, 15146–15152 RSC.
- X. Q. Piao, K. Machida, T. Horikawa, H. Hanzawa, Y. Shimomura and N. Kijima, Chem. Mater., 2007, 19, 4592–4599 CrossRef CAS.
- Z. G. Xia, J. Q. Zhuang, L. B. Liao, H. K. Liu, Y. Luo and P. Du, J. Electrochem. Soc., 2011, 158, 359–362 CrossRef.
- C. H. Huang and T. M. Chen, J. Phys. Chem. C, 2011, 115, 2349–2355 CAS.
- J. Zhou, Z. G. Xia, M. X. Yang and K. Shen, J. Mater. Chem., 2012, 22, 21935–21941 RSC.
- J. Y. Zhong, W. D. Zhuang, X. R. Xing, R. H. Liu, Y. F. Li, Y. H. Liu and R. S. Hu, J. Phys. Chem. C, 2015, 119, 5562–5569 CAS.
- T. Suehiro, N. Hirosaki, R. J. Xie and T. Sato, Appl. Phys. Lett., 2009, 95, 051903 CrossRef.
- Z. Inoue, M. Mitomo and N. Ii, J. Mater. Sci., 1980, 15, 2915–2920 CrossRef CAS.
- I. Ibrahim, Z. Lences, L. Benco, M. Hrabalova and P. Sajgalik, J. Eur. Ceram. Soc., 2014, 34, 2705–2712 CrossRef CAS.
- A. Yaguchi, T. Suehiro, T. Stao and N. Hirosaki, Appl. Phys. Express, 2011, 4, 022101 CrossRef.
- L. Y. Cai, X. D. Wei, H. Li and Q. L. Liu, J. Lumin., 2009, 129, 165–168 CrossRef CAS.
- J. W. Park, S. P. Singh and K. S. Sohn, J. Electrochem. Soc., 2011, 158, 184–188 CrossRef.
- J. S. Kim, P. E. Jeon, Y. H. Park, J. C. Choi, H. L. Park, G. C. Kim and T. W. Kim, Appl. Phys. Lett., 2004, 85, 3696 CrossRef CAS.
- X. G. Zhang and M. L. Gong, Dalton Trans., 2014, 2465–2472 RSC.
- D. L. Geng, M. M. Shang, Y. Zhang, H. Z. Lian and J. Lin, Inorg. Chem., 2013, 52, 13708–13718 CrossRef CAS PubMed.
- Z. G. Xia and R. S. Liu, J. Phys. Chem. C, 2012, 116, 15604–15609 CAS.
- M. Woike and W. Jeitschko, Inorg. Chem., 1995, 34, 5105–5108 CrossRef CAS.
- Y. Zhou, Y. Yoshizawa, K. Hirao, Z. Lences and P. Sajgalik, J. Eur. Ceram. Soc., 2011, 31, 151–157 CrossRef CAS.
- J. Rodriguez-Carvajal, Curr. Pharm. Des., 2001, 26, 12–19 Search PubMed.
- M. Woike and W. Jeitschko, Z. Kristallogr., 1996, 211, 813 CAS.
- G. R. Hatfield, B. Li, W. B. Hammond, F. Reidinger and J. Yamanis, J. Mater. Sci., 1990, 25, 4032–4035 CrossRef CAS.
- N. Guo, Y. H. Song, H. P. You, G. Jia, M. Yang, K. Liu, Y. H. Zheng, Y. J. Huang and H. J. Zhang, Eur. J. Inorg. Chem., 2010, 29, 4636–4642 CrossRef.
- J. L. Wu, G. Gundiah and A. K. Cheetham, Chem. Phys. Lett., 2007, 441, 250–254 CrossRef CAS.
- T. Suehiro, N. Hirosaki, R. J. Xie, K. Sakuma, M. Mitomo, M. Ibukiyama and S. Yamada, Appl. Phys. Lett., 2008, 92, 191904 CrossRef.
- Y. L. Zheng, W. D. Zhuang, X. R. Xing, J. Y. Zhong, R. H. Liu and Y. S. Hu, RSC Adv., 2016, 6, 68852–68859 RSC.
- M. M. Shang, G. G. Li, X. J. Kang, D. M. Yang, D. L. Geng and J. Lin, ACS Appl. Mater. Interfaces, 2011, 3, 2738–3746 CAS.
- G. Zhu, Y. H. Wang, Z. P. Ci, B. Liu, Y. R. Shi and S. Y. Xin, J. Lumin., 2012, 132, 531–536 CrossRef CAS.
- M. Shang, G. Li, D. Geng, D. Yang, X. Kang, Y. Zhang, H. Lian and J. Lin, J. Phys. Chem. C, 2012, 116, 10222–10231 CAS.
- F. Lahoz, I. Martin, R. J. Mendez and P. Nunez, J. Chem. Phys., 2004, 120, 6180–6190 CrossRef CAS PubMed.
- R. Reisfeld, E. Greenberg, R. Velapoldi and B. Barnett, J. Chem. Phys., 1972, 56, 1698 CrossRef CAS.
- D. L. Dexter, J. Chem. Phys., 1953, 21, 836–850 CrossRef CAS.
Footnote |
| † Electronic supplementary information (ESI) available: XRD patterns of La1−xSi3N5:xCe3+ and La1−ySi3N5:yCe3+; ET models for Ce3+–Tb3+ in the LaSi3N5 host. See DOI: 10.1039/c6ra25915d |
|
| This journal is © The Royal Society of Chemistry 2017 |
Click here to see how this site uses Cookies. View our privacy policy here. 
 Open Access Article
 This Open Access Article is licensed under a