
 Open Access Article
 This Open Access Article is licensed under a
 Creative Commons Attribution 3.0 Unported Licence
In situ Raman spectroscopy distinguishes between reversible and irreversible thiol modifications in L-cysteine
Paul Bazylewski*a,
Ranjith Divigalpitiyab and
Giovanni Fanchiniac
aDepartment of Physics and Astronomy, University of Western Ontario, 1151 Richmond St., London, ON N6A 3K7, Canada. E-mail: pbazylew@uwo.ca
b3M Canada Company, 1840 Oxford St., London, ON N5V 3R6, Canada
cDepartment of Chemistry, University of Western Ontario, 1151 Richmond St., London, ON N6A 5B7, Canada
First published on 12th January 2017
Abstract
In this study we introduce in situ Raman spectroscopy as an effective tool to distinguish between reversible and irreversible thiol modifications in L-cysteine, the most critical host for sulphydryls in proteins and enzymes. We place special emphasis on the conditions under which the formation and breakage of disulphide bonds is reversible and produces free thiol groups. Thiol groups from L-cysteine are highly reactive and are frequently converted into disulphide bonds via reaction with mercaptans, including S-methyl methanethiosulfonate (MMTS). It was previously claimed that disulphide groups can be reversibly introduced in and eliminated from L-cysteine in order to restore a free thiol group, using a reductant such as tris(2-carboxyethyl)phosphine (TCEP). Raman spectroscopy is found to effectively monitor the formation and subsequent breaking of disulphide bonds, and demonstrates that although TCEP is effective in breaking disulphide bonds, an excess of TCEP is required to reversibly form free thiol groups from L-cysteine. These results will be critical for cysteine–metal bonding investigations. Our Raman mode assignment in MMTS and TCEP also provides a benchmark for future studies using these compounds.
1. Introduction
L-Cysteine (Cys) is an amino acid common to many proteins and enzymes, and is of interest due to the presence of a reactive thiol group. Controlled functionalization of thiols in Cys is critical for a variety of applications including detoxification of heavy metals in living organisms,1 antioxidant capabilities of tissue and mitochondria,2 blood coagulation in mammals,3 transport across cell membranes,4 and electrochemical sensing.5 Thiol groups (SH) are present on many biologically relevant materials including glutathione and trypanotione,1,4 and cysteine-based thiols are widely employed in the formation of disulphide bonds.6–8 Disulphide bridges are important tertiary structural elements in proteins such as immunoglobulins, enzymes, hormones, procollagen and albumin.8 Disulphide bridging between cysteine residues has applications as an intermediate step in glycoprotein synthesis,6 or to reversibly control the conformation of proteins.9Conversion of a free thiol to a disulphide bridge can be accomplished using mercaptans, a family of sulphur-containing species that includes S-methyl methanethiosulfonate (MMTS). MMTS has been found to be more effective than other oxidants to form disulphides.10 Reaction of MMTS with thiols such as cysteine residues converts the thiol group to a neutral non-hydrogen bonding methylthio group containing a disulphide bond.11 This process has been used to introduce disulphide bridges into enzymes, including ethanolamine ammonia-lyase and lactate dehydrogenase where treatment with MMTS modifies the catalytic activity.12,13 Cleaving disulphide bridges is of comparable interest in protein and enzyme studies,14,15 and can be accomplished using a variety of thiol based materials such as mercaptoethanol (b-ME), dithiothreitol (DTT), or 2-nitro-5-thiocyanatobenzoic acid (NTCB) to cleave disulphide bonds.8,14–16 Tris(2-carboxyethyl)phosphine (TCEP) is preferred as a reducing agent in both alkaline and acidic conditions because unlike DTT, it is resistant to oxidation in air and is more hydrophilic.16,17
Although b-ME, DTT and TCEP have been used for thiol manipulation, in situ spectroscopic studies of the formation and breaking of disulphide bonds in these materials has seldom been reported. Completely reversible modification in an aqueous environment is claimed, and Raman is the ideal tool to investigate this by providing structural information while simultaneously probing for the presence of sulphur containing moieties.18 Determinations of disulphide concentration in cysteines,2,6,11 as well as the oxidation of TCEP14,16,17 have been reported, but a detailed investigation of the reversible formation and breakage of disulphide bridges in cysteines is lacking. In addition, no investigation of the vibrational structure of TCEP and MMTS has been performed, either individually or where reaction with Cys is concerned. In our study, we utilize Raman spectroscopy to study the interaction of Cys with MMTS and TCEP, and examine if the formation and breakage of disulphide groups is reversible and produces free thiol groups on cysteine. The Raman active modes of MMTS and TCEP are summarized, as well as those of the intermediate reaction products. We show that disulphide bonds are effectively broken by an excess of TCEP to yield free thiols.
2. Materials and methods
Eight cysteine-based samples were prepared in three steps according to the schematics shown in Fig. 1. In step (1), a 0.10 M stock solution of L-cysteine (Sigma Aldrich, CAS 59-90-4) was prepared by dissolving in deionized water at room temperature, and stirring for 10 minutes. Step (2) is the reaction shown in Fig. 1(a), performed by adding S-methyl methanethiosulfonate (MMTS, Sigma Aldrich, CAS 2949-92-0) to the Cys![[thin space (1/6-em)]](https://www.rsc.org/images/entities/char_2009.gif) :H2O solution from step (1) followed by 10 minutes of stirring at room temperature. In total three solutions of Cys:MMTS were prepared using molar ratios of 1:0.1, 1:0.5, 1:1. Step (3) is the reaction shown in Fig. 1(b) where tris(2-carboxyethyl)phosphine:HCl (TCEP, Sigma Aldrich, CAS 51805-45-9) was further added to the Cys:MMTS solution from step (2), followed by 10 minutes of stirring. In total 4 solutions were prepared in step (3) with Cys:TCEP molar ratios of 1:0.1, 1:0.5, 1:1, and 1:2. For Raman measurements, 3 mL aliquots were collected in glass vials and dried at 70 °C in air until 1 mL of solution remained.
:H2O solution from step (1) followed by 10 minutes of stirring at room temperature. In total three solutions of Cys:MMTS were prepared using molar ratios of 1:0.1, 1:0.5, 1:1. Step (3) is the reaction shown in Fig. 1(b) where tris(2-carboxyethyl)phosphine:HCl (TCEP, Sigma Aldrich, CAS 51805-45-9) was further added to the Cys:MMTS solution from step (2), followed by 10 minutes of stirring. In total 4 solutions were prepared in step (3) with Cys:TCEP molar ratios of 1:0.1, 1:0.5, 1:1, and 1:2. For Raman measurements, 3 mL aliquots were collected in glass vials and dried at 70 °C in air until 1 mL of solution remained.
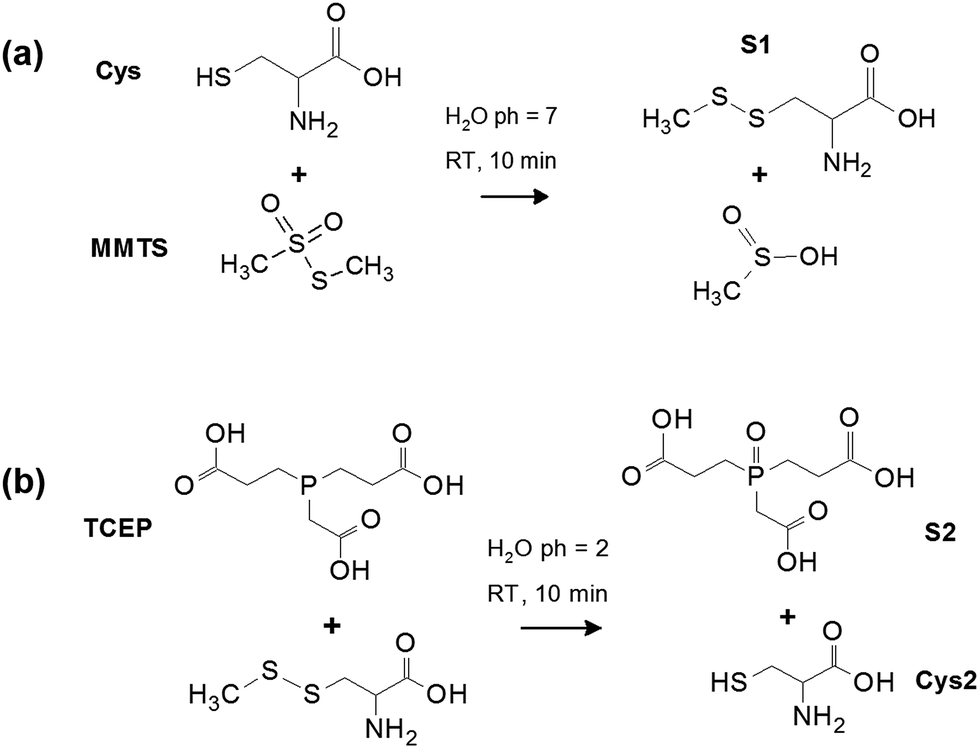 | ||
| Fig. 1 (a) Schematic of L-cysteine reaction with MMTS to convert the cysteine thiol to a disulphide bond and produce product S1 (cystine). (b) Schematic of disulphide breakage to restore the thiol group of cysteine using TCEP, resulting in the irreversible oxidation of TCEP to form S2. L-Cysteine containing free thiols after disulphide breakage is labelled Cys2. | ||
Unpolarised Raman spectra were recorded in the 200–3200 cm−1 range on a Renishaw InVia Microscope equipped with a Leica DM2600M microscope and a 20× objective in a backscattering arrangement. A Renishaw 633 nm helium–neon laser with a maximum output power of 17 mW was used as the excitation source. Raman spectra were recorded using a CCD array (1024 × 256 pixels) that was Peltier cooled to −70 °C, and equipped with a notch filter for rejection of elastically scattered laser light. The power at the sample surface was 0.085 mW μm−2 across a 20 μm2 area. Special attention was devoted to prevent damage to the sample from the laser.
3. Results and discussion
3.1 Raman modes of L-cysteine, MMTS and TCEP
Fig. 1 shows the reaction schemes of MMTS and TCEP with Cys at room temperature. Reaction of Cys with MMTS forms product S1 containing a disulphide bond, and produces an MMTS residue. The disulphide bridge replaces the native thiol in Cys, resulting in a decrease in intensity of Cys SH stretching modes (2400–2500 cm−1) with a simultaneous appearance of strongly Raman active SS bending modes (∼500 cm−1) as disulphide bridges are formed. Fig. 1(b) shows the second step of the process where TCEP:HCl is added to the mixture to both lower the pH from 7 to 2 and break disulphide bonds formed by MMTS. TCEP is an effective reducing agent at mildly acidic pH, and reacts with a different mechanism of disulphide bond breakage compared to other sulfhydryl compounds such as DTT.16 The TCEP–disulphide reaction is kinetically controlled and results in the production of free thiol groups when disulphide bonds are broken. The generated thiol functional groups are less chemically reactive because ionization is suppressed by the lowered pH, preventing the formation of a thiolate anion.16 Therefore, cross-reaction of the thiol groups and reformation of disulphide bonds should be prevented. The final step after disulphide breaking is the irreversible oxidation of TCEP to form S2 in Fig. 1(b). These reactions either individually or combined, are widely used in many applications such as synthesis of enzymes and the study of protein catalytic activity and conformation.4,6,9,12,13 However, only indirect chemical methods have been employed to examine the thiol concentration in these studies, while no direct spectroscopy measurements have been conducted to examine the reactants or the products.
Fig. 2 shows Raman spectra of Cys, MMTS, and TCEP dissolved in water. Identification of Raman active modes in these reference materials provides a fingerprint of their structure. The Raman modes of Cys have been investigated in detail by Minkov et al.19 and Pawlukojć et al.20 Therefore, the Cys bands observed in Fig. 2 can be precisely assigned. From these authors, we assigned the peaks centered at 2982 cm−1, 2953 cm−1 and 2928 cm−1 to CH2 asymmetric stretching, CH2 symmetric stretching and CH stretching, respectively. Hydrosulphide vibrations are typically located at about 2500 cm−1. From Fig. 2, it is also apparent that SH stretching modes in Cys present two distinct Raman active peaks, 2543 cm−1 and 2574 cm−1, which originate from SH⋯O and SH⋯S vibrations, respectively.20 SH stretching vibrations are strongly Raman active and display a high intensity signal, making Raman the ideal tool for observations. Other vibrations involving sulphur are observed, including an SH bending mode centered at 941 cm−1, a group of CS stretching modes centered at 616 cm−1, 660 cm−1 and 678 cm−1, and SS stretching modes at 498 cm−1, 512 cm−1 and 529 cm−1. The lowest mode at 498 cm−1 is characteristic of cystine which is present as an impurity in the Cys sample.21 The modes at 512 cm−1 and 529 cm−1 are due to two conformers of the disulphide bond, specifically the gauche–gauche–gauche (GGG) and gauche–gauche–trans (GGT) conformers.22 These modes are expected to change drastically when the Cys thiol is modified, and can be used as a probe of any changes. Many other modes are visible in the 250–1500 cm−1 arising from other vibrations in Cys, for instance the CH2 rocking vibration (775 cm−1), and have been exhaustively described elsewhere.19,20
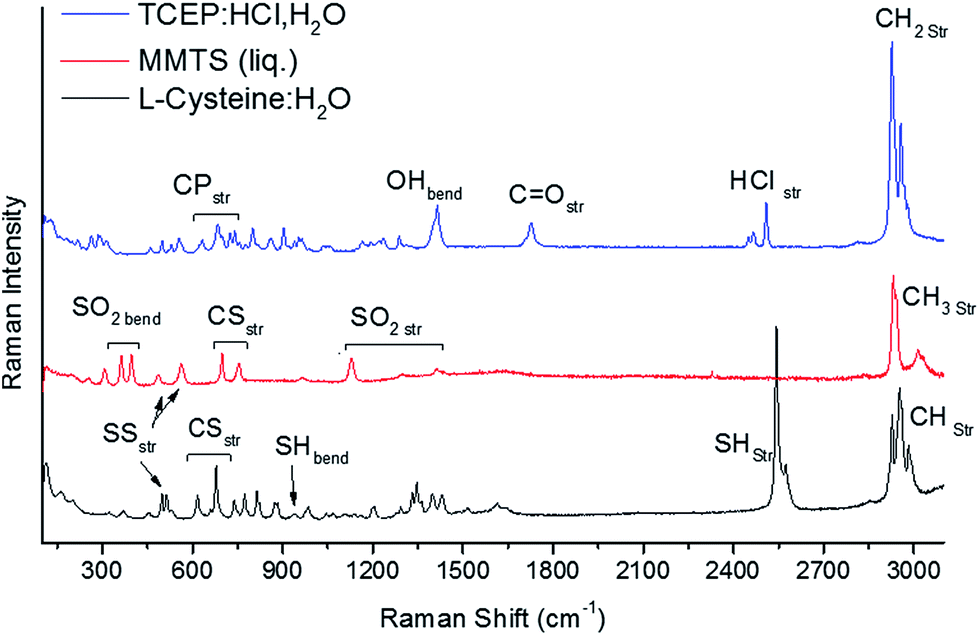 | ||
| Fig. 2 Raman spectra of L-cysteine, TCEP, and MMTS. Labelled modes are used for fingerprinting of these materials and to monitor changes to sulphur-containing groups. | ||
Differently from the Raman modes of Cys, the vibrational modes of MMTS and TCEP have not been as thoroughly investigated.13 However, their assignment can be undertaken by considering what types of stretching and bending modes in these molecules involve a change in polarizability and, therefore, are Raman active.23 In MMTS, modes have been assigned as shown in Table 1. CH stretching modes are found in the 2600–3200 cm−1 region. Two peak doublets are evident in this region of the MMTS spectra. They are centered at 2936 cm−1 and 3021 cm−1, respectively, and they present CH3 symmetric and asymmetric stretching modes.23,24 Below 1500 cm−1, SO2 stretching (1110–1430 cm−1) and bending (325–345 cm−1) vibrations can be observed, along with CS stretching modes in the 665–780 cm−1 region.13,24 These modes comprise the set of Raman active modes in liquid MMTS, and have been assigned by considering literature sources documenting the analysis of the vibrational spectra of related small molecules.23–25
| Cys mode | Frequency (cm−1) | MMTS mode | Frequency (cm−1) | TCEP mode | Frequency (cm−1) |
|---|---|---|---|---|---|
| CH2str | 2954 | CH3str,asym | 3013 | CH2str,asym | 2966 |
| 2982 | 3030 | 2980 | |||
| CHstr | 2928 | CH3str,sym | 2932 | CH2str,sym | 2927 |
| 2940 | 2956 | ||||
| SHstr | 2543 | SO2str,asym | 1300 | HClstr | 2450 |
| 2574 | 1414 | 2520 | |||
| SHbend | 941 | SO2str,sym | 1128 | C![[double bond, length as m-dash]](https://www.rsc.org/images/entities/char_e001.gif) Ostr Ostr |
1730 |
| CSstr | 616 | CSstr | 698 | OHbend | 1415 |
| 660 | 752 | ||||
| 678 | |||||
| SSstr | 498 | SSbend | 560 | CPstr | 620 |
| 750 | |||||
| SO2bend | 363 | ||||
| 397 |
The Raman-active modes of TCEP:HCl are also shown in Fig. 2, and were assigned according to ref. 23–25. Four peaks representing CH2 modes are visible in the 2900–3000 cm−1 region, and assigned to CH2 symmetric (2927, 2956 cm−1) and antisymmetric stretching modes (2966, 2980 cm−1). At lower frequencies, stretching vibrations arising from HCl used as a low-pH stabilizer are also visible at 2450–2520 cm−1. Vibrational peaks assigned to CO stretching vibrations (1730 cm−1), OH bending vibrations (1415 cm−1) and C–P stretching modes (620–750 cm−1) are reported in Table 1 and had been previously found in relatively similar compounds in the literature.23–25 These peaks can be used as fingerprints of TCEP, particularly the OH bending and CO stretching modes, which are localized in the correspondence of carboxyl groups. A large number of additional bands are noticeable in the 250–1350 cm−1 region arising from C–C vibrations, including: wagging, twisting, and rocking modes, and possibly others.23–25 Complex vibrations of this type are expected to be quite sensitive to molecular changes. The intensity of modes in this region drastically decreases when TCEP reacts with other compounds. For this reason, monitoring changes in the stable stretching and bending modes of sulphur containing groups has been preferred in our study.
3.2 Disulphide bond formation via MMTS
The formation of disulphides can be observed in detail using Raman spectroscopy to probe the vibrational modes of these bonds after reaction of Cys with MMTS and TCEP. Fig. 3 shows Raman spectra of 0.10 M Cys:H2O after mixing with MMTS:H2O at various concentrations. MMTS reacts readily with thiol groups and the changes in modes related to sulphur can be readily monitored as the formation of a disulphide bridge significantly increases the number of sulphur related vibrational modes in Cys. When a low concentration of 0.01 M MMTS is combined with 0.10 M Cys, the SH stretching mode is strongly reduced in intensity [Fig. 3(b)] in proportion to the MMTS concentration, and an equal MMTS:Cys ratio is required to reduce SH modes to zero intensity. In the fingerprint region below 1000 cm−1, conversion of Cys to S1 can be tracked through changes in CS stretching and SS bending modes. Additional bands centred at 338 cm−1 and 367 cm−1 representing SO2 bending modes are also observed, and increase in intensity proportional to MMTS concentration. From their locations, these bands cannot be assigned to unreacted MMTS. Rather, they should be assigned to residual MMTS, containing one SO2 group. The SS bending modes, consisting of a group of four peaks, each centred at 498 cm−1, 503 cm−1, 509 cm−1, and 541 cm−1 are associated with cystine, the disulphide in S1, and the GGG and TGT torsional conformers of these disulphides, respectively.21,22 The 498 cm−1 peak from cystine shows a maximum intensity at a low concentration of MMTS, suggesting trace amounts of MMTS promote the formation of cystine rather than product S1. The CS stretching mode at 660 cm−1 in unmodified Cys is red shifted to 684 cm−1, and new CS stretching modes appear at 633 cm−1, 670 cm−1 and 690 cm−1 due to both the MMTS residue and the S–CH3 attached to Cys to form the disulphide bridge (Table 2).
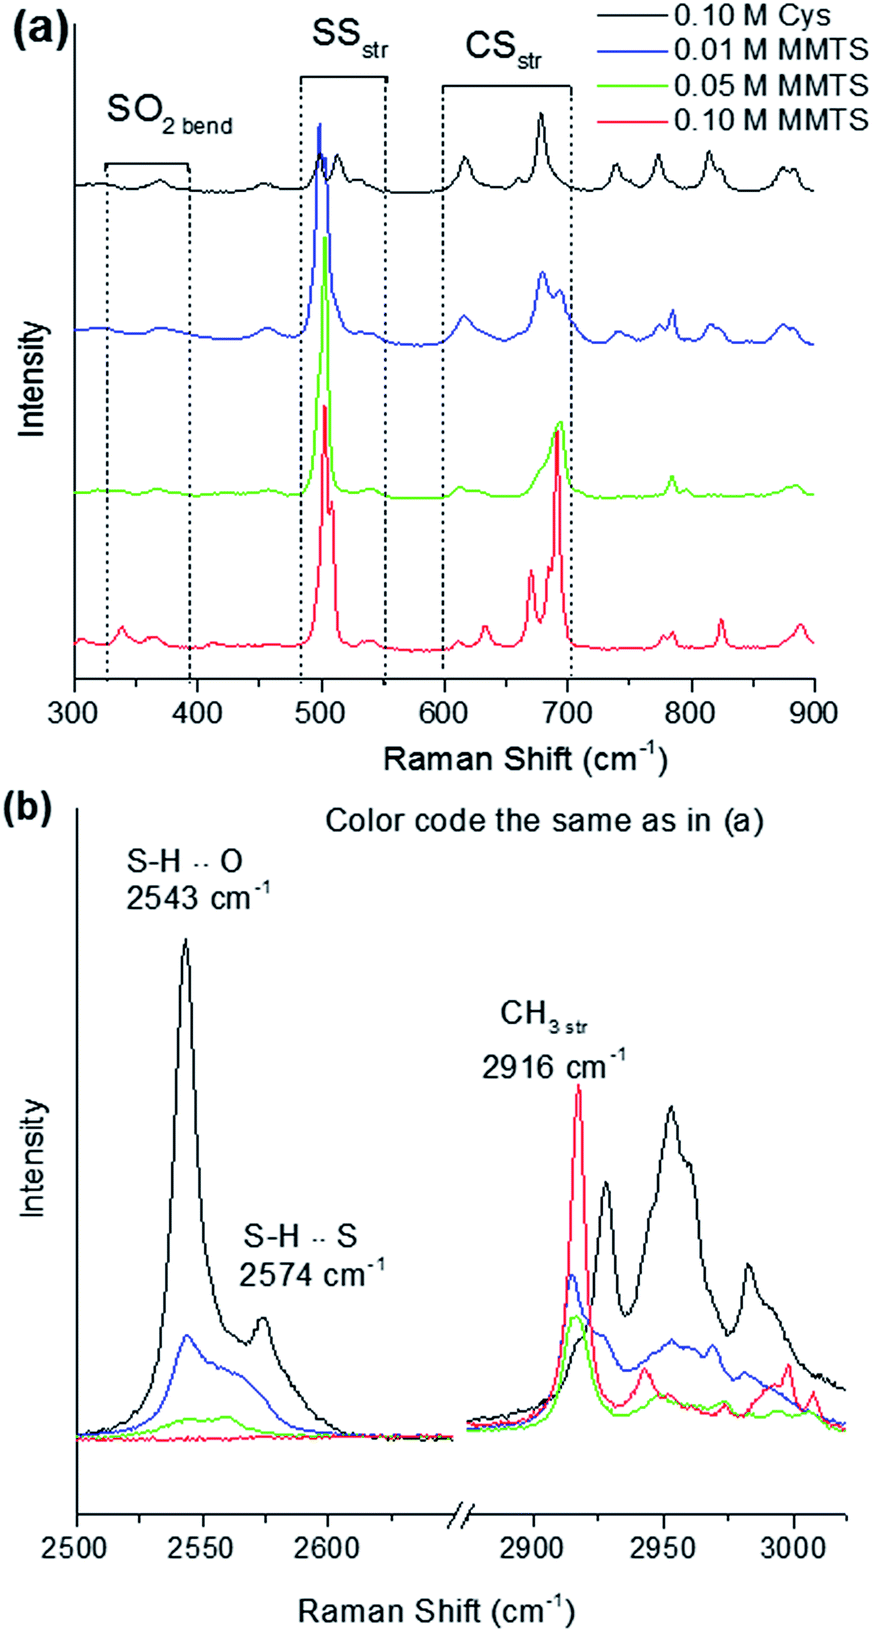 | ||
| Fig. 3 Raman spectra of L-cysteine mixed with different concentrations of MMTS. (a) In the low wavenumber fingerprint region, groups of modes representing sulphur functional groups are labelled. (b) Capping of the thiol group by MMTS is observed by intensity reduction of SH stretching modes. CH stretching modes are reduced in intensity in favour of a single prominent band at 2916 cm−1 arising from stretching vibrations in the CH3 capping group, introduced by MMTS. | ||
| S1 mode | Frequency (cm−1) | S2 mode | Frequency (cm−1) | Cys2 mode | Frequency (cm−1) |
|---|---|---|---|---|---|
| CH3str | 2916 | CH3str | 2924 | SHstr | 2460 |
| 2954 | 2530 | ||||
| 2573 | |||||
| CH2str | 2943 | COstr |
1725 | SHbend | 941 |
| 2998 | |||||
| CSstr | 611 | OHbend | 1411 | CSstr | 644 |
| 633 | 681 | ||||
| 670 | |||||
| 684 | |||||
| 690 | |||||
| SSstr | 498 | POstr |
1294 | ||
| 503 | |||||
| 509 | |||||
| 541 | |||||
| SO2bend | 337 | CCstr | 904 | ||
| 365 |
The CH3 group present in S1 also causes significant changes to CH stretching modes at high wavenumber from 2900–3000 cm−1. From Fig. 3(b), Cys CH2 modes are suppressed in favour of a strong CH3 stretching band at 2916 cm−1 in molecule S1. The change in structure due to the disulphide causes a shift in electron distribution into the disulphide group way from the rest of the molecule, resulting in a blue shift of 16 ± 1 cm−1 from 2954 cm−1 in one CH2 stretching band, and a red shift of 11 ± 1 cm−1 from 2982 cm−1 in the other. These spectra verify that MMTS quickly and efficiently produces disulphide bridges on Cys in an aqueous environment, to form product S1 without evidence of unreacted material. The small fraction of cystine present does not affect the reaction with MMTS. Notably, however, using trace amounts of MMTS promote the formation of cystine rather than the desired product S1.
3.3 TCEP interaction with modified L-cysteine
The disulphide bonds attached to Cys during the reaction with MMTS shown in Fig. 1(a) can be broken to result in thiol groups by mixing with TCEP. When TCEP:H2O solution (pH = 1–2) is combined with a Cys:MMTS, a clear pH = 2 solution is obtained with no precipitation. Fig. 4(a) shows Raman spectroscopy the lower wavenumber region of several Cys:MMTS:TCEP mixtures, showing many bands characteristic of both Cys and oxidized TCEP, which are the expected products of the reaction shown in Fig. 2(b). Adding 0.01 M TCEP has a marginal effect on the vibrational spectrum, with SS bending and CS stretching modes unchanged from the original solution of Cys:MMTS. When 0.05 M and 0.10 M TCEP is mixed in, new modes in the 1250–1800 cm−1 region are detected specific to the TCEP carboxyl group in the form of OH bending (1725 cm−1) and CO stretching modes (1411 cm−1). These modes are slightly blue shifted from the positions in pure TCEP due to oxidation. This is the origin of the PO stretching mode observed at 1294 cm−1 that is present only if TCEP is oxidized, indirectly indicating that disulphide bonds have been broken.
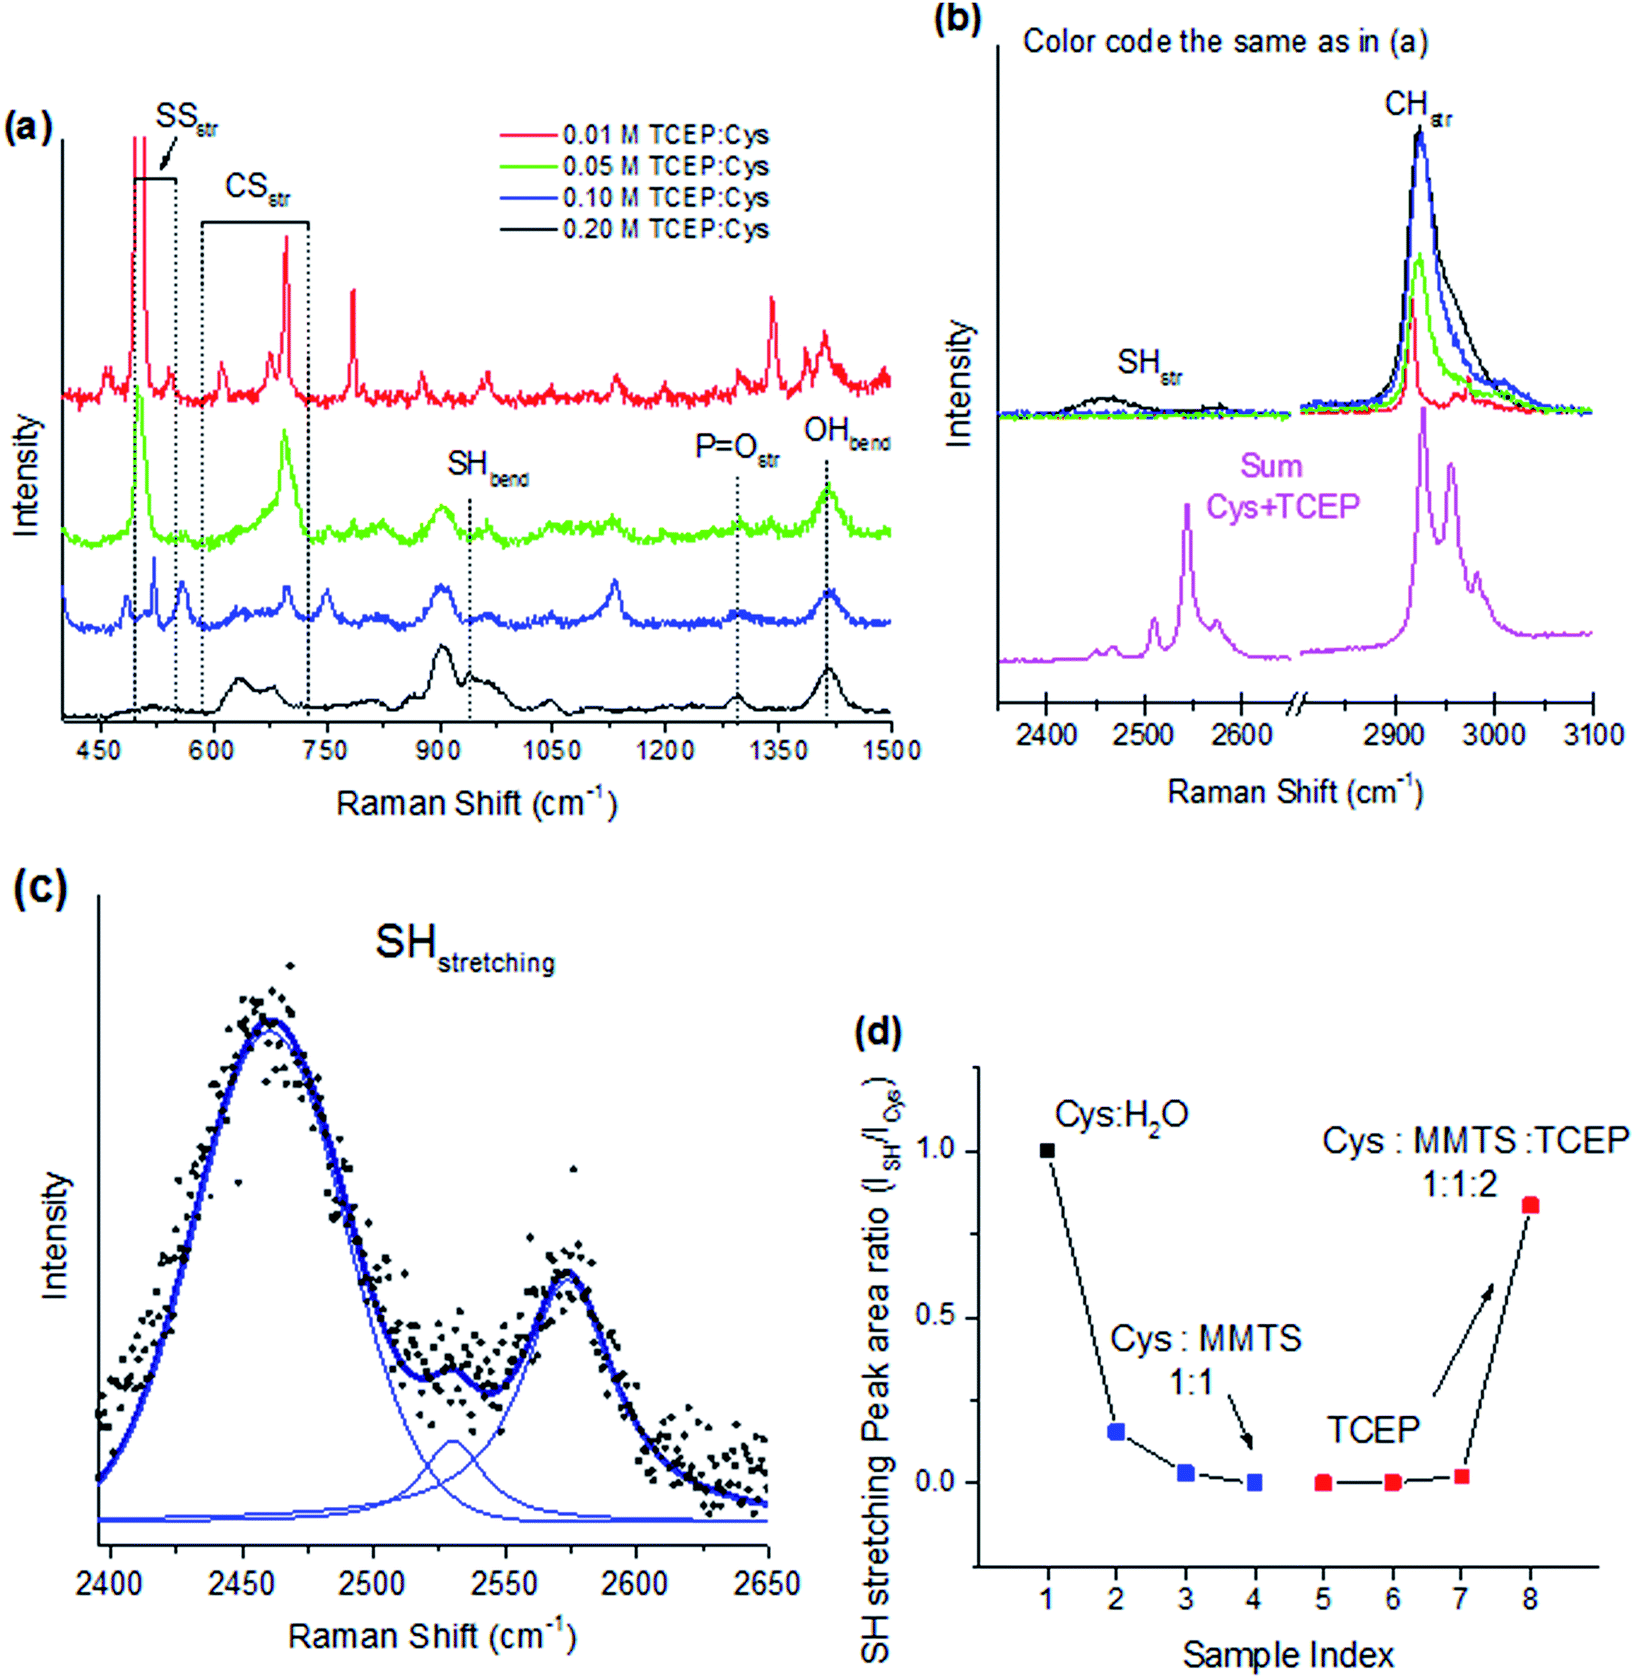 | ||
| Fig. 4 Detachment of disulphide bonds with TCEP application. At equivalent concentration of L-cysteine, TCEP cleaves all disulphide bonds. (a) The lower wavenumber region displays the fingerprint of TCEP after reaction with a disulphide bond. (b) The higher wavenumber region is compared to the summation of Cys and TCEP spectra. Restoration of the Cys thiol group is observed at a Cys:TCEP ratio of 1:2. (c) Peak fitting using Voigt functions to characterize SH stretching modes reveals three distinct bands. (d) The integrated peak intensity for the range 2380–2640 cm−1 calculated for each spectrum in Fig. 3(c) and 4(b) as a ratio relative to Cys:H2O. Approximately 80% of cysteine SH groups are recovered with excess TCEP. | ||
In the 450–750 cm−1 region, CS and SS stretching modes undergo significant changes when TCEP is mixed. The CS stretching features of compound S1, seen in Fig. 2(a), undergo profound changes at TCEP:Cys ratios of 2:1 or higher. The five features identified previously are present at the final stage as two broad features at 633 and 680 cm−1. The feature at 633 cm−1 is assigned to MMTS and methylthio residues from the disulphide bond breaking process. The feature at 680 cm−1 is a characteristic CS stretching mode of Cys, indicating the original structure has been recovered after treatment with excess TCEP. Changes to SS stretching modes also indicate a recovery of Cys along with the breaking of disulphide bridges. As the concentration on TCEP increases, the intensity of SS stretching modes decreases sharply. At equal molar ratios of TCEP and Cys, the disulphide band at 503 cm−1 assigned to S1 is reduced to zero intensity, indicating that all disulphide bonds are broken. Unquestionably these results show TCEP efficiently breaks disulphide bonds in low pH solutions, but the SH stretching vibrational modes must be further analysed to confirm that free thiol groups result from the breakage.
Fig. 4(b) shows CH and SH stretching modes above 2500 cm−1 Raman shift. Changes to the CH stretching modes can be understood by comparison to a summation of raw Cys and TCEP spectra from Fig. 2. The line shape and peak positions of the sum correspond to their counterparts in the final solution with TCEP and Cys with the main peak positioned at 2925 cm−1. This feature is red shifted relative to the prominent CH stretching mode in S1 originating from the –S–CH3 group vibrating at 2916 cm−1, verifying that S1 has been reacted completely with TCEP to produce unmodified Cys in the final solution. SH stretching and bending modes of unmodified Cys also become detectable when an excess of TCEP is applied. The SH bending mode of Cys is noticeable at 941 cm−1, and increases with increasing TCEP content, indicating that free thiols have been formed. This effect is corroborated by the presence of SH stretching modes in the 2400–2500 cm−1 region, which is demonstrated in Fig. 4(b).
Analysis of SH stretching modes is accomplished using peak fitting with Voigt functions to account for both instrumental and lifetime broadening in the 2400–2600 cm−1 region. The fitting reveals three distinct peaks centered at 2460 cm−1, 2530 cm−1, and 2573 cm−1 that are due to SH⋯O, SH⋯OP, and SH⋯S stretching vibrations, respectively. The broadening seen in these features, to be compared with the sum of the individual molecules (Fig. 4(b), magenta curve) reflects a large distribution of vibrational frequencies due increased interactions in solution, in turn causing suppression of the band intensity as it is spread across a larger wavenumber range. The SH⋯O band is blue shifted and suppressed in intensity relative to unmodified Cys (Fig. 2) due to interaction with oxidized TCEP in addition to water molecules. The new SH⋯OP band appears from coordination with oxidized TCEP, and the SH⋯S band is unchanged compared to Cys shown in Fig. 2. The presence of these bands and the lack of any shift in the SH⋯S band indicates that the Cys thiol group has been restored after reaction with TCEP.
Fig. 4(d) shows the integrated area of peaks in the 2400–2600 cm−1 region normalized to the area in Cys. The peak area decreases sharply with application of MMTS as disulphide bridges are formed. Breakage of these bonds using TCEP shows SH stretching mode intensity is recovered to 80% of its original value when a 2:1 TCEP:Cys ratio is used. Side-reactions on free thiols with oxygen to form disulphide bonds such as in cystine or reaction of TCEP with excess MMTS may account for the absence of SH stretching vibrations when lower concentrations of TCEP are used.
4. Conclusions
The reversible formation and cleavage of disulphide bonds on the thiol group of L-cysteine has been examined here in detail using Raman spectroscopy. MMTS was employed as an effective reactant to form a disulphide bridge in Cys. Disulphide bonds can be broken using a reducing agent, and TCEP is claimed be ideal in this application and is capable of producing free thiols on cysteines without back reactions. At a 1:1 ratio, MMTS is shown to completely convert all of the cysteine thiols into product S1 with disulphide bonds as indicated by an inverse relationship between the intensity of SH sand SS stretching modes. By contrast when a trace amount of MMTS is used, cystine is preferentially formed. TCEP was found to be effective at disulphide bond breakage, but free thiols on Cys are only evident when a molar excess of TCEP is used. Therefore, the process is found to be reversible and produce free thiols under the condition of excess TCEP.
Raman spectroscopy is used to identify the modes of two reaction products S1 and S2 in aqueous solution resulting from disulphide formation in Cys and oxidation of TCEP, respectively. These results build on the body of knowledge concerning disulphide formation in cysteines, and provide a benchmark mode assignment for Raman spectroscopy of MMTS and TCEP. Cysteines and disulphides are integral components of many protein and enzyme synthesis applications, and Raman spectroscopy has been presented as an excellent tool to probe the activity of sulphur containing groups. The use of Raman spectroscopy to monitor thiol reactions is not limited to small molecule amino acids as discussed in this work, and can be extended to the study of other small molecules, peptides, and proteins without modification. Although the number of observed Raman modes increases with molecule size, any thiol or disulphide groups present will remain highly Raman active, and can be readily observed as a probe of thiol activity.
Acknowledgements
PB acknowledges a MITACS Accelerate postdoctoral fellowship. GF acknowledges a Canada Research Chair in Carbon-based nanomaterials, financial support from the Canada Foundation for Innovation (project no. 212442), an Early Researcher Award from the Ontario Ministry of Research and Innovation, a Petro Canada Young Innovator Award and funding from the Natural Sciences and Engineering Research Council of Canada under the Discovery Grant program (grant no. RGPIN-2015-06004).Notes and references
- M. Enescu, J.-P. Renault, S. Pommeret, J.-C. Mialocq and S. Pin, Phys. Chem. Chem. Phys., 2003, 5, 3762–3772 RSC.
- R. Requejo, T. R. Hurd, N. J. Costa and M. P. Murphy, FEBS J., 2010, 277, 1465–1480 CrossRef CAS PubMed.
- H. P. H. Liang, T. M. Brophy and P. J. Hogg, Biochem. J., 2011, 437, 455–460 CrossRef CAS PubMed.
- J. S. Park, S. J. Hughes, F. K. M. Cunningham and J. R. Hammond, Mol. Pharmacol., 2011, 80, 735–746 CrossRef CAS PubMed.
- S. Muralikrishna, K. Sureshkumar, T. S. Varley, D. H. Nagaraju and T. Ramakrishnappa, Anal. Methods, 2014, 6, 8698 RSC.
- Q. Wan and S. J. Danishefsky, Angew. Chem., Int. Ed., 2007, 46, 9248–9252 CrossRef CAS PubMed.
- M. W. Pantoliano, R. C. Ladner, P. N. Bryan, M. L. Rollence, J. F. Wood and T. L. Poulos, Biochemistry, 1987, 26, 2077–2082 CrossRef CAS PubMed.
- R. Singh and G. M. Whitesides, Thiol-disulphide interchange, in Sulphur-Containing Functional Groups, ed. S. Patai and Z. Rappoport, John Wiley & Sons, Inc., Chichester, UK, 1993, DOI:10.1002/9780470034408.ch13.
- M. Shimaoka, C. Lu, R. T. Palframan, U. H. von Andrian, A. McCormack, J. Takagi and T. A. Springer, Proc. Natl. Acad. Sci. U. S. A., 2001, 98, 6009–6014 CrossRef CAS PubMed.
- A. R. Karala and L. W. Ruddock, Antioxid. Redox Signaling, 2007, 9, 527–531 CrossRef CAS PubMed.
- D. Roberts, S. D. Lewis, D. P. Ballou, S. T. Olson and J. A. Shafer, Biochemistry, 1986, 25, 5595–5601 CrossRef CAS PubMed.
- M. G. Kopczynski and B. M. Babior, J. Biol. Chem., 1984, 259, 7652–7654 CAS.
- M. E. D. Lestard, S. B. Díaz, M. E. Tuttolomondo, S. S. Cortez, M. Puiatti, A. B. Pierini and A. B. Altabef, Spectrochim. Acta, Part A, 2012, 97, 479–489 CrossRef PubMed.
- J. C. Han and G. Y. Han, Anal. Biochem., 1994, 220, 5–10 CrossRef CAS PubMed.
- P. Liu, B. W. O'Mara, B. M. Warrack, W. Wu, Y. Huang, Y. Zhang, R. Zhao, M. Lin, M. S. Ackerman, P. K. Hocknell, G. Chen, L. Tao, S. Rieble, J. Wang, D. B. Wang-Iverson, A. A. Tymiak, M. J. Grace and R. J. Russell, J. Am. Soc. Mass Spectrom., 2010, 21, 837–844 CrossRef CAS PubMed.
- J. A. Burns, J. C. Butler, J. Moran and G. M. Whitesides, J. Org. Chem., 1991, 56, 2648–2650 CrossRef CAS.
- E. Burmeister Getz, M. Xiao, T. Chakrabarty, R. Cooke and P. R. Selvin, Anal. Biochem., 1999, 273, 73–80 CrossRef PubMed.
- D. Pal and P. Chakrabarti, J. Biomol. Struct. Dyn., 1998, 15, 1059–1072 CAS.
- V. S. Minkov, S. V. Goryainov, E. V. Boldyreva and C. H. Görbitz, J. Raman Spectrosc., 2010, 41, 1458–1468 CrossRef CAS.
- A. Pawlukojć, J. Leciejewicz, A. J. Ramirez-Cuesta and J. Nowicka-Scheibe, Spectrochim. Acta, Part A, 2005, 61, 2474–2481 CrossRef PubMed.
- G. Zhu, X. Zhu, Q. Fan and X. Wan, Spectrochim. Acta, Part A, 2011, 78, 1187 CrossRef PubMed.
- H. E. Van Wart and H. A. Scheraga, Proc. Natl. Acad. Sci. U. S. A., 1986, 83, 3064–3067 CrossRef CAS.
- M. Reichenbacher and J. Popp. Challenges in Molecular Structure Determination, Springer-Verlag, Berlin, Heidelberg, 2012, DOI:1007/978-3-642-24390-5_2.
- J. B. Lambert, Introduction to organic spectroscopy, Macmillan, New York, 1987 Search PubMed.
- E. Smith and G. Dent, Modern Raman Spectroscopy– A Practical. Approach, John Wiley & Sons Ltd, England, 2005 Search PubMed.
| This journal is © The Royal Society of Chemistry 2017 |