DOI:
10.1039/C6RA25767D
(Paper)
RSC Adv., 2017,
7, 4479-4491
Identification and characterization of in vitro phase I and reactive metabolites of masitinib using a LC-MS/MS method: bioactivation pathway elucidation†
Received
24th October 2016
, Accepted 26th December 2016
First published on 16th January 2017
Abstract
Masitinib is a selective tyrosine kinase inhibitor (TKI). It is currently registered in Europe for the treatment of mast cell tumors in dogs. The current study reports the identification and characterization of fourteen phase I metabolites of masitinib by reversed phase liquid chromatography triple quadrupole mass spectrometry (LC-QqQ-MS). Phase I metabolic reactions were reduction, demethylation, hydroxylation, oxidation and N-oxide formation. Structures of the proposed phase I metabolites showed high lability to form reactive metabolites. So incubation was performed in the presence of 1.0 mM GSH or 1.0 mM KCN to check for reactive metabolites. No GSH adduct was found, while eight cyano adduct structures were determined based on full MS scan and MS2 scan data for each metabolite. Interestingly, a literature review showed no previous studies have been made on the in vitro metabolism of masitinib or detailed structural identification of the formed metabolites.
1. Introduction
Nowadays, cancer is considered a major cause of death.1 Four and half million new cancer cases have been reported in developed countries.2,3 Distributed cancer was recently treated by molecular targeting strategies based upon discovering the tumor suppressors and oncogenes involved in the progress of human cancers.4
Tyrosine kinases are enzymes that catalyse the transfer of the γ phosphate of ATP to the tyrosine hydroxyl groups on target proteins. They initiate or stop many functions inside living cells.5 Controlling the activity of tyrosine kinase in the cell regulates many important processes such as cell cycle, proliferation and cell death. Growth factor receptor-mediated signalling, in many cases, drives the abnormal proliferation characteristics of cancer. The failure of the control mechanism in tumor cells leads to excessive phosphorylation.6,7 There are around 60 receptor tyrosine kinases that have been known. Tyrosine kinase inhibitors (TKIs) are considered a very important class of targeted therapy which interferes with specific cell signalling pathways that allow targeting selected malignancies.8
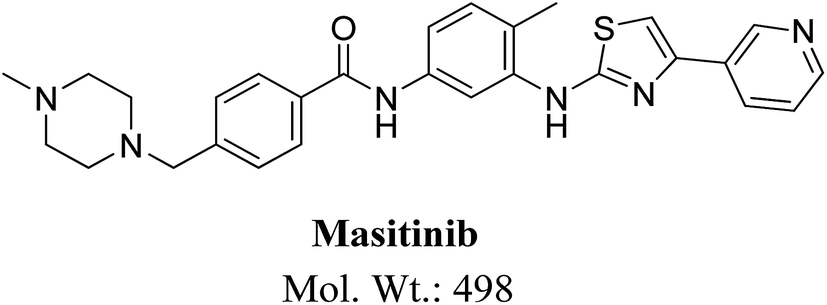
Masitinib (Fig. 1) is a TKI used in the treatment of mast cell tumors in dogs.9 It is currently registered in Europe for the treatment of mast cell tumors in dogs.10 It acts selectively targeting mainly wild type forms and mutated c-kit receptor (c-Kit R), platelet-derived growth factor receptors (PDGFRα/β), LCK gene, LYN gene, fibroblast growth factor receptor 3 (FGFR3) and focal adhesion kinase (FAK). It is considered to be the first approved veterinary therapy used as anticancer for the treatment of unresectable canine mast cell tumors (CMCTs), which harbors activating (c-Kit R) mutations at dose of 12.5 mg kg−1 per day.11 Masitinib is distributed under the trade name Masivet in Europe since the second part of 2009. It is also available for veterinaries in the USA under the trade name Kinavet since 2011. It exhibits more activity and selectivity against KIT than imatinib in in vitro studies.12
 |
| | Fig. 1 Chemical structure of masitinib. | |
The current work reports the identification of fourteen metabolites in addition to eight cyanide adducts that elucidate the bioactivation pathways and may provide hints for the observed clinical adverse effects of masitinib.10 No GSH adduct was detected in case of incubation of masitinib with GSH. Bioactivation is responsible for observed toxicities including hepatotoxicity,10,13–15 the experiments were performed in vitro and focused on the structural identification of the produced in vitro metabolites along with the cyanide adducts.
2. Chemicals and methods
2.1. Chemicals
RLMs were prepared in-house using Sprague Dowley rats.16 Animals' maintenance was performed following the guidelines of Animal Care Center, College of Pharmacy, King Saud University and approved by Local Animal Care and Use Committee of King Saud University. Masitinib was bought from LC Laboratories (Woburn, MA, USA). Ammonium formate, HPLC grade acetonitrile (ACN), potassium cyanide (KCN) and formic acid were purchased from Sigma-Aldrich (West Chester, PA, USA). HPLC water was obtained from Milli-Q plus purification system, Millipore, Waters (Millipore, Bedford, MA, USA).
2.2. Chromatographic conditions
Study of masitinib fragmentation pattern was performed using an Agilent HPLC 1200 connected to triple quadrupole mass spectrometer (Agilent 6410 QqQ) by direct injection on a connector instead of a column. Fragmentation study was then followed by a biotransformation technique; in which masitinib metabolites were produced in vitro and resolved with LC-QqQ-MS. Incubation of masitinib was performed with rat liver microsomes (RLMs) with and without KCN or GSH.
Chromatographic separation for extract of the incubation mixture was performed on an Agilent HPLC 1200 series system. The chromatography was performed on reversed phase C18 column (Agilent eclipse plus, 50 mm × 2.1 mm and 1.8 μm particle size). Column temperature was maintained constant at 24 °C. The flow rate of the mobile phase was 0.2 mL min−1. Binary system was used for separation of incubation matrix components that consisted of solvent A which is 10 mM ammonium formate (pH: 4.2) and solvent B which is ACN. The stepwise gradient was 5 to 40% B (0–30 min), 40% B (30–40 min), 40 to 5% B (40–45 min). The post time was 15 minutes. Injection volume of sample was 10 μL with a total run time of 45 minutes. Flow injection analysis was used to optimize all mass parameters for masitinib. MS2 mass spectra for masitinib and its metabolites were generated in the collision cell. Detection was performed on QqQ MS detector, operated with an ESI source in the positive ionization mode. Low purity nitrogen was used as drying gas at a flow rate of 12 L min−1 and high purity nitrogen as collision gas at a pressure of 60 psi. Source temperature and capillary voltage were set at 350 °C and 4000 V, respectively. Fragmentor voltage was set at 110 V with collision energy of 15 V for masitinib, its phase I metabolites and cyano adducts.
2.3. RLMs incubations
Thirty μM masitinib was incubated with 1.0 mg mL−1 RLMs and 50 mM Na/K phosphate buffer (pH 7.4) containing 3.3 mM MgCl2 at 37 °C for 10 min. Metabolic reaction was initiated by addition of 1.0 mM NADPH and quenched after 120 min by addition of 2 mL of ice-cold ACN. The incubation was done at 37 °C in a shaking water bath for 120 min. Proteins were removed by centrifugation (14![[thin space (1/6-em)]](https://www.rsc.org/images/entities/char_2009.gif) 000 rpm, 10 min and 4 °C). The supernatants were transferred to clean tubes and then evaporated to dryness under stream of N2. The residue was reconstituted in ACN/water (1:1). The same experiment was repeated using 1.0 mM GSH or 1.0 mM KCN to capture bioactive metabolites. Similarly, negative control experiments were performed following the above procedures but without addition of masitinib, while positive control experiments were done without adding NADPH. All the control experiments data were provided as ESI file.†
000 rpm, 10 min and 4 °C). The supernatants were transferred to clean tubes and then evaporated to dryness under stream of N2. The residue was reconstituted in ACN/water (1:1). The same experiment was repeated using 1.0 mM GSH or 1.0 mM KCN to capture bioactive metabolites. Similarly, negative control experiments were performed following the above procedures but without addition of masitinib, while positive control experiments were done without adding NADPH. All the control experiments data were provided as ESI file.†
2.4. Identification of in vitro phase I masitinib metabolites
The detection of in vitro phase I masitinib metabolites was done by full MS scan and MS2 experiments. Extracted ion chromatogram (EIC) was used to locate metabolites in the total ion chromatogram (TIC) of the metabolic mixture. MS2 experiments were done for expected metabolites. MS2 mass spectra were used to elucidate the metabolite structure by reconstructing the marker fragment ions.
3. Results and discussion
3.1. Fragmentation study of masitinib
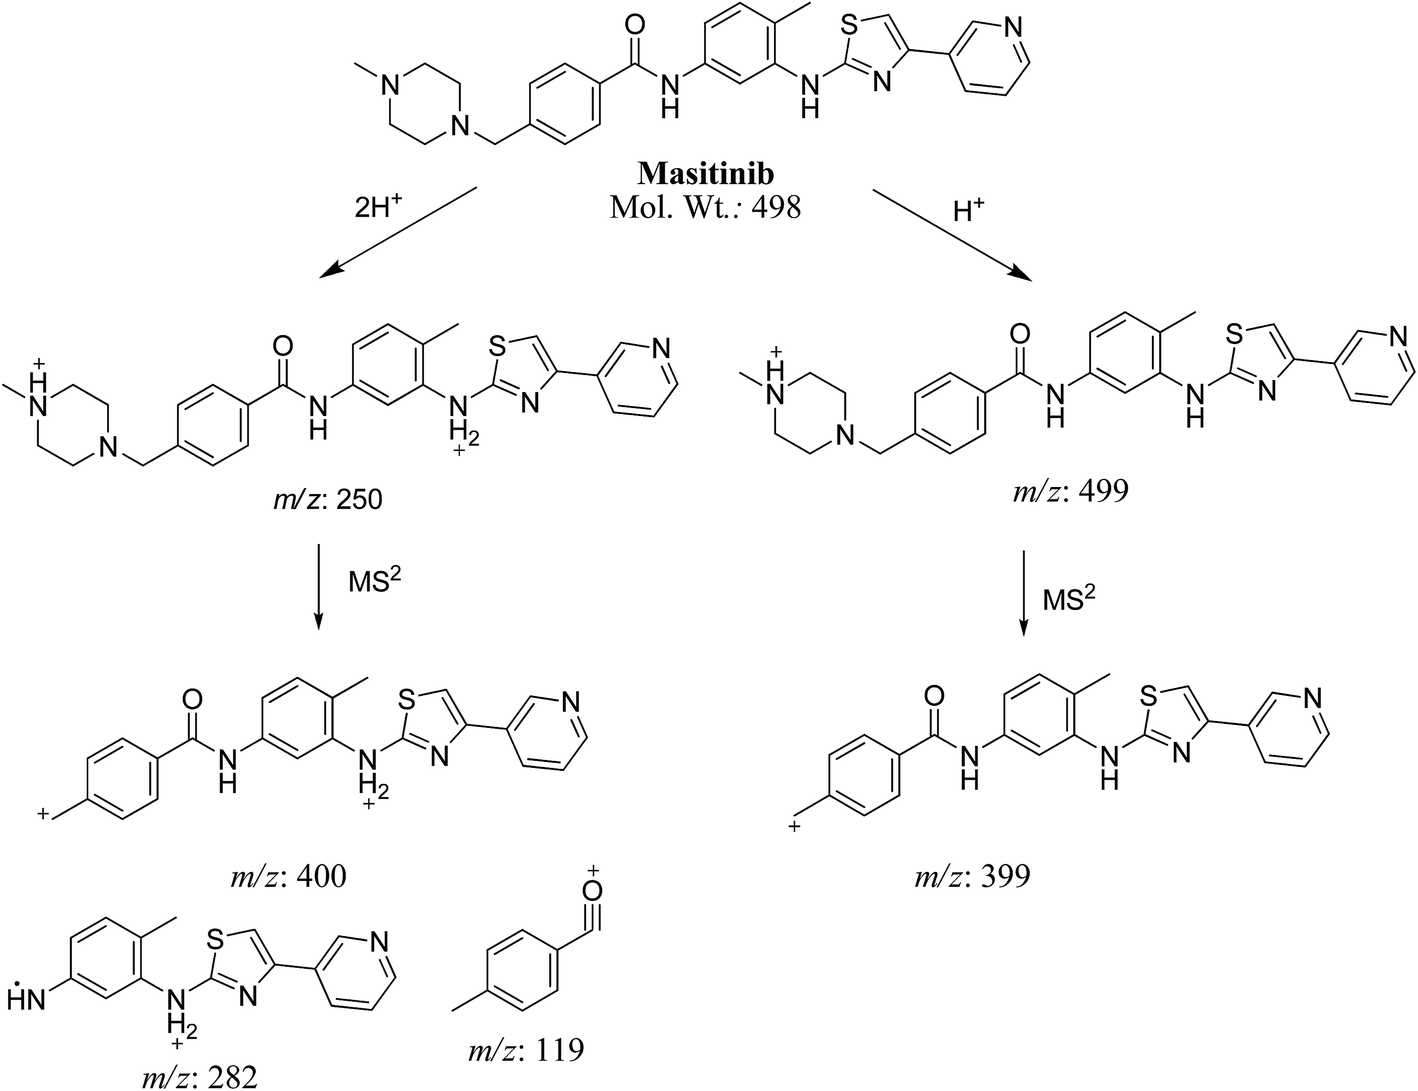
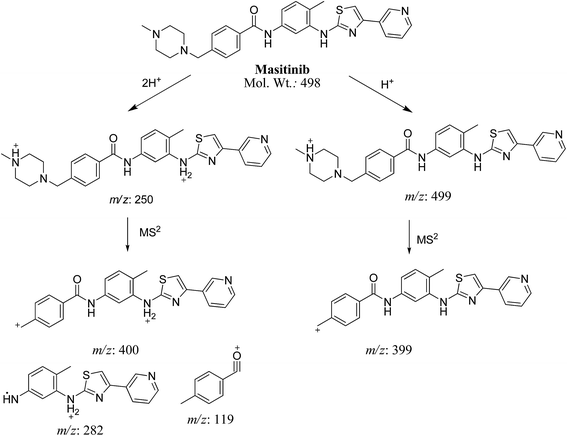
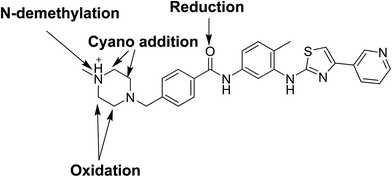
MS scan spectra of masitinib in LC-QqQ-MS show that masitinib molecular ion peak appears as [M + H]+ ion at m/z 499 and as [M + 2H]2+ at m/z 250 (Fig. 2A). The MS2 mass spectrum for [M + H]+ ion at m/z 499 gave only one major product ion at m/z 399 (Fig. 2B) which represent the loss of methyl piperazine group by single bond cleavage (Scheme 1).
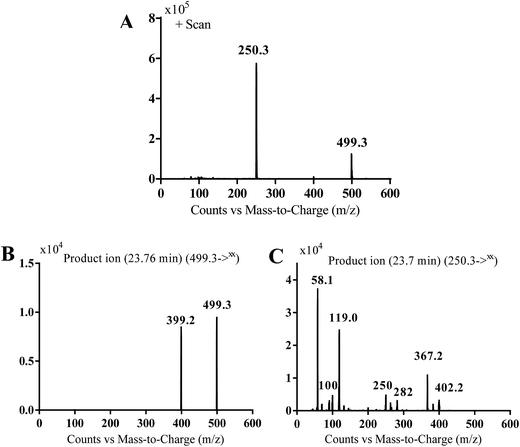 |
| | Fig. 2 MS scan spectrum for masitinib (A). MS2 mass spectrum of [M + H]+ ion (m/z 499) (B). MS2 mass spectrum of [M + 2H]2+ (m/z 250) (C). | |
 |
| | Scheme 1 Fragmentation pattern for masitinib [M + H]+ at m/z 499 and [M + 2H]2+ at m/z 250. | |
Fragmentation of [M + 2H]2+ at m/z 250 in LC-QqQ-MS gave more qualitative information about the weakest bonds in the masitinib chemical structure and gave many product ions compared to [M + H]+ as explained in Scheme 1 (Fig. 2C).
3.2. Identification of in vitro phase I masitinib metabolites
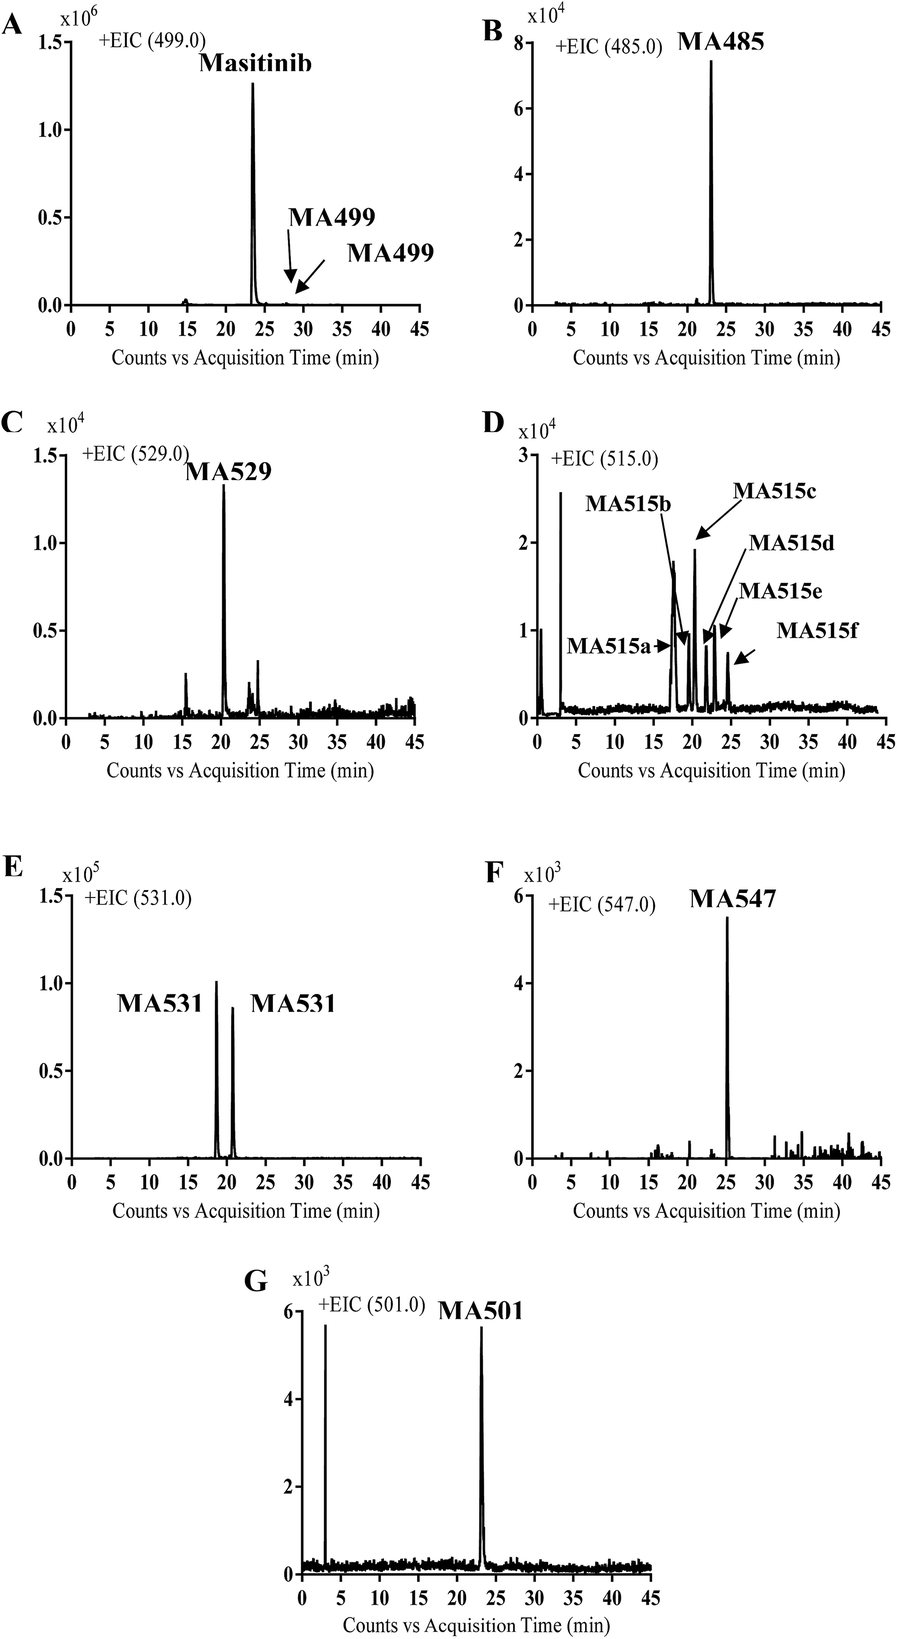
Comparison of EIC between incubations mixture with control samples as well as comparison of MS2 mass spectra of masitinib and proposed metabolites (Table 1) allowed the detection of fourteen metabolites formed through five metabolic reactions (N-demethylation, N-oxidation, oxidation, reduction and hydroxylation). Fig. 3 shows the EICs of masitinib and its metabolites.
Table 1 In vitro phase I metabolites of masitinib
| |
MS scan |
MS2 product ions |
tR (min) |
Phase I metabolic reaction |
| MA499a |
499 |
449, 399, 217 |
27.9 |
Oxidation and N-demethylation |
| MA499b |
499 |
449, 399, 217 |
29 |
Oxidation and N-demethylation |
| MA485 |
485 |
399 |
23.3 |
N-demethylation |
| MA529 |
529 |
511, 399, 98 |
21.2 |
Oxidation and hydroxylation |
| MA515a |
515 |
497.4, 415, 397.2, 99.3, 372.4 |
17.4 |
N-oxide formation |
| MA515b |
515 |
497.1, 397.1 |
19.4 |
Benzylic hydroxylation |
| MA515c |
515 |
400.1, 367 |
20.3 |
Hydroxylation of pyridine ring |
| MA515d |
515 |
415, 217 |
21.7 |
N-oxide formation of pyridine ring |
| MA515e |
515 |
415, 217 |
22.8 |
N-oxide formation |
| MA515f |
515 |
455.2, 428, 415, 400, 381.3, 98.1, 71.7 |
24.5 |
N-oxide formation of piperazine ring |
| MA531a |
531 |
513, 472, 364, 98 |
18.0 |
N-oxide formation of piperazine ring and benzylic hydroxylation |
| MA531b |
531 |
531, 431, 364, 339, 98 |
20.5 |
N-oxide formation of pyridine ring and benzylic hydroxylation |
| MA547 |
547 |
511 |
25.1 |
N-oxide formation of pyridine and piperazine ring and benzylic hydroxylation |
| MA501 |
501 |
401 |
23.4 |
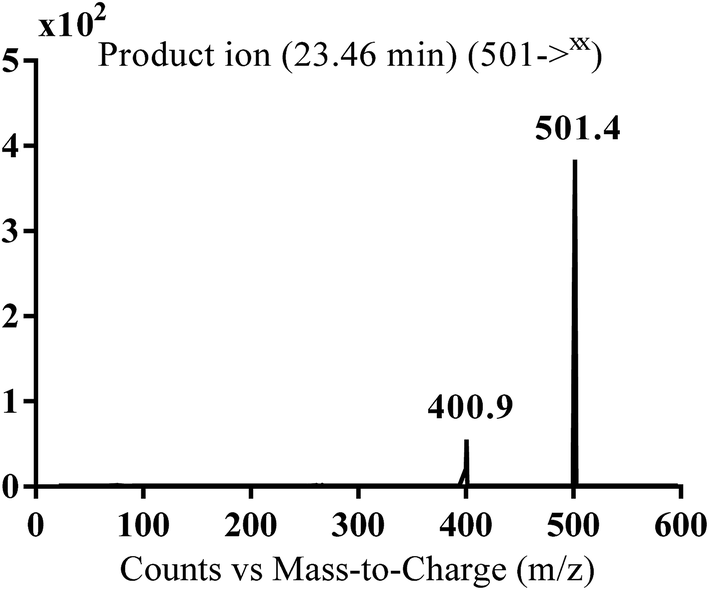
Reduction of carbonyl group |
 |
| | Fig. 3 EICs of molecular ion peaks at m/z 499 (A), 485 (B), 529 (C), 515 (D), 531 (E), 547 (F) and 501 (G) corresponding to masitinib or one of its phase I metabolites. | |
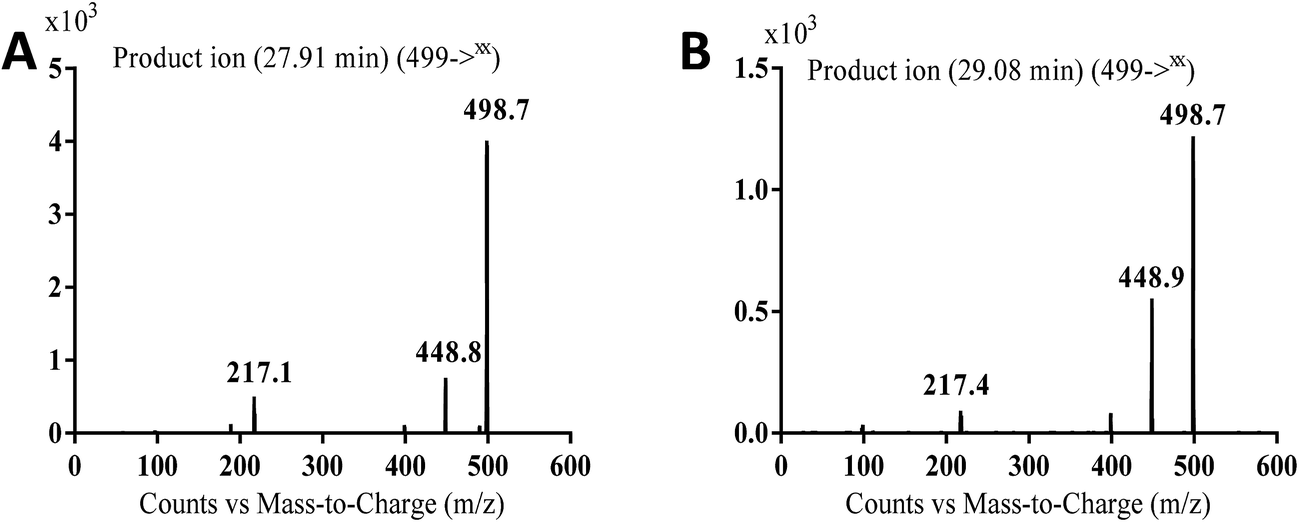
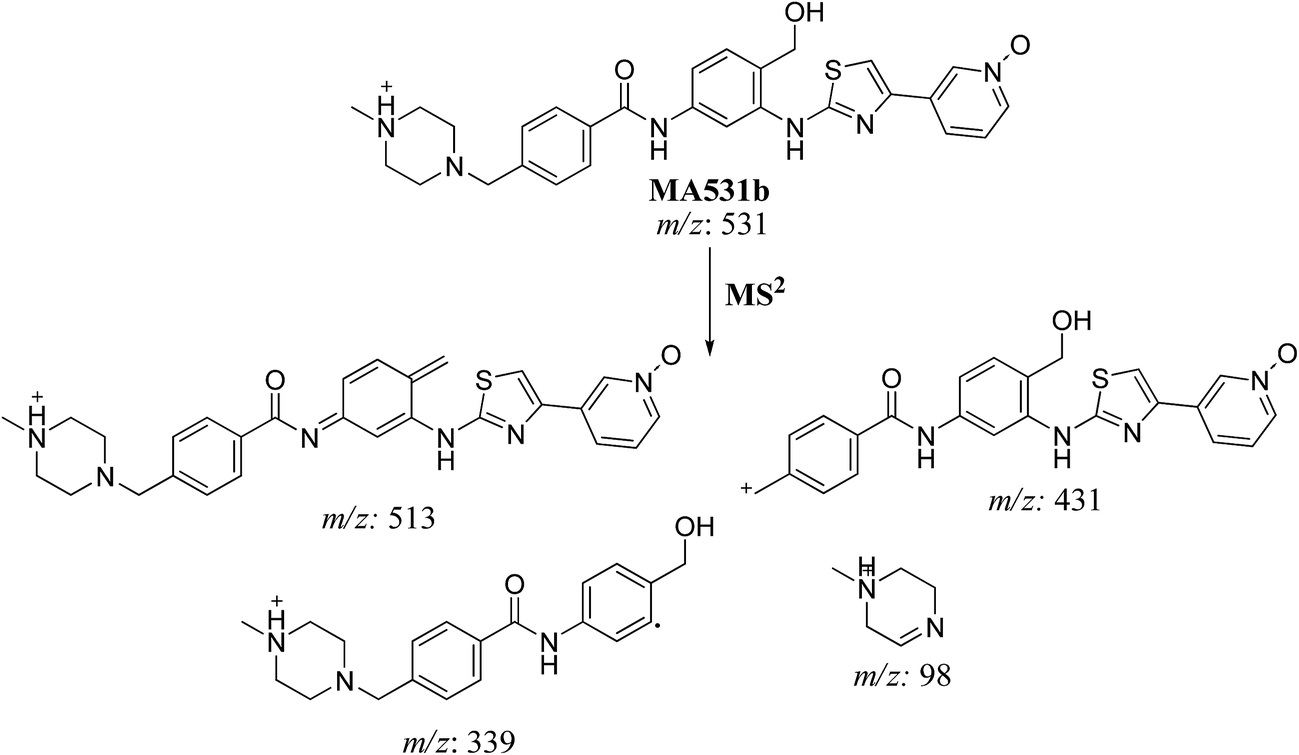
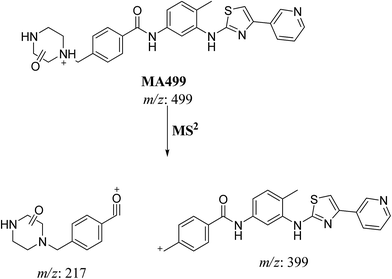
3.2.1. MA499a and MA499b phase I metabolites of masitinib. MA499a and MA499b metabolites of masitinib were detected at m/z 499 in full MS spectrum. MS2 scan for molecular ion peak at m/z 499 gave fragment ions at m/z 449, 399 and 217 for both metabolites but at two different retention times. The fragment ion at m/z 399 proposed that all metabolic changes happened in the N-methyl piperazine moiety. Metabolic reactions for MA499a and MA499b metabolites were proposed to be N-demethylation and oxidation of piperazine carbon atom in masitinib at two different positions (Scheme 2) (Fig. 4).
 |
| | Scheme 2 Fragmentation pattern of MA499a and MA499b. | |
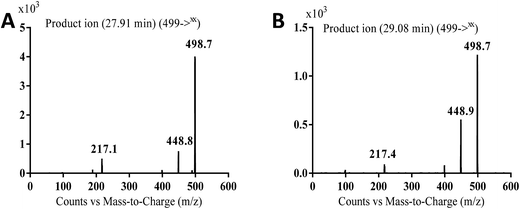 |
| | Fig. 4 MS2 mass spectra of molecular ion peaks at m/z 499: MA499a (A) and MA499b (B). | |
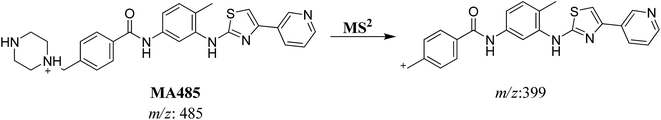
3.2.2. MA485 phase I metabolite of masitinib. MA485 metabolite of masitinib was detected at m/z 485 in full MS spectrum. MS2 scan for molecular ion peak at m/z 485 gave fragment ion at m/z 399 (Fig. 5). The fragment ion at m/z 399 proposed that all metabolic changes happened in the N-methyl piperazine moiety. Metabolic reactions for MA485 metabolite was proposed to be N-demethylation (Scheme 3).
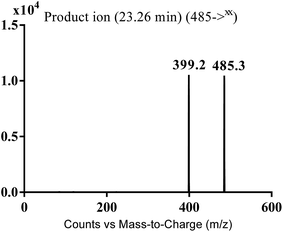 |
| | Fig. 5 MS2 mass spectra of MA485 molecular ion peak at m/z 485. | |
 |
| | Scheme 3 Fragmentation pattern of MA485. | |
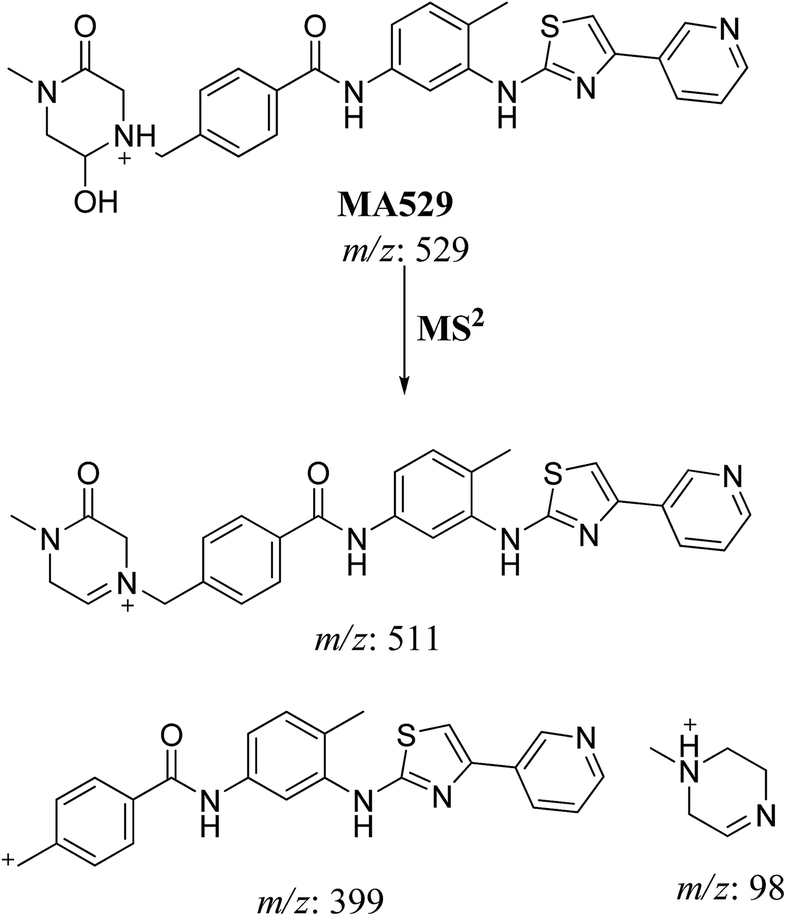
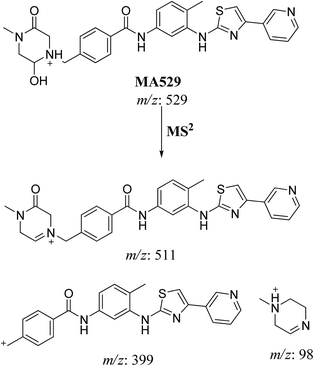
3.2.3. MA529 phase I metabolite of masitinib. MA529 metabolite of masitinib was detected at m/z 529 in full MS spectrum. MS2 scan for molecular ion peak at m/z 529 gave fragment ions at m/z 511, 399 and 98 (Fig. 6). The fragment ion at m/z 399 proposed that all metabolic changes happened in the N-methyl piperazine moiety. Metabolic reactions for MA485 metabolite was proposed to be hydroxylation and oxidation of piperazine carbon (Scheme 4).
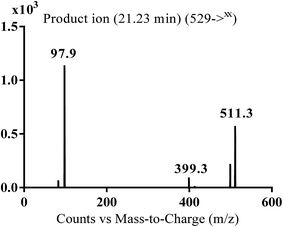 |
| | Fig. 6 MS2 mass spectrum of MA529 molecular ion peak at m/z 529. | |
 |
| | Scheme 4 Fragmentation pattern of MA529. | |
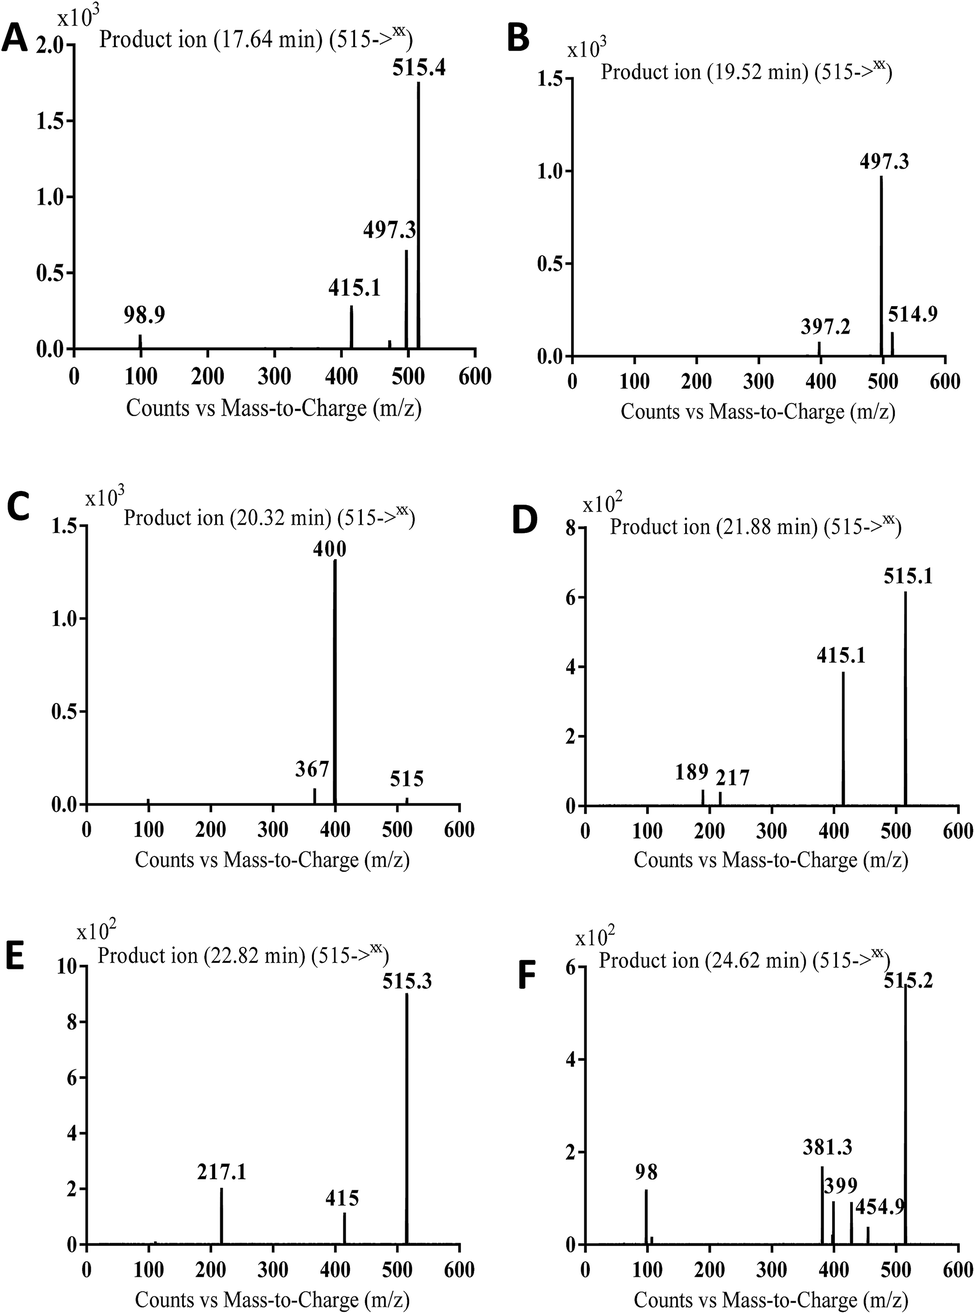
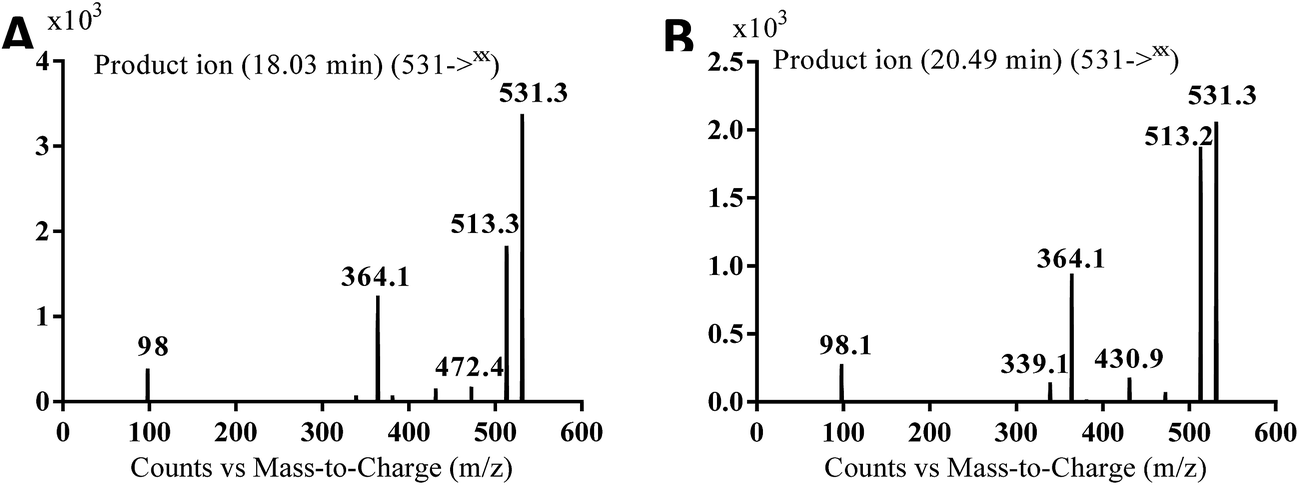
3.2.4. MA515a to f phase I metabolites of masitinib. MA515 a–f metabolites of masitinib were detected at m/z 511 in full MS spectrum. MS2 scan for molecular ion peaks at m/z 515 gave different fragment ions at different retention times (Fig. 7). Metabolic reactions for MA515a–f metabolites were proposed to be hydroxylation or N-oxide formation in masitinib.
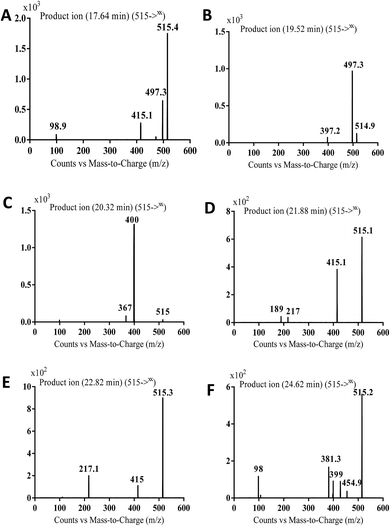 |
| | Fig. 7 MS2 mass spectra of molecular ion peaks at m/z 511: MA515a (A), MA515b (B), MA515c (C), MA515d (D), MA515e (E), and MA515f (F). | |
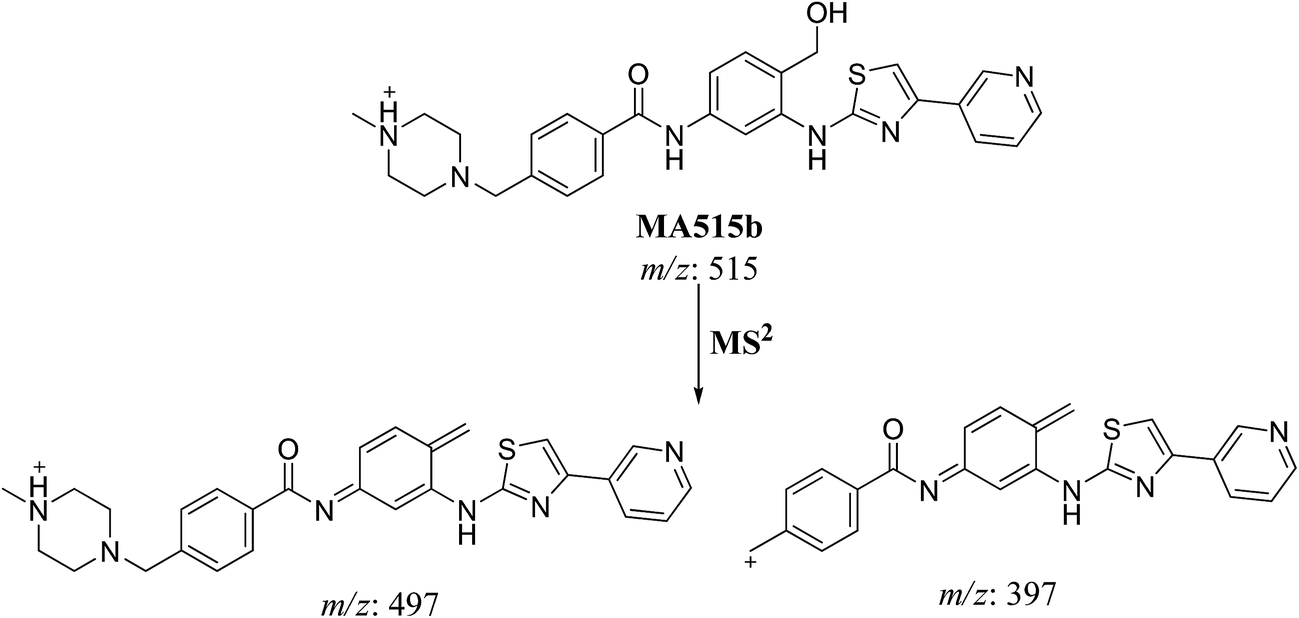
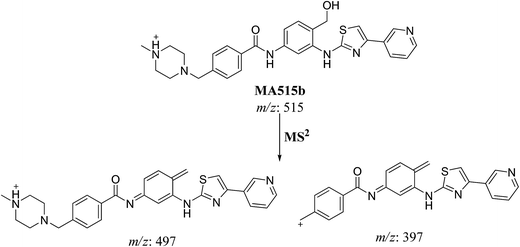
The fragment ion at m/z 415 in MS2 mass spectrum of MA511a proposed that amide nitrogen underwent oxidation. So metabolic reactions for MA511a metabolite was proposed to be N-oxidation of amide nitrogen (Scheme 5). The fragment ions at m/z 397 and 497 in MS2 mass spectrum of MA511b proposed the hydroxylation of benzylic carbon. So metabolic reactions for MA511b was proposed to be hydroxylation of benzylic carbon (Scheme 6).
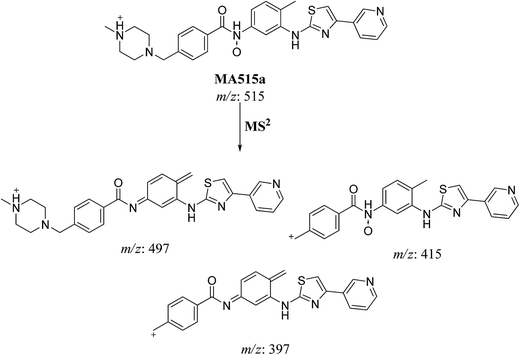 |
| | Scheme 5 Fragmentation pattern of MA515a. | |
 |
| | Scheme 6 Fragmentation pattern of MA515b. | |
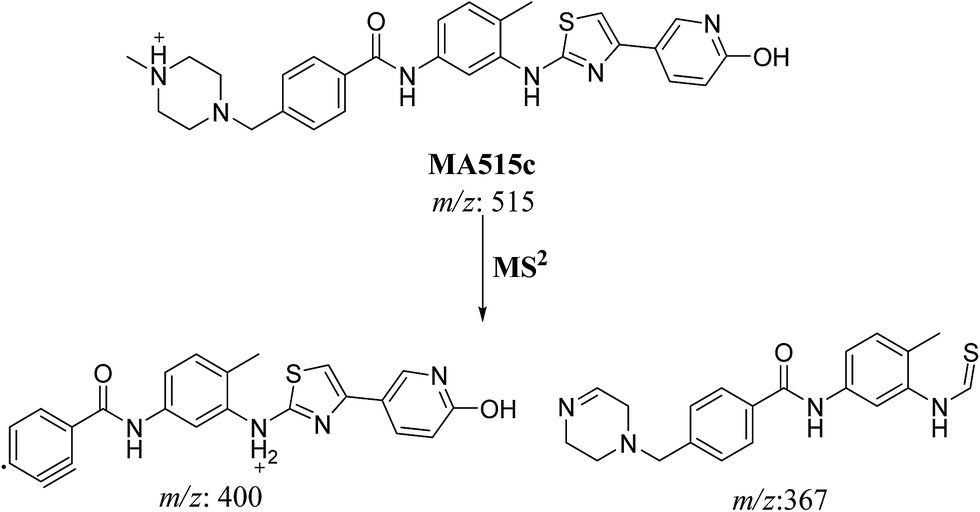
In case of MA511c, the fragment ions at m/z 400 and 367 in MS2 mass spectrum proposed the hydroxylation of pyridine group. The fragment ion at m/z 400 proposed that hydroxylation didn't happen in the N-methyl piperazine moiety. The fragment ion m/z 367 confirmed the proposal of hydroxylation of pyridine group (Scheme 7).
 |
| | Scheme 7 Fragmentation pattern of MA515c. | |
In case of MA511d and MA511e, the fragment ions at m/z 415 and 217 proposed the oxidation of pyridine nitrogen or oxidation of anilinic nitrogen (Scheme 8).
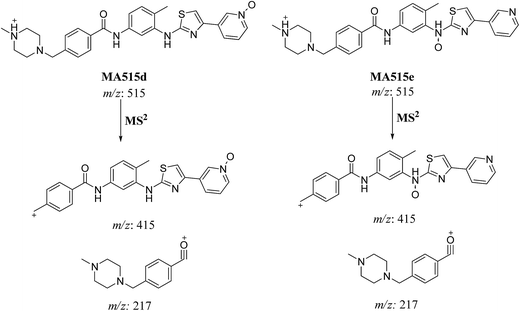 |
| | Scheme 8 Fragmentation pattern of MA515d and MA515e. | |
In case of MA511f, the fragment ions at m/z 400, 455 and 428 proposed the N-oxidation at nitrogen atom of piperazine group. The fragment ion at m/z 400 in MA511f indicated that the loss of n-oxide methyl piperazine (Scheme 9).
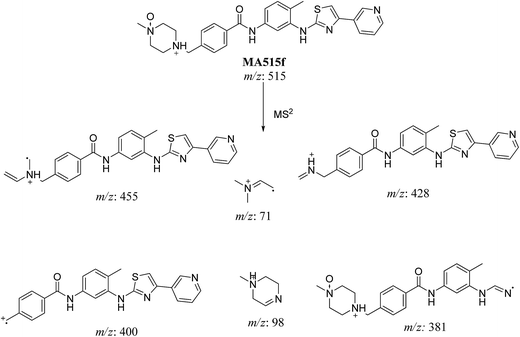 |
| | Scheme 9 Fragmentation pattern of MA515f. | |
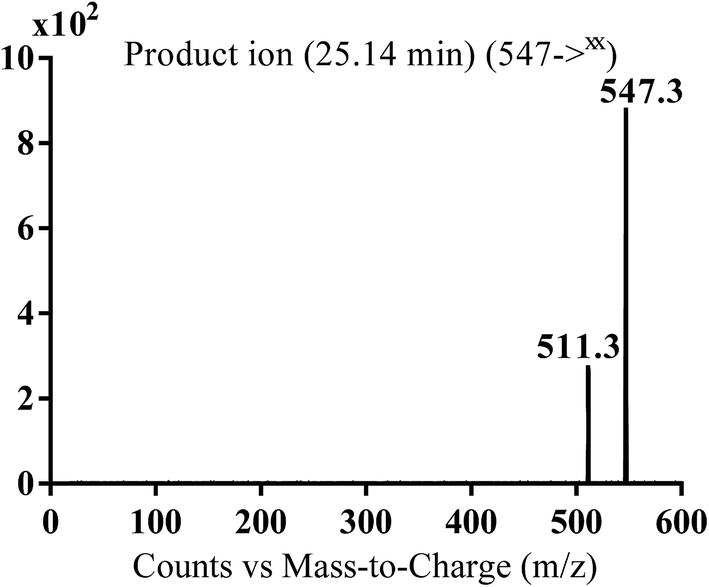
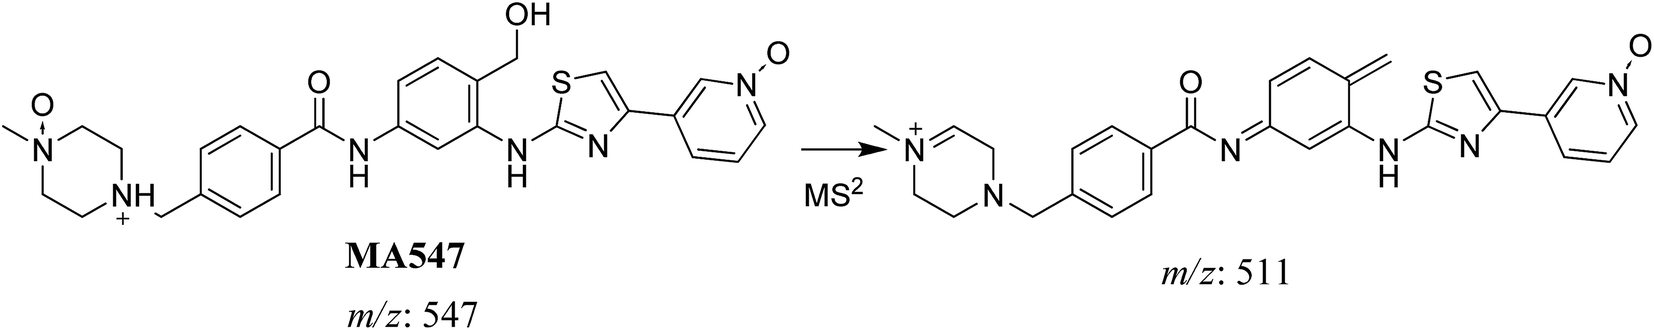
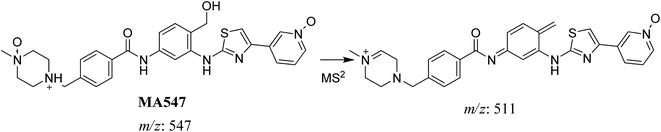
3.2.6. MA547 phase I metabolite of masitinib. MA547 metabolite of masitinib was detected at m/z 547 (M + 48) in full MS spectrum. MS2 scan for molecular ion peak at m/z 547 gave fragment ions at m/z 511 (Fig. 9). Metabolic reactions for MA547 metabolite was proposed to be hydroxylation of benzylic carbon, oxidation of pyridine nitrogen and oxidation of piperazine nitrogen (Scheme 12).
 |
| | Fig. 9 MS2 mass spectra of MA547 molecular ion peaks at m/z 547. | |
 |
| | Scheme 12 Fragmentation pattern of MA547. | |
3.3. Bioactive metabolites
No GSH adducts were detected in the case of incubation with RLMs and 1.0 mM GSH but in case of incubation with RLMs and 1.0 mM KCN, eight cyano adducts were detected as listed in Table 2.
Table 2 Masitinib cyano adducts
| |
MS scan |
MS2 product ions |
tR (min) |
Metabolic reaction |
| MB510 |
510 |
483 |
27.5 |
Cyano conjugation and N-demethylation |
| MB526 |
526 |
499, 481, 401, 92 |
28.9 |
Cyano conjugation and carbonyl reduction |
| MB538a |
538 |
511 |
30.3 |
Cyano conjugation and oxidation |
| MB538b |
538 |
511 |
31.0 |
Cyano conjugation and oxidation |
| MB538c |
538 |
511, 399 |
32.5 |
Cyano conjugation and oxidation |
| MB524a |
524 |
497 |
24.2 |
Cyano conjugation, oxidation and N-demethylation |
| MB524b |
524 |
497 |
28.1 |
Cyano conjugation, oxidation and N-demethylation |
| MB524c |
524 |
497, 399 |
30.4 |
Cyano conjugation, oxidation and N-demethylation |
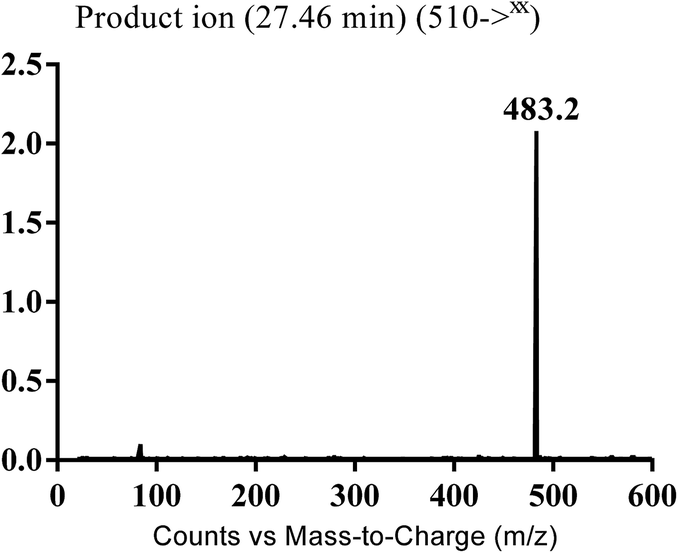
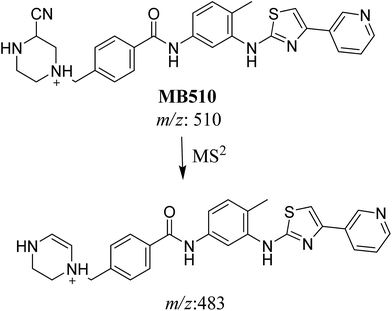
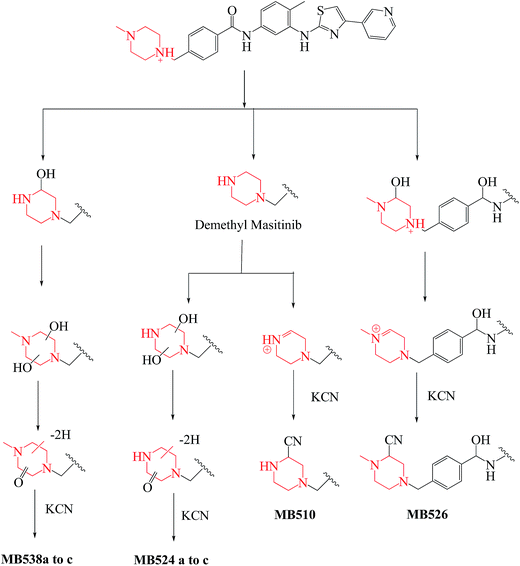
3.3.1. Identification of MB510 metabolite of masitinib. MB510 cyano adduct of masitinib was detected at m/z 510 in full MS spectrum. MS2 scan for molecular ion peak at m/z 510 gave fragment ion at m/z 483 (Fig. 12). The fragment ion at m/z 483 proposed the immediate loss of a molecule of hydrogen cyanide (Scheme 14). Metabolic reactions for MB526 cyano adduct were proposed to be N-demethylation and addition of cyano group to the piperazine ring.
 |
| | Fig. 12 MS2 mass spectra of MB510 molecular ion peaks at m/z 510. | |
 |
| | Scheme 14 Fragmentation pattern of MB510. | |
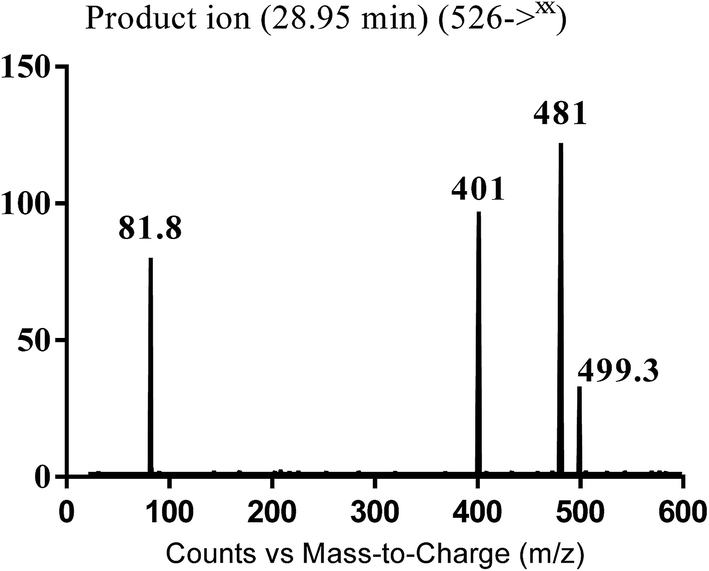
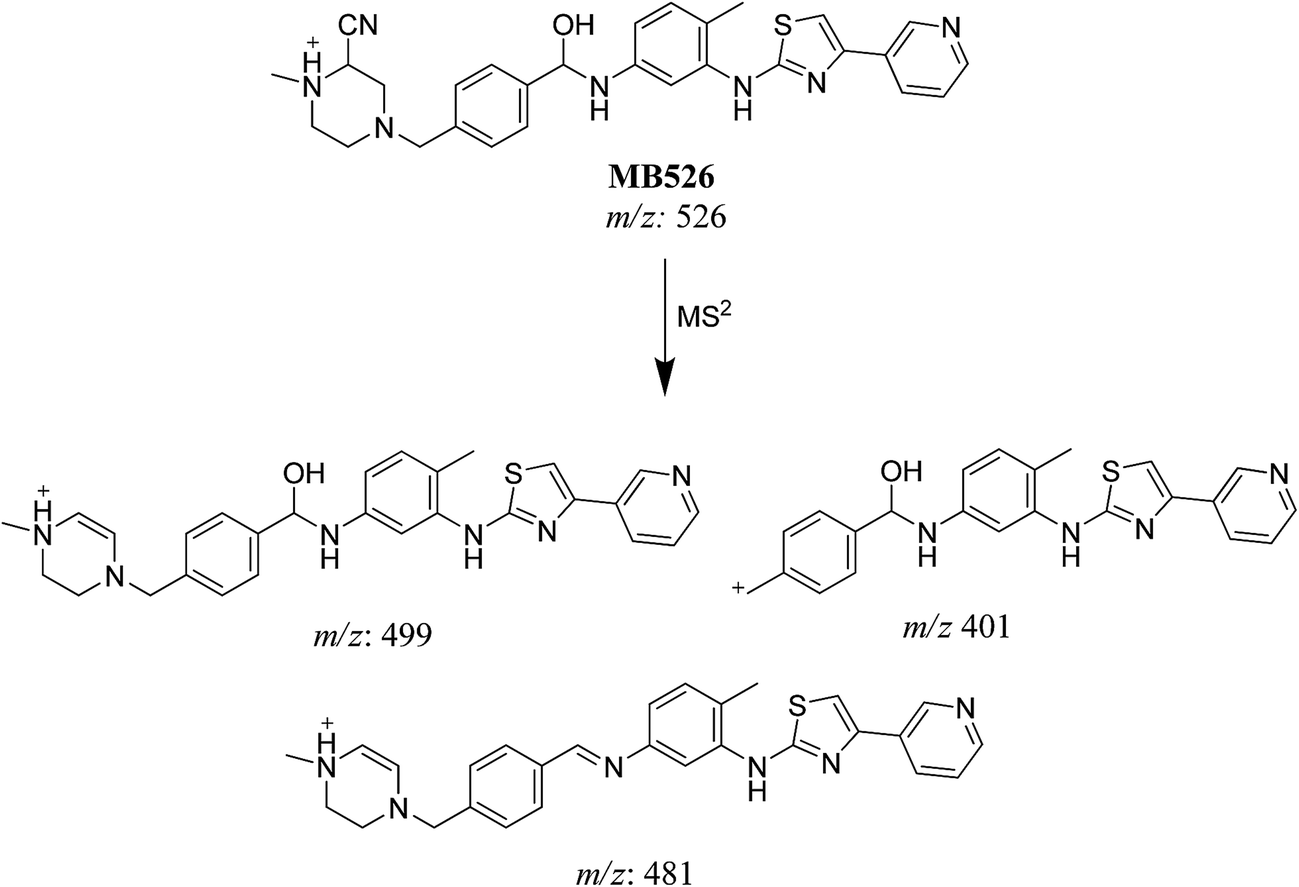
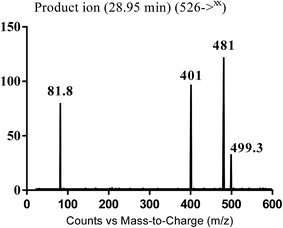
3.3.2. Identification of MB526 metabolite of masitinib. MB526 cyano adduct of masitinib was detected at m/z 526 in full MS spectrum. MS2 scan for molecular ion peak at m/z 526 gave fragment ions at m/z 499, 481 and 401 (Fig. 13). The fragment ion at m/z 499 proposed the immediate loss of a molecule of hydrogen cyanide while the fragment ion at m/z 401 proposed that the addition of the cyano group occurred in the piperazine ring, which was consistent with the fragment ion at m/z 481 (Scheme 15). Metabolic reactions for MB526 cyano adduct were proposed to be reduction of carbonyl group and addition of cyano group to the piperazine ring.
 |
| | Fig. 13 MS2 mass spectra of MB526 molecular ion peaks at m/z 526. | |
 |
| | Scheme 15 Fragmentation pattern of MB526. | |
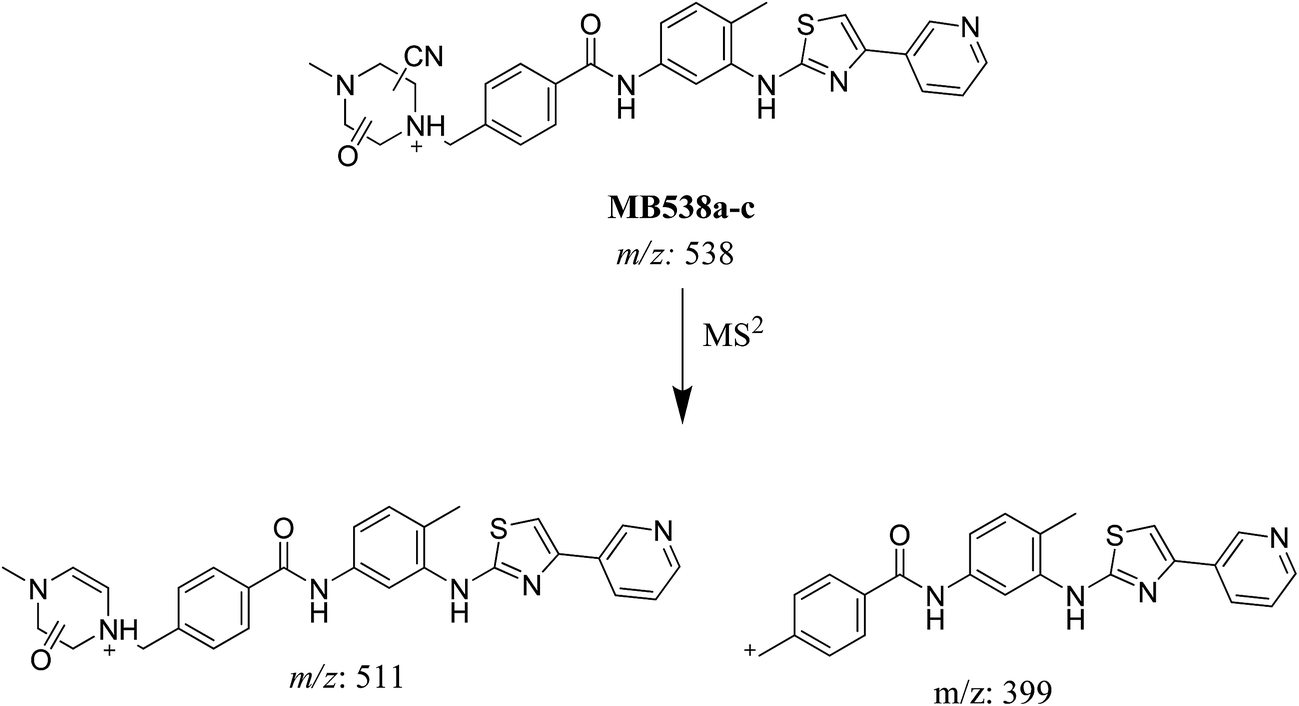
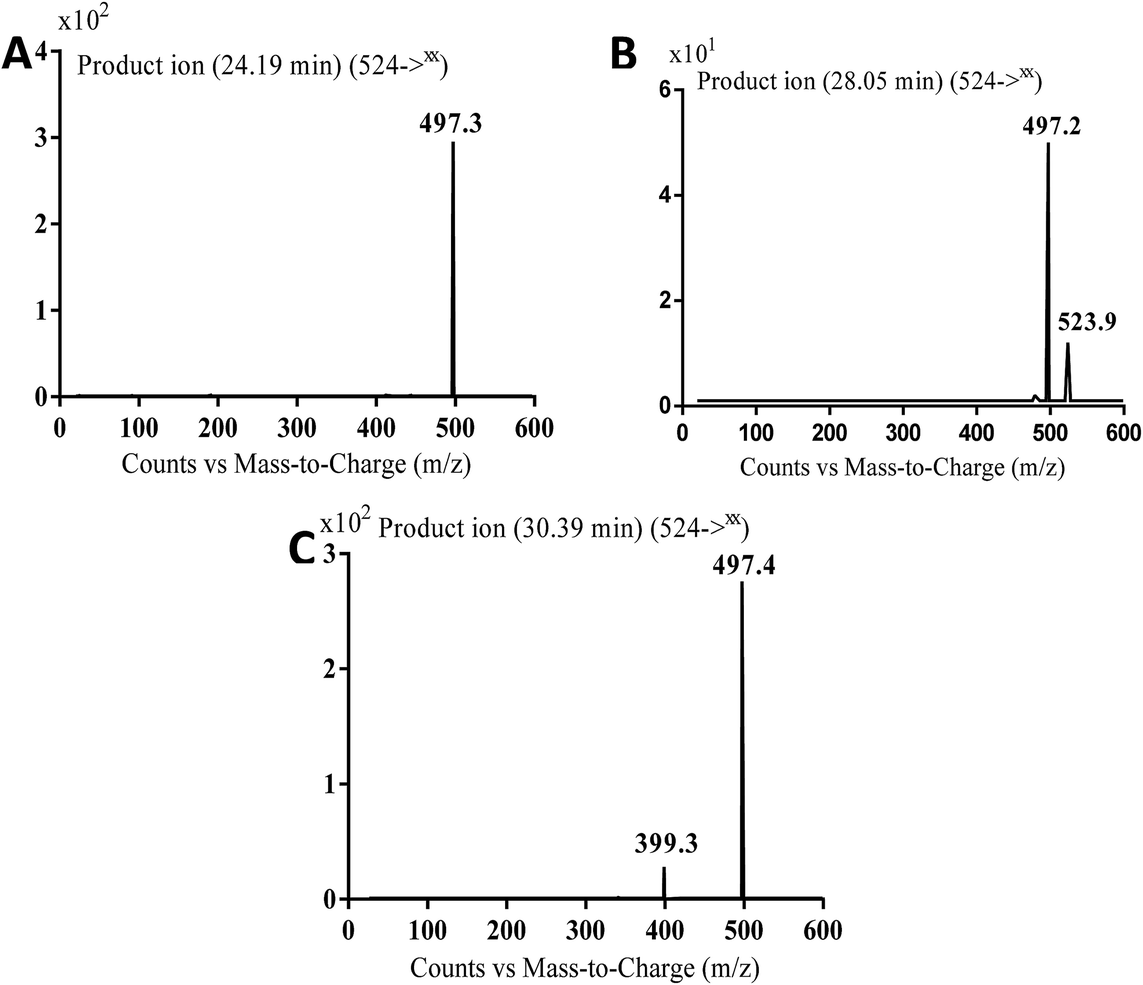
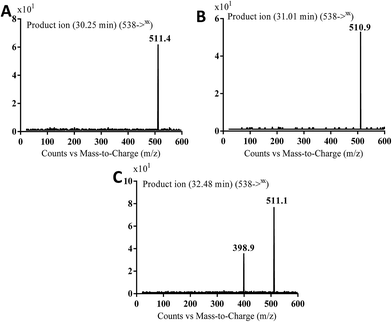
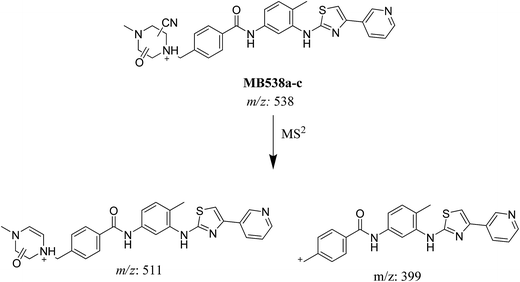
3.3.3. Identification of MB538a to c metabolite of masitinib. MB538a, MB538b and MB538c cyano adducts of masitinib were detected at m/z 538 in full MS spectrum. MS2 scan for molecular ion peaks at m/z 538 gave similar fragment ions but at different retention times. Fragmentation of molecular ion at m/z 538 (Fig. 14), the molecule underwent an immediate loss of a molecule of hydrogen cyanide and formed product ion m/z 511. Metabolic reactions for MB538a, MB538b and MB538c adducts were proposed to be oxidation of α-carbon and addition of cyano group in the activated α-carbon of piperazine group at different positions (Scheme 16).
 |
| | Fig. 14 MS2 mass spectra of molecular ion peaks at m/z 538: MB538a (A), MB538b (B) and MB538c (C). | |
 |
| | Scheme 16 Fragmentation pattern of MB538. | |
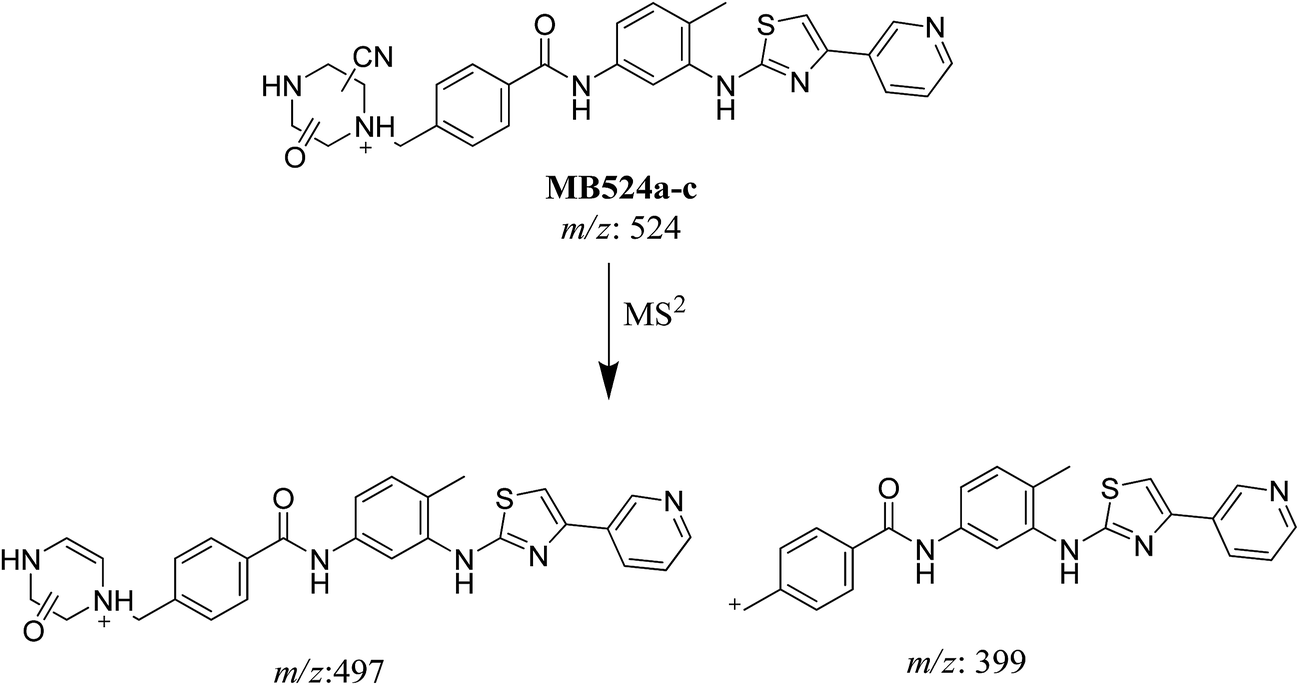
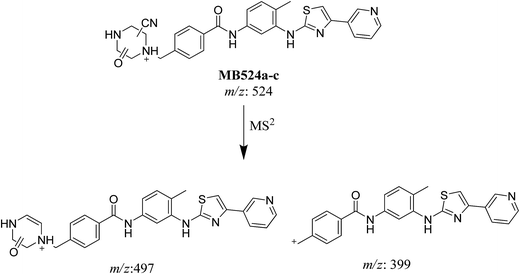
3.3.4. Identification of MB524a to c metabolite of masitinib. MB524a, MB524b, and MB524c cyano adducts of masitinib were detected at m/z 524 in full MS spectrum. MS2 scan for molecular ion peaks at m/z 524 gave similar fragment ions but at different retention times. Fragmentation of molecular ion at m/z 524 (Fig. 15), the molecule underwent an immediate loss of a molecule of hydrogen cyanide and formed product ion m/z 497. Metabolic reactions for MB524a, MB524b and MB524c adducts were proposed to be demethylation of methylpiperazine group then oxidation of piperazine α-carbon and addition of cyano group in the activated α-carbon of piperazine group at different (Scheme 17).
 |
| | Fig. 15 MS2 mass spectra of molecular ion peaks at m/z 524: MB524a (A), MB524b (B) and MB524c (C). | |
 |
| | Scheme 17 Fragmentation pattern of MB524a to c. | |
3.4. Bioactivation mechanism of masitinib
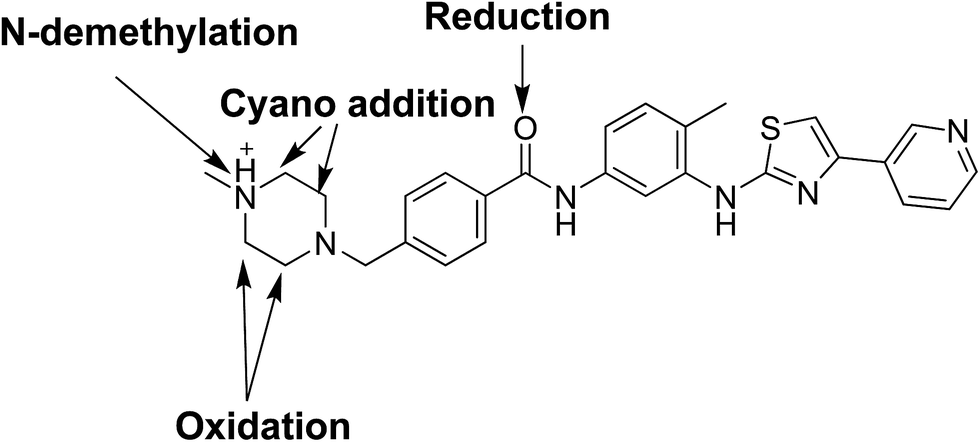
Bioactivation pathways of masitinib were proposed as shown in Scheme 18. P450-catalyzed oxidation of piperazine ring in masitinib then dehydration resulted in formation of imine and imine-carbonyl intermediates. These reactive intermediates are not stable but can be trapped by cyanide forming stable adduct that can be detected in the mass spectrometer.17 Place of cyano addition is proposed as shown in Fig. 16. The eight cyanide adducts are proposed as shown in Scheme 18 explaining the proposed mechanism of bioactivation of masitinib.
 |
| | Scheme 18 Proposed bioactivation mechanisms of masitinib. | |
 |
| | Fig. 16 Chemical structure of masitinib and identified cyano conjugates. | |
4. Conclusions
Fourteen metabolites were formed by incubation of masitinib with RLMs through five metabolic reactions: N-demethylation, N-oxidation, oxidation, reduction and hydroxylation. No GSH adduct was detected when incubated with RLMs with 1.0 mM GSH. Eight cyano adducts were detected when incubated with RLMs with 1.0 mM. All metabolic bioactivation reactions happened in the N-methyl piperazine moiety which may be the reason for instability and toxicity of masitinib.
Conflict of interest
The authors declare no conflict of interest.
Acknowledgements
The authors would like to extend their sincere appreciation to the Deanship of Scientific Research at the King Saud University for funding this work through the Research Group Project No. RGP-322.
References
- A. Jemal, R. Siegel, E. Ward, Y. Hao, J. Xu, T. Murray and M. J. Thun, Ca-Cancer J. Clin., 2008, 58, 71–96 CrossRef PubMed.
- R. Sinha and K. El-Bayoumy, Curr. Cancer Drug Targets, 2004, 4, 13–28 CrossRef CAS PubMed.
- P. Cozzi, N. Mongelli and A. Suarato, Curr. Med. Chem.: Anti-Cancer Agents, 2004, 4, 93–121 CrossRef CAS PubMed.
- M. Barinaga, Science, 1997, 278, 1036–1039 CrossRef CAS PubMed.
- J. Schlessinger, Cell, 2000, 103, 211–225 CrossRef CAS PubMed.
- C. Özvegy-Laczka, J. Cserepes, N. B. Elkind and B. Sarkadi, Drug Resist. Updates, 2005, 8, 15–26 CrossRef PubMed.
- N. Steeghs, J. W. Nortier and H. Gelderblom, Ann. Surg. Oncol., 2007, 14, 942–953 CrossRef PubMed.
- C. Natoli, B. Perrucci, F. Perrotti, L. Falchi and S. Iacobelli, Curr. Cancer Drug Targets, 2010, 10, 462–483 CrossRef CAS PubMed.
- K. Hahn, G. Oglivie, T. Rusk, P. Devauchelle, A. Leblanc, A. Legendre, B. Powers, P. Leventhal, J. P. Kinet and F. Palmerini, J. Vet. Intern. Med., 2008, 22, 1301–1309 CrossRef CAS PubMed.
- M. Daly, S. Sheppard, N. Cohen, M. Nabity, A. Moussy, O. Hermine and H. Wilson, J. Vet. Intern. Med., 2011, 25, 297–302 CrossRef CAS PubMed.
- I. Marech, R. Patruno, N. Zizzo, C. Gadaleta, M. Introna, A. F. Zito, C. D. Gadaleta and G. Ranieri, Critical Reviews in Oncology/Hematology, 2014, 91, 98–111 CrossRef PubMed.
- P. Dubreuil, S. Letard, M. Ciufolini, L. Gros, M. Humbert, N. Castéran, L. Borge, B. Hajem, A. Lermet and W. Sippl, PLoS One, 2009, 4, e7258 Search PubMed.
- T. A. Baillie, Chem. Res. Toxicol., 2006, 19, 889–893 CrossRef CAS PubMed.
- A. S. Kalgutkar, I. Gardner, R. S. Obach, C. L. Shaffer, E. Callegari, K. R. Henne, A. E. Mutlib, D. K. Dalvie, J. S. Lee and Y. Nakai, Curr. Drug Metab., 2005, 6, 161–225 CrossRef CAS PubMed.
- A. F. Stepan, D. P. Walker, J. Bauman, D. A. Price, T. A. Baillie, A. S. Kalgutkar and M. D. Aleo, Chem. Res. Toxicol., 2011, 24, 1345–1410 CrossRef CAS PubMed.
- R. von Jagow, H. Kampffmeyer and M. Kinese, Naunyn Schmiedebergs Arch. Exp. Pathol. Pharmakol., 1965, 251, 73–87 CrossRef CAS PubMed.
- D. Argoti, L. Liang, A. Conteh, L. Chen, D. Bershas, C.-P. Yu, P. Vouros and E. Yang, Chem. Res. Toxicol., 2005, 18, 1537–1544 CrossRef CAS PubMed.
Footnote |
| † Electronic supplementary information (ESI) available. See DOI: 10.1039/c6ra25767d |
|
| This journal is © The Royal Society of Chemistry 2017 |
Click here to see how this site uses Cookies. View our privacy policy here. 
 Open Access Article
 This Open Access Article is licensed under a
  *ab
*ab