 Open Access Article
Inhibition effect of aromatic aldehydes on butanol fermentation by Clostridium acetobutylicum
Jing Lia,
Suan Shi b,
Sushil Adhikaria and
Maobing Tu*c
aDepartment of Biosystems Engineering, Auburn University, AL 36849, USA
bHawaii Natural Energy Institute, University of Hawaii, Honolulu, HI 96822, USA
cDepartment of Biomedical, Chemical and Environmental Engineering, University of Cincinnati, Cincinnati, OH 45221, USA. E-mail: tumg@ucmail.uc.edu; Tel: +1 513 556 2259
First published on 4th January 2017
Abstract
A large number of degradation compounds are formed during biomass pretreatment and they significantly inhibit the efficiency of biomass conversion to biofuels. Of those identified potential inhibitors, aromatic aldehydes play an important role in inhibition activity. Hence the effect of 13 aromatic aldehydes on acetone–butanol–ethanol (ABE) fermentation was assessed at four concentrations in the present work. It was found that the inhibition severity was affected by the ortho substituents (OH > OCH3 > CHO) and strongly related to the position of hydroxyl group instead of the number of hydroxyl groups. The ortho-hydroxyl group significantly contributed to the aromatic aldehyde inhibition. The ortho-substituted 2-hydroxybenzaldehyde caused at least 20-fold stronger inhibition than meta- and para-substituted analogues of 3- and 4-hydroxybenzaldehydes. The presence of ortho-hydroxyl group can form an intramolecular hydrogen bond with carbonyl hydrogen and potentially increase the cell membrane permeability and electrophilicity. Quantitative structure–activity relationship (QSAR) analysis was used to establish a correlation between inhibition activity (IC50) and physicochemical descriptors. A strong correlation was observed between IC50 and the energy of the highest occupied molecular orbital EHOMO.
Introduction
Lignocellulosic biomass as the most abundant sustainable resource on earth has great potential to produce biofuels. But the degradation compounds derived from sugars and lignin during pretreatment are detrimental to subsequent enzymatic hydrolysis and microbial fermentation and severely limit the efficient utilization of lignocellulose.1,2 The species and amount of degradation compounds are feedstock and pretreatment dependent.1,3,4 Thirty two degradation products including organic acids and phenolic compounds were found in dilute sulfuric acid hydrolyzed corn stover aqueous phase.5 Luo et al.6 reported more than 35 degradation products in the prehydrolysates from dilute nitric acid treated hybrid poplar and most of them were aromatic aldehydes and acids, aliphatic aldehydes and acids and furan compounds. Du et al.4 applied eight pretreatment methods on three feedstocks (corn stover, poplar and pine) and quantified 40 potentially inhibitory degradation compounds resulting from these processes. Aromatic monomers (including vanillin, syringaldehyde, cinnamaldehyde, p-hydroxybenzoic acid etc.) were quantitatively identified in steam-exploded poplar.7 It was also suggested most of these compounds were inhibitory to ethanol fermentation by S. cerevisiae and their inhibition severity greatly depended on functional groups (CH![[double bond, length as m-dash]](https://www.rsc.org/images/entities/char_e001.gif) CH, CHO, OH and OCH3) attached to the benzene ring. Several model compounds were selected to be added into pure sugar fermentation, which aims to determine their potential inhibition on microbial fermentation. Ezeji et al.8 reported 3 g L−1 furfural or HMF was not inhibitory to C. beijerinckii BA101, instead they had a stimulation effect on cell growth and an improvement on ABE production was observed when furfural and HMF was up to 2 g L−1. They found ferulic acid and p-coumaric acid higher than 1 g L−1 exhibited complete inhibition on cell growth and ABE production. Cho et al.9 investigated 6 phenolic compounds (p-coumaric acid, ferulic acid, 4-hydroxybenzoic acid, vanillic acid, syringaldehyde, and vanillin) on butanol fermentation by Clostridium beijerinckii. They found little or no butanol was produced in the presence of 1 g L−1 of each compound. Cao et al.10 found the growth of T. thermosaccharolyticum W16 and hydrogen production were stimulated by 5 g L−1 sodium acetate and negatively affected by further increasing concentration. On the contrary, the fermentation was completely inhibited by adding 1.8 g L−1 syringaldehyde. Of these studies, the phenolic compounds had a significant inhibition on microbial growth and fermentation. Phenolic aldehydes and ketones mainly generated from lignin were considered more inhibitory than sugar-derived inhibitors.11 Although significant efforts have been made to demonstrate the effect of potential inhibitors on model fermentation, the comprehensive understanding of influence of chemical structure on microbial fermentation is lacking, particularly on ABE production. Our previous work found the aromatic aldehydes resulted in the most inhibitory impact on lactic acid fermentation.12 That is one of the reasons why we selected aromatic aldehydes to further assess their influence on butanol fermentation.
CH, CHO, OH and OCH3) attached to the benzene ring. Several model compounds were selected to be added into pure sugar fermentation, which aims to determine their potential inhibition on microbial fermentation. Ezeji et al.8 reported 3 g L−1 furfural or HMF was not inhibitory to C. beijerinckii BA101, instead they had a stimulation effect on cell growth and an improvement on ABE production was observed when furfural and HMF was up to 2 g L−1. They found ferulic acid and p-coumaric acid higher than 1 g L−1 exhibited complete inhibition on cell growth and ABE production. Cho et al.9 investigated 6 phenolic compounds (p-coumaric acid, ferulic acid, 4-hydroxybenzoic acid, vanillic acid, syringaldehyde, and vanillin) on butanol fermentation by Clostridium beijerinckii. They found little or no butanol was produced in the presence of 1 g L−1 of each compound. Cao et al.10 found the growth of T. thermosaccharolyticum W16 and hydrogen production were stimulated by 5 g L−1 sodium acetate and negatively affected by further increasing concentration. On the contrary, the fermentation was completely inhibited by adding 1.8 g L−1 syringaldehyde. Of these studies, the phenolic compounds had a significant inhibition on microbial growth and fermentation. Phenolic aldehydes and ketones mainly generated from lignin were considered more inhibitory than sugar-derived inhibitors.11 Although significant efforts have been made to demonstrate the effect of potential inhibitors on model fermentation, the comprehensive understanding of influence of chemical structure on microbial fermentation is lacking, particularly on ABE production. Our previous work found the aromatic aldehydes resulted in the most inhibitory impact on lactic acid fermentation.12 That is one of the reasons why we selected aromatic aldehydes to further assess their influence on butanol fermentation.
Considerable progress has been made to evaluate the impact of potential inhibitors but little is known about the mechanism of inhibition. Effective evidence is lacking although the hydrophobicity has been reported to correlate with phenol toxicity. The phenols were most likely responsible for increasing the fluidity of membrane and consequently affected the membrane permeability.11,13,14 The complexity of prehydrolysates made the study of mechanism much difficult. Quantitative structure–activity relationships (QSAR) analysis is helpful to address this issue. Although it has been successfully used in pharmacology and environmental toxicity assessment,15–18 little attention was paid in the field of biofuels production from biomass. The biological toxicity can be understood by association chemical structural properties with their inhibition activities, through which we can also predict their inhibition towards microbial fermentation. The molecular descriptors typically used for QSAR include octanol/water partition coefficient (log![[thin space (1/6-em)]](https://www.rsc.org/images/entities/char_2009.gif) P), energy of the lowest unoccupied molecular orbital (ELUMO), energy of the highest occupied molecular orbital (EHOMO), molar refractivity (MR), dipole moment (u), and electrophilicity index (ω).19,20
P), energy of the lowest unoccupied molecular orbital (ELUMO), energy of the highest occupied molecular orbital (EHOMO), molar refractivity (MR), dipole moment (u), and electrophilicity index (ω).19,20
In the present study we selected 13 aromatic aldehydes and added them individually into butanol fermentation by C. acetobutylicum. The objectives of this work were (1) to understand the effects of aromatic aldehydes structure (substitution group, hydroxyl group position and amount of hydroxyl group) on ABE fermentation; and (2) to establish relationship between physicochemical properties and inhibition towards butanol fermentation.
Experimental
Chemicals
Glucose (anhydrous), 2,4-dihydroxybenzaldehyde and thiamine were purchased from Alfa Aesar (Ward Hill, MA). 4-Hydroxybenzaldehyde, vanillin and 2,3,4-trihydroxybenzaldehyde were purchased from Acros Organics (Morris Plains, NJ). o-Phthalaldehyde was purchased from Pickering Laboratories (Mountain View, CA). 2,3-Dihydroxybenzaldehyde, 3,4,5-trihydroxybenzaldehyde, o-vanillin and 2-methoxybenzaldehyde were obtained from TCI America (Portland, OR). 2-Hydroxybenzaldehyde, 3-hydroxybenzaldehyde, NH4Ac and p-aminobenzoic acid were purchased from Alfa Aesar (Heysham, England). NaCl was purchased from VWR (Radnor, PA). 3,5-Dihydroxybenzaldehyde, benzaldehyde and biotin were purchased from Sigma-Aldrich (St. Louis, MO). Reinforced Clostridial Medium (RCM) was purchased from HIMEDIA laboratories (Mumbai, India). K2HPO4, KH2PO4, MgSO4·7H2O, MnSO4·H2O and FeSO4·7H2O were obtained from Fisher Scientific (Fair Lawn, NJ). CaCO3 was supplied from EMD chemicals (Gibbstown, NJ). All chemical reagents were of chromatographic grades. DI-water was produced by the Barnstead Nanopure UV Ultrapure Water System (Thermo Fisher Scientific, Marietta, OH).Microorganism and culture
Clostridium acetobutylicum (ATCC 824) was kindly provided by Dr Y. Y. Lee of Chemical Engineering, Auburn University. It was stored as spores at 4 °C and treated by heat shock at 75 °C for 10 min and then cooled down in ice bath prior to cultivation. Reinforced Clostridial Medium (RCM) was used to cultivate the strain. It was bubbled through nitrogen for 15 min to remove the oxygen and then autoclaved at 121 °C for 15 min. The heat-shocked cells were grown in RCM medium as seed inoculum until the optical density (OD) reached 1.30 determined by an UV-vis spectrometer at 600 nm.Fermentation and inhibition study
Fermentation was carried out in 125 mL serum bottle with working volume of 50 mL at 35 °C and 80 rpm. To evaluate the effect of aromatic aldehydes, each inhibitor at four concentrations was added into P2 medium sterilized by filtration through a 0.2 μm membrane filter. 0.25 M stock of 2,3-dihydroxybenzaldehyde, 2,4-dihydroxybenzaldehyde, 2,3,4-trihydroxybenzaldehyde and o-vanillin were prepared and the other inhibitors tested were used as received. The P2 medium stock was prepared at high concentration. It contained mineral (MgSO4·7H2O 40 g L−1, MnSO4·H2O 2 g L−1, FeSO4·7H2O 2 g L−1 and NaCl 2 g L−1), buffer (KH2PO4 50 g L−1, K2HPO4 50 g L−1 and NH4Ac 220 g L−1) and vitamin (p-aminobenzoic acid 1 g L−1, thiamine 1 g L−1 and biotin 0.01 g L−1). 0.25 mL mineral, 0.5 mL buffer and 0.05 mL vitamin solution were added into 45 mL water along with glucose at final concentration of 60 g L−1. 0.25 g CaCO3 was supplemented to well control the pH during fermentation. The oxygen in medium was then purged out by a nitrogen purging system. The purging circle was repeated 7 times with each circle lasting 5 minutes. A 10% (v/v) seed inoculum was transferred into P2 medium throughout the inhibition studies. Glucose control without adding any inhibitor was performed with every batch as reference fermentation. All the fermentation experiments were conducted in duplicates.50% butanol production inhibition concentration (IC50) was calculated to quantify the inhibition effect of the thirteen compounds. Butanol production was found to be linearly related to the concentrations of tested aromatic aldehydes. IC50 represents the concentration of aromatic aldehydes resulting in final butanol concentration 50% of control and the four concentrations of test compounds were selected to cover this point. The lower the value of IC50, the higher is the inhibition of aromatic aldehydes.
Calculation of physicochemical descriptors and statistical analysis
Hydrophobicity (log![[thin space (1/6-em)]](https://www.rsc.org/images/entities/char_2009.gif) P) and molecular refractivity were calculated by MarvinSketch. ELUMO, EHOMO, dipole moment (u) and partial charge of the carbonyl carbon in aromatic aldehyde (C′carb) were estimated by Gauss 9.0 and GaussView 5.0. The molecular electrophilicity index (ω) was calculated as described previously.12 Correlations between physiochemical parameters and inhibition activity were carried out by regression analysis using Origin 8.5. The statistical values include: n the number of observations, s the standard error of the estimate, r2 the coefficient of determination, F Fisher statistic, and p the significance. A value of p < 0.05 indicated that the correlation was significant.
P) and molecular refractivity were calculated by MarvinSketch. ELUMO, EHOMO, dipole moment (u) and partial charge of the carbonyl carbon in aromatic aldehyde (C′carb) were estimated by Gauss 9.0 and GaussView 5.0. The molecular electrophilicity index (ω) was calculated as described previously.12 Correlations between physiochemical parameters and inhibition activity were carried out by regression analysis using Origin 8.5. The statistical values include: n the number of observations, s the standard error of the estimate, r2 the coefficient of determination, F Fisher statistic, and p the significance. A value of p < 0.05 indicated that the correlation was significant.
HPLC analysis
Glucose, acetic acid, butyric acid, ethanol, acetone and butanol were quantified by a HPLC system (Shimadzu LC-20A) equipped with an autosampler, LC-20 AD pump, and RID-10A detector, with a 300 × 7.8 mm i.d., 9 μm, Aminex HPX-87H column, and a 30 × 4.6 mm i.d. guard column of the same material (Bio-Rad, Hercules, CA). The mobile phase was composed of 5 mM of sulfuric acid running isocratic at 0.6 mL min−1. The column temperature was maintained at 45 °C throughout the run.Results and discussions
Inhibition effects of aromatic aldehydes on butanol production
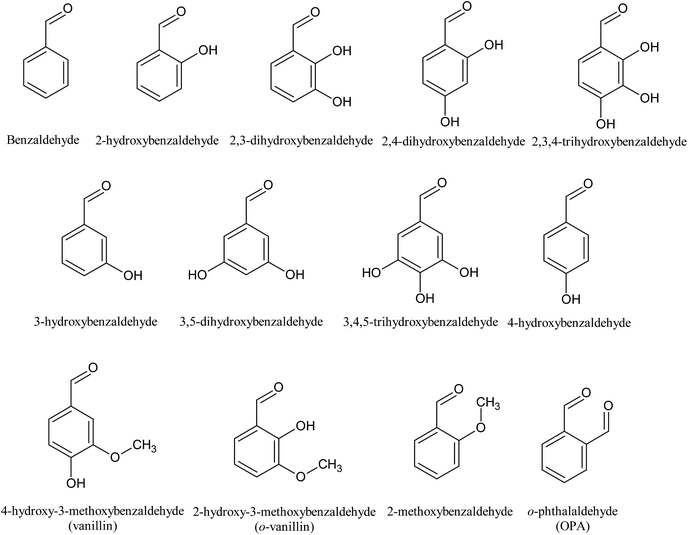
To examine the inhibition effect of aromatic aldehydes on butanol fermentation, thirteen aromatic aldehydes with different substitution group (OH, CHO and OCH3) were added into fermentation by C. acetobutylicum. The structures are shown in Fig. 1. Overall, the inhibition activities of these compounds were dose dependent but the range at which the compounds showed their inhibition were quite different. Some aldehydes exhibited their inhibition at extremely low concentrations, while others did not show any inhibition at high concentrations (Table 1). Moreover, these aldehydes delayed the fermentation start time but not affecting the final butanol concentration at lower concentration and inhibited the butanol production only when the concentration is further increased.| Compounds | Concentration (mM) | Cbutanola (g L−1) | CABEb (g L−1) | Ybutanolc (g g−1) | YABEd (g g−1) | Qbutanole (g L−1 h−1) | Tsf (h) |
|---|---|---|---|---|---|---|---|
| a Cbutanol butanol concentration at 96 h.b CABE ABE concentration at 96 h.c Ybutanol butanol yield at 96 h (g butanol per g original glucose).d YABE ABE yield at 96 h (g butanol per g original glucose).e Qbutanol volumetric butanol productivity at exponential phase.f Ts fermentation start time.g The data were presented as mean value ± standard deviation. | |||||||
| Control | 0.00 | 9.80 ± 0.36 | 13.74 ± 0.45 | 0.17 ± 0.01 | 0.24 ± 0.01 | 0.25 ± 0.02 | 0 |
| Benzaldehyde | 5.0 | 10.59 ± 0.34 | 15.15 ± 0.55 | 0.18 ± 0.00 | 0.25 ± 0.00 | 0.23 ± 0.01 | 12 |
| 7.5 | 9.85 ± 0.50 | 14.21 ± 0.52 | 0.18 ± 0.01 | 0.25 ± 0.01 | 0.21 ± 0.01 | 24 | |
| 10.0 | 7.52 ± 0.74 | 10.86 ± 0.78 | 0.13 ± 0.01 | 0.18 ± 0.01 | 0.16 ± 0.02 | 36 | |
| 12.5 | 0.79 ± 0.17 | 0.91 ± 0.31 | 0.01 ± 0.00 | 0.02 ± 0.01 | 0.07 ± 0.01 | 72 | |
| 2-Hydroxybenzaldehyde | 0.1 | 9.61 ± 0.06 | 13.12 ± 0.13 | 0.17 ± 0.00 | 0.24 ± 0.01 | 0.25 ± 0.01 | 12 |
| 0.25 | 9.90 ± 0.14 | 13.55 ± 0.15 | 0.18 ± 0.01 | 0.25 ± 0.01 | 0.25 ± 0.00 | 12 | |
| 0.35 | 5.98 ± 0.60 | 8.19 ± 0.61 | 0.11 ± 0.01 | 0.15 ± 0.02 | 0.10 ± 0.00 | 36 | |
| 0.5 | 2.76 ± 0.60 | 3.85 ± 0.91 | 0.05 ± 0.01 | 0.07 ± 0.02 | 0.08 ± 0.00 | 48 | |
| 2,3-Dihydroxybenzaldehyde | 0.1 | 9.54 ± 0.02 | 13.60 ± 0.12 | 0.17 ± 0.00 | 0.24 ± 0.01 | 0.19 ± 0.01 | 12 |
| 0.25 | 8.25 ± 0.56 | 11.65 ± 0.79 | 0.15 ± 0.02 | 0.21 ± 0.02 | 0.13 ± 0.00 | 24 | |
| 0.35 | 1.17 ± 0.08 | 1.48 ± 0.01 | 0.02 ± 0.00 | 0.03 ± 0.00 | 0.05 ± 0.00 | 60 | |
| 0.5 | 0.00 ± 0.00 | 0.00 ± 0.00 | 0.00 ± 0.00 | 0.00 ± 0.00 | 0.00 ± 0.00 | >96 | |
| 2,4-Dihydroxybenzaldehyde | 1.0 | 9.74 ± 0.15 | 13.78 ± 0.20 | 0.16 ± 0.00 | 0.23 ± 0.00 | 0.15 ± 0.00 | 0 |
| 1.25 | 8.94 ± 0.03 | 12.86 ± 0.18 | 0.15 ± 0.01 | 0.21 ± 0.00 | 0.10 ± 0.00 | 0 | |
| 1.5 | 2.50 ± 0.08 | 2.86 ± 0.19 | 0.04 ± 0.00 | 0.05 ± 0.01 | 0.11 ± 0.01 | 12 | |
| 2.0 | 1.18 ± 0.05 | 1.30 ± 0.04 | 0.02 ± 0.00 | 0.02 ± 0.00 | 0.03 ± 0.00 | 48 | |
| 2,3,4-Trihydroxybenzaldehyde | 0.25 | 9.86 ± 0.07 | 13.74 ± 0.07 | 0.17 ± 0.00 | 0.23 ± 0.00 | 0.19 ± 0.01 | 12 |
| 0.5 | 8.83 ± 0.03 | 12.03 ± 0.05 | 0.15 ± 0.00 | 0.20 ± 0.00 | 0.12 ± 0.00 | 12 | |
| 1.0 | 4.41 ± 0.18 | 6.13 ± 0.15 | 0.08 ± 0.00 | 0.10 ± 0.00 | 0.07 ± 0.00 | 36 | |
| 1.5 | 0.00 ± 0.00 | 0.00 ± 0.00 | 0.00 ± 0.00 | 0.00 ± 0.00 | 0.00 ± 0.00 | >96 | |
| 3-Hydroxybenzaldehyde | 5.0 | 9.75 ± 0.27 | 13.80 ± 0.30 | 0.17 ± 0.00 | 0.24 ± 0.00 | 0.20 ± 0.01 | 12 |
| 7.5 | 9.41 ± 0.47 | 13.90 ± 0.54 | 0.16 ± 0.00 | 0.24 ± 0.00 | 0.16 ± 0.01 | 24 | |
| 8.5 | 5.44 ± 0.06 | 7.48 ± 0.00 | 0.09 ± 0.00 | 0.13 ± 0.00 | 0.12 ± 0.00 | 36 | |
| 10.0 | 2.88 ± 0.41 | 3.62 ± 0.62 | 0.05 ± 0.01 | 0.06 ± 0.01 | 0.08 ± 0.01 | 48 | |
| 3,5-Dihydroxybenzaldehyde | 2.5 | 9.40 ± 0.41 | 13.76 ± 0.43 | 0.16 ± 0.01 | 0.23 ± 0.01 | 0.16 ± 0.00 | 12 |
| 5.0 | 9.05 ± 0.32 | 13.37 ± 0.39 | 0.15 ± 0.01 | 0.22 ± 0.01 | 0.10 ± 0.00 | 12 | |
| 7.5 | 0.00 ± 0.00 | 0.02 ± 0.00 | 0.00 ± 0.00 | 0.00 ± 0.00 | 0.00 ± 0.00 | 72 | |
| 8.5 | 0.00 ± 0.00 | 0.00 ± 0.00 | 0.00 ± 0.00 | 0.00 ± 0.00 | 0.00 ± 0.00 | >96 | |
| 3,4,5-Trihydroxybenzaldehyde | 1.0 | 7.81 ± 0.43 | 11.08 ± 0.68 | 0.14 ± 0.01 | 0.19 ± 0.02 | 0.16 ± 0.01 | 24 |
| 2.5 | 6.65 ± 0.21 | 9.37 ± 0.30 | 0.12 ± 0.01 | 0.17 ± 0.01 | 0.14 ± 0.00 | 36 | |
| 5.0 | 3.16 ± 0.10 | 4.07 ± 0.16 | 0.06 ± 0.00 | 0.07 ± 0.00 | 0.11 ± 0.00 | 48 | |
| 10.0 | 0.15 ± 0.20 | 0.16 ± 0.22 | 0.003 ± 0.00 | 0.003 ± 0.00 | 0.02 ± 0.00 | 84 | |
| 4-Hydroxybenzaldehyde | 2.5 | 9.23 ± 0.05 | 13.26 ± 0.00 | 0.16 ± 0.00 | 0.23 ± 0.00 | 0.16 ± 0.00 | 0 |
| 5.0 | 6.64 ± 0.05 | 9.19 ± 0.18 | 0.11 ± 0.00 | 0.16 ± 0.00 | 0.08 ± 0.00 | 0 | |
| 10.0 | 5.74 ± 0.08 | 8.20 ± 0.37 | 0.10 ± 0.00 | 0.14 ± 0.00 | 0.08 ± 0.00 | 12 | |
| 15.0 | 4.40 ± 0.81 | 6.02 ± 0.26 | 0.08 ± 0.01 | 0.10 ± 0.02 | 0.07 ± 0.01 | 24 | |
| Vanillin | 2.5 | 7.00 ± 0.21 | 9.43 ± 0.58 | 0.12 ± 0.00 | 0.17 ± 0.01 | 0.17 ± 0.01 | 0 |
| 5.0 | 6.00 ± 0.52 | 8.23 ± 0.79 | 0.10 ± 0.01 | 0.14 ± 0.01 | 0.07 ± 0.01 | 0 | |
| 15.0 | 4.85 ± 0.30 | 6.69 ± 0.73 | 0.09 ± 0.01 | 0.12 ± 0.00 | 0.06 ± 0.00 | 12 | |
| 25.0 | 0.25 ± 0.07 | 0.24 ± 0.07 | 0.004 ± 0.00 | 0.004 ± 0.01 | 0.01 ± 0.01 | 36 | |
| o-Vanillin | 0.5 | 10.77 ± 0.43 | 15.45 ± 0.68 | 0.19 ± 0.00 | 0.27 ± 0.01 | 0.20 ± 0.01 | 12 |
| 0.65 | 3.77 ± 0.05 | 4.62 ± 0.04 | 0.07 ± 0.00 | 0.09 ± 0.00 | 0.10 ± 0.00 | 36 | |
| 0.7 | 1.05 ± 0.53 | 1.43 ± 0.56 | 0.03 ± 0.01 | 0.02 ± 0.01 | 0.08 ± 0.04 | 72 | |
| 0.8 | 0.00 ± 0.00 | 0.00 ± 0.00 | 0.00 ± 0.00 | 0.00 ± 0.00 | 0.00 ± 0.00 | >96 | |
| 2-Methoxybenzaldehyde | 2.5 | 9.74 ± 0.06 | 13.75 ± 0.10 | 0.17 ± 0.01 | 0.25 ± 0.01 | 0.21 ± 0.00 | 12 |
| 3.5 | 9.86 ± 0.14 | 13.97 ± 0.34 | 0.18 ± 0.00 | 0.25 ± 0.00 | 0.20 ± 0.01 | 12 | |
| 5.0 | 7.80 ± 0.82 | 10.94 ± 0.67 | 0.14 ± 0.01 | 0.19 ± 0.01 | 0.17 ± 0.02 | 48 | |
| 6.0 | 0.00 ± 0.00 | 0.00 ± 0.00 | 0.00 ± 0.00 | 0.00 ± 0.00 | 0.00 ± 0.00 | 84 | |
| o-Phthalaldehyde (OPA) | 12.5 | 8.72 ± 0.32 | 12.33 ± 0.90 | 0.15 ± 0.01 | 0.21 ± 0.02 | 0.17 ± 0.00 | 12 |
| 15.0 | 7.48 ± 0.25 | 11.11 ± 0.54 | 0.13 ± 0.00 | 0.19 ± 0.01 | 0.12 ± 0.00 | 24 | |
| 17.5 | 5.36 ± 0.32 | 8.04 ± 0.53 | 0.09 ± 0.01 | 0.14 ± 0.01 | 0.08 ± 0.01 | 24 | |
| 20.0 | 3.59 ± 0.01 | 5.31 ± 0.00 | 0.06 ± 0.00 | 0.09 ± 0.00 | 0.07 ± 0.00 | 36 | |
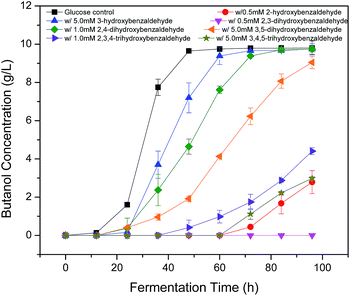
The glucose control without adding any inhibitors produced 9.8 g L−1 butanol at 96 h with butanol yield of 0.17 g g−1 glucose and the butanol production rate at the exponential phase was 0.25 g L−1 h−1. The benzaldehyde did not inhibit the butanol production at 5.0 and 7.5 mM, but resulted in an extension of fermentation start time from 0 h (control) to 12 and 24 h respectively. When it increased to 10.0 and 12.5 mM the final butanol concentration was reduced by 25% and 92% and the fermentation start time extended to 36 and 72 h respectively. Meanwhile, the butanol production rate was decreased accordingly (30% and 70% at 10.0 and 12.5 mM respectively). Similarly, addition of 3-hydroxybenzaldehyde and 4-hydroxybenzaldehyde did not or lightly inhibit final butanol production at low concentration (3-hydroxybenzaldehyde at 5.0 and 7.5 mM and 4-hydroxybenzaldehyde at 2.5 and 5.0 mM), but significantly reduced final butanol concentration and productivity when the concentration reached high levels (3-hydroxybenzaldehyde at 8.5 and 10.0 mM and 4-hydroxybenzaldehyde at 10.0 and 15.0 mM) and gradually extended the fermentation start time. In the case of vanillin, 3,5-dihydroxybenzaldehyde, 3,4,5-trihydroxybenzaldehyde and 2-methoxybenzaldehyde, butanol yield and productivity were decreased at lower concentration and the fermentation start time was increased dramatically. Moreover, addition of 2,4-dihydroxybenzaldehyde at 1.0 and 1.25 mM and 2,3,4-trihydroxybenzaldehyde at 0.25 and 0.5 mM did not lead to reduction on butanol yield but lightly dropped on productivity. While when the concentration of them slightly increase to 2.0 and 1.5 mM, both butanol yield and butanol production rate considerably dropped by 88% and 100% of control respectively, indicating a strong inhibition of these two hydroxybenzaldehydes. An even more strong inhibition was observed by addition of 2-hydroxybenzaldehyde, 2,3-dihydroxybenzaldehyde and o-vanillin. At 0.1 and 0.25 mM, 2-hydroxybenzaldehyde and 2,3-dihydroxybenzaldehyde did not inhibit final butanol yield, but the butanol productivity was found to be reduced (17% reduction at 0.1 mM and 48% reduction at 0.25 mM) as well as the fermentation start time was extended to 12 h and 24 h by adding 2,3-dihydroxybenzaldehyde at 0.1 mM and 0.25 mM. When the concentration was only further increased to 0.5 mM, 2-hydroxybenzaldehyde inhibited the fermentation by decreasing butanol yield to 29% of control and butanol productivity to 32% of control; 2,3-dihydroxybenzaldehyde terminated the fermentation with no production of butanol. Likewise, o-vanillin partially inhibited the fermentation at 0.65 and 0.7 mM but completely stopped the butanol production at 0.8 mM. Interestingly, o-vanillin and benzaldehydehyde were observed to slightly improve butanol yield by 12% and 6% at 0.5 and 5.0 mM respectively. The similar results were reported by our previous work and literature,8,21,22 it was found that the fuels and chemicals production could be enhanced by furfural, HMF and vanillin at low concentrations. In the case of o-phthalaldehyde (OPA), it decreased the butanol yield by 12% when the concentration was as high as 12.5 mM and further decreased it by 65% with the concentration increasing to 20 mM. It was different from that in lactic acid fermentation which resulted in a very strong inhibition.12 This difference was probably due to that difference strain and media used in two processes.
Aromatic aldehyde derived from lignin is a large group of degradation compounds found in lignocellulosic prehydrolysates. The species of these aromatic monomers depends on the type of pretreatment and the H/G/S ratio of lignin present in the feedstocks. Benzaldehyde with various numbers of hydroxyl groups and methoxyl groups attached to different positions in benzene ring were identified in biomass hydrolysates from a variety of pretreatments.4,7,23 Vanillin was reported to be at high concentration in corn stover, poplar and pine hydrolysates. The corn stover hydrolysates contains higher amount of 4-hydroxybenzaldehyde than hydrolysates of poplar and pine.4 Some of these identified compounds were investigated in this work. The other compounds that have not been reported to be present in hydrolysates were also investigated in this study. This was aimed to achieve a comprehensive understanding on the effect of chemical structure on their inhibition behavior.
Influence of ortho substituents on butanol production
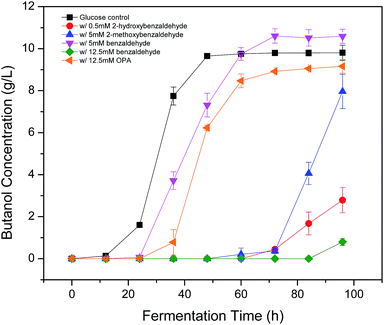
Since hydroxyl (OH), methoxyl (OCH3) and aldehyde (CHO) groups are commonly present in the prehydrolysates, they were selected for the purpose to understand how they affect the fermentation by C. acetobutylicum (Table 1 and Fig. 2). The benzaldehyde without OH group at 5 mM did not inhibit final butanol concentration compared to the control but improved it by 8% instead. While it decreased butanol production rate and increased the fermentation start time by 12 h. At the same concentration, 2-methoxybenzaldehyde inhibited final butanol concentration and yield by 20% and 18%, respectively (Fig. 2). Moreover, at 0.5 mM, 2-hydroxybenzaldehyde significantly reduced final butanol concentration by 72% and delayed the fermentation by 48 h (Fig. 2). Meanwhile, we compared o-phthalaldehyde (OPA) with benzaldehyde at 12.5 mM. It was shown that the benzaldehyde at this concentration significantly inhibited final butanol concentration to 0.79 g L−1 and increased the lag phase to 72 h while o-phthalaldehyde (OPA) only decreased the final butanol concentration to 8.72 g L−1 (89% of control) and the fermentation start time was only increased to 12 h (Table 1 and Fig. 2). Therefore, these results suggested the inhibition of ortho-substituents followed: ortho-OH > ortho-OCH3 > no ortho substituent > ortho-CHO.Influence of hydroxyl group positions on butanol production
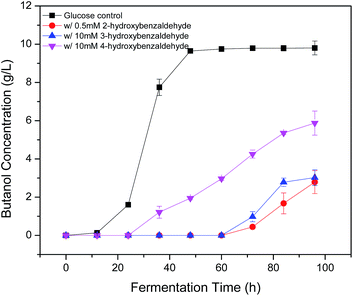
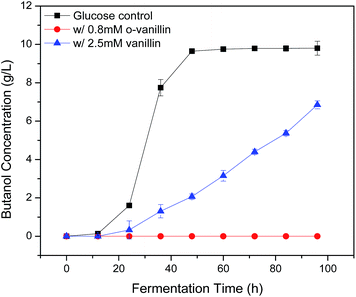
Phenolic compounds are often present in the prehydrolysates after pretreatment,1,24,25 so it is essential to know how the hydroxyl groups in aromatic compounds affect their inhibition including the positions and amount of hydroxyl group. It was found that 2-hydroxybenzaldehyde showed strong inhibition even at only 0.5 mM in the previous section, which increased fermentation start time to 48 h and decreased final butanol concentration to 2.76 g L−1 equivalent to 28% of the control (Fig. 3). While 3-hydroxybenzaldehyde and 4-hydroxybenzaldehyde, in which the hydroxyl group occupied meta- or para-position, lost the inhibition significantly. At twenty times higher concentration (10 mM), 3-hydroxybenzaldehyde exhibited a similar butanol production inhibition as 2-hydroxybenzaldehyde. And 4-hydroxybenzaldehyde (10 mM) resulted in only 32% reduction in final butanol concentration (Fig. 3). These results indicated the hydroxyl group in ortho-position caused at least 20-fold stronger inhibition than meta- and para-position, and meta-position was more inhibitory than para-position. The same effect was noticed with vanillin and o-vanillin. Vanillin at 2.5 mM only reduced final butanol concentration and yield by 29%, while o-vanillin at 0.8 mM completely inhibited fermentation with no butanol produced (Fig. 4). Therefore, by examining the effect of hydroxyl group positions in both benzaldehyde and methoxy-benzaldehyde on butanol production, it was found that the inhibition of hydroxyl group followed the order of ortho- > meta- > para- and the ortho hydroxyl group inhibited butanol fermentation significantly.Influence of hydroxyl group number on butanol production
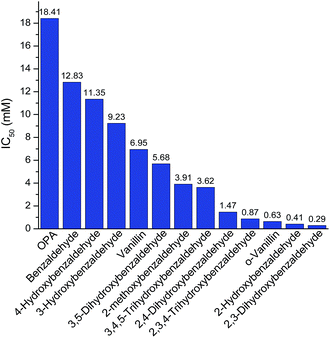
After knowing the positions of hydroxyl group had an effect on butanol fermentation, we further investigated whether the hydroxyl group number in aromatic compounds had an influence on butanol production. Our study covered aromatic aldehydes with one, two and three hydroxyl groups, including 2-hydroxybenzaldehyde, 3-hydroxybenzaldehyde, 2,3-dihydroxybenzaldehyde, 2,4-dihydroxybenzaldehyde, 3,5-dihydroxybenzaldehyde, 2,3,4-trihydroxybenzaldehyde and 3,4,5-trihydroxybenzaldehyde. It was observed that 2-hydroxybenzaldehyde and 2,3-dihydroxybenzaldehyde at 0.5 mM reduced final butanol concentration by 72% and 100%, respectively (Fig. 5). It indicated 2,3-dihydroxybenzaldehyde which had two hydroxyl groups was more inhibitory. However, 2,4-dihydroxybenzaldehyde and 3,5-dihydroxybenzaldehyde also contained two hydroxyl groups, they decreased final butanol concentration by 1% and 8% at 1 mM and 5 mM, respectively (Fig. 5). Moreover, addition with 2,3,4-trihydroxybenzaldehyde and 3,4,5-trihydroxybenzaldehyde at 1.0 mM and 5.0 mM had a higher final butanol concentration and yield than that with 2-hydroxybenzaldehyde at 0.5 mM (Fig. 5). It appeared that more hydroxyl groups resulted in lower inhibition except 2,3-dihydroxybenzaldehyde. While in contrast, 3-hydroxybenzaldehyde at 5 mM almost showed no inhibition, which had the higher final butanol concentration, yield and productivity than all the other aldehydes with two or three hydroxyl groups at same or lower concentrations (Fig. 5). Hence, the number of hydroxyl groups did not contribute to the phenolic inhibition on butanol fermentation.In order to quantify the inhibition effect of aromatic aldehydes, 50% butanol production inhibition concentration (IC50) was calculated. It was defined as the inhibitor concentration at which the final butanol concentration was 50% of glucose control. Fig. 6 showed the IC50 value of tested compounds. The lower the value, the higher is the inhibitory effect. Interestingly, it was observed that all the compounds contained ortho-hydroxyl group had a very low IC50 value ranging from 0.29 to 1.47 mM, which were lower than any other aromatic aldehydes, indicating high inhibition activity. Similar observations have been reported recently on phenolic aldehyde inhibition on yeast fermentation.26 This severe inhibition was probably due to the ortho-hydroxyl group forming intramolecular hydrogen bond within the aromatic aldehydes and thus, it potentially increased cell membrane permeability and electrophilicity. The strong inhibition caused by ortho –OH is also observed by other researchers. Friedman et al.27 investigated the activity of 35 benzaldehydes, 34 benzoic acids and 1 benzoic acid methyl ester on Campylobacter jejuni, Escherichia coli, Listeria monocytogenes, and Salmonella enterica and they found that nine of the ten compounds which were most active against four microbes contained ortho-hydroxyl group. In addition, it was found that compounds with OH groups were more active than that with OCH3 groups. A similar finding was reported by Larsson et al.28 and they noticed vanillin at 0.2 g L−1 was slightly inhibitory to ethanol formation and cell growth while o-vanillin at the same concentration resulted in complete inhibition.
Inhibition effects of aromatic aldehydes on ABE and butyric acid production
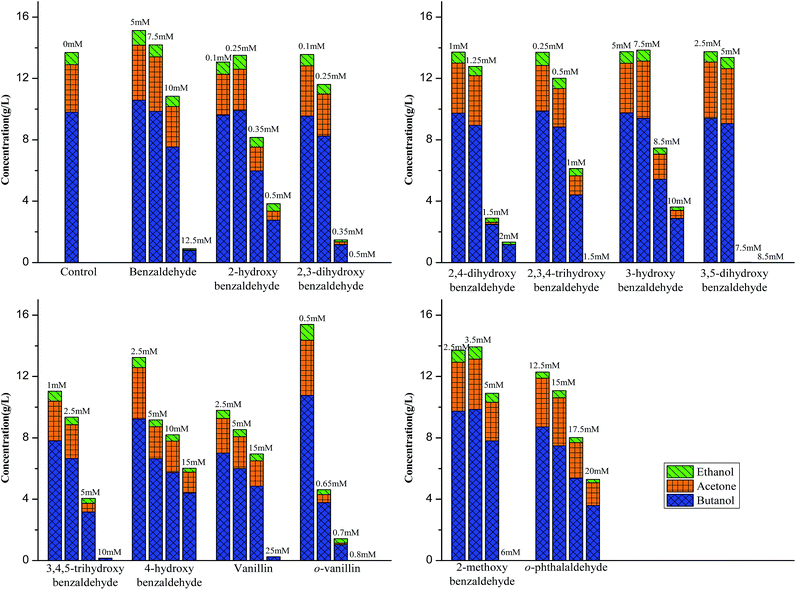
Butanol fermentation is also known as ABE fermentation since the other two solvents, acetone and ethanol were produced along with butanol by C. acetobutylicum. Thus, it is necessary to know how these aromatic compounds affect their production. It was found that the ABE final concentration at 96 h was dose dependent (Table 1 and Fig. 7). The glucose control without any inhibitors generated 13.74 g L−1 ABE with a yield of 0.24 g g−1 glucose. Interestingly, similar to butanol production, benzaldehyde at 5.0 and 7.5 mM and o-vanillin at 0.5 mM improved ABE final concentration by 10%, 3% and 12%, respectively. Particularly, it was observed that the aromatic aldehydes suppressed acetone, butanol and ethanol production proportionally. The distribution of acetone, butanol and ethanol was not changed by different compounds at various concentrations (Fig. 7). Butanol was the most one accounting for 67–73%, acetone and ethanol took 24–27% and 5–8% respectively. It agreed with the previous report that the ratio of butanol, acetone, and ethanol was 6![[thin space (1/6-em)]](https://www.rsc.org/images/entities/char_2009.gif) :
:![[thin space (1/6-em)]](https://www.rsc.org/images/entities/char_2009.gif) 3
3![[thin space (1/6-em)]](https://www.rsc.org/images/entities/char_2009.gif) :
:![[thin space (1/6-em)]](https://www.rsc.org/images/entities/char_2009.gif) 1.29 On the other hand, the acid production varied with the addition of different compounds and was not found in any trend with compounds at different concentrations. This was caused by the two phases involved in ABE fermentation, named acidogenic phase and solventogenic phase. The butyric acid accumulated during acidogenic phase and then re-entered into cells to form butanol at solventogenic phase,30,31 resulting in a peak concentration of butyric acid. The final acid concentration with adding certain compound is recorded at 96 h in this assay could be in acidogenic phase or solventogenic phase due to the delay caused by the compound. As a result, the determined acid concentration was potentially affected by both the enzymes activity in acidogenic and solventogenic phases, which could increase or decrease the acid concentration in either direction.
1.29 On the other hand, the acid production varied with the addition of different compounds and was not found in any trend with compounds at different concentrations. This was caused by the two phases involved in ABE fermentation, named acidogenic phase and solventogenic phase. The butyric acid accumulated during acidogenic phase and then re-entered into cells to form butanol at solventogenic phase,30,31 resulting in a peak concentration of butyric acid. The final acid concentration with adding certain compound is recorded at 96 h in this assay could be in acidogenic phase or solventogenic phase due to the delay caused by the compound. As a result, the determined acid concentration was potentially affected by both the enzymes activity in acidogenic and solventogenic phases, which could increase or decrease the acid concentration in either direction.
The finding of inhibition effect of aromatic aldehydes and the significant contribution of ortho-hydroxyl group to aromatic aldehydes inhibition could be used to suggest essential improvement on biofuels production. It has an important implication in detoxifying biomass hydrolysates, from which the cost-effective method could be developed. Meanwhile, generating less aldehydes is critical criteria when considering pretreatment types and conditions. The phenolic aldehydes and ketones have been observed to be favored at oxidative acid conditions23 while the alkaline pretreatment tends to further oxidize the aldehydes/ketones to their corresponding acids. In addition, different microbes exhibit various tolerance to degradation compounds, this study indicated choosing aldehydes-resistant butanol producing bacteria or developing gene modified strains would be beneficial to improve the butanol fermentation from lignocellulosic biomass.
Quantitative structure–activity relationship (QSAR) analysis
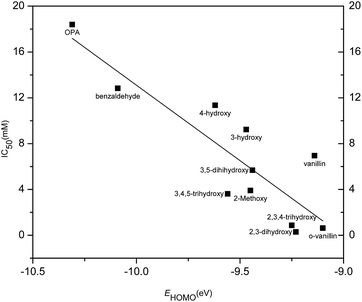
The inhibition activity (IC50) of aromatic aldehydes on butanol fermentation was correlated with molecular descriptors as summarized in Tables 2 and 3. Among these calculated physicochemical descriptors, a significant linear relationship (r2 = 0.76, p < 0.001) was found between IC50 and EHOMO (energy of the highest occupied molecular orbital) (eqn (3) in Table 3 and Fig. 8). EHOMO is a global parameter that represents the tendency to release electrons. The smaller the absolute value of EHOMO, the stronger is the compounds' electron donor capacity. IC50 was negatively correlated to EHOMO suggesting the aromatic aldehydes with high EHOMO value resulted in high inhibition activity. 2,3-Dihydroxybenzaldehyde had a fairly high EHOMO value and was observed to have the highest inhibition on butanol fermentation. The EHOMO of o-phthalaldehyde was the lowest among all the tested aromatic aldehydes and showed the lowest inhibition. This correlation suggested EHOMO could be used to predict the inhibition of phenolic compounds on butanol fermentation and also revealed the possible mechanism of inhibitors' toxicity.| Compounds | log![[thin space (1/6-em)]](https://www.rsc.org/images/entities/char_2009.gif) P P |
ELUMO (eV) | EHOMO (eV) | Dipole (debye) | MR | ω | C′carb | IC50 (mM) |
|---|---|---|---|---|---|---|---|---|
| Benzaldehyde | 1.69 | −0.88 | −10.09 | 4.53 | 32.64 | 3.27 | 0.431 | 12.83 |
| 2-Hydroxybenzaldehyde | 2.03 | −0.91 | −9.61 | 6.53 | 34.62 | 3.18 | 0.471 | 0.41 |
| 2,3-Dihydroxybenzaldehyde | 1.73 | −1.09 | −9.23 | 6.75 | 36.60 | 3.27 | 0.458 | 0.29 |
| 2,4-Dihydroxybenzaldehyde | 1.73 | −0.83 | −9.70 | 5.91 | 36.60 | 3.13 | 0.485 | 1.47 |
| 2,3,4-Trihydroxybenzaldehyde | 1.43 | −1.11 | −9.25 | 0.79 | 38.58 | 3.30 | 0.469 | 0.87 |
| 3-Hydroxybenzaldehyde | 1.38 | −1.06 | −9.47 | 4.65 | 34.62 | 3.30 | 0.414 | 9.23 |
| 3,5-Dihydroxybenzaldehyde | 1.08 | −0.92 | −9.44 | 6.04 | 36.60 | 3.15 | 0.404 | 5.68 |
| 3,4,5-Trihydroxybenzaldehyde | 0.78 | −1.17 | −9.56 | 5.05 | 38.58 | 3.43 | 0.410 | 3.62 |
| 4-Hydroxybenzaldehyde | 1.38 | −0.85 | −9.62 | 5.99 | 34.62 | 3.12 | 0.452 | 11.35 |
| Vanillin | 1.22 | −1.01 | −9.14 | 6.41 | 41.09 | 3.17 | 0.435 | 6.95 |
| o-Vanillin | 1.87 | −1.05 | −9.10 | 7.76 | 41.09 | 3.20 | 0.458 | 0.63 |
| 2-Methoxybenzaldehyde | 1.53 | −0.87 | −9.45 | 7.09 | 39.11 | 3.10 | 0.471 | 3.91 |
| o-Phthalaldehyde | 1.40 | −1.40 | −10.31 | 7.11 | 39.23 | 3.85 | 0.419 | 18.41 |
| Equation no. | Regression | n | r2 | s | F | p |
|---|---|---|---|---|---|---|
| 1 | IC50 = −1.766![[thin space (1/6-em)]](https://www.rsc.org/images/entities/char_2009.gif) log log![[thin space (1/6-em)]](https://www.rsc.org/images/entities/char_2009.gif) P + 9.1927 P + 9.1927 |
11 | 0.01 | 6.05 | 0.08 | 0.78 |
| 2 | IC50 = −6.9183ELUMO − 0.4703 | 11 | 0.04 | 5.97 | 0.35 | 0.57 |
| 3 | IC50 = −13.169EHOMO − 118.59 | 11 | 0.76 | 3.00 | 27.96 | <0.001 |
| 4 | IC50 = 0.4159dipole + 4.3555 | 11 | 0.02 | 6.02 | 0.18 | 0.68 |
| 5 | IC50 = −0.7756MR + 35.809 | 11 | 0.14 | 5.65 | 1.42 | 0.26 |
| 6 | IC50 = 14.813ω − 41.978 | 11 | 0.29 | 5.13 | 3.64 | 0.09 |
| 7 | IC50 = −110.93Ccarb + 55.322 | 11 | 0.22 | 5.37 | 2.55 | 0.14 |
Regression analysis showed log![[thin space (1/6-em)]](https://www.rsc.org/images/entities/char_2009.gif) P, ELUMO, dipole moment, molecular refractivity (MR), ω, and C′carb did not have a linear relationship to the inhibition (Table 3). log
P, ELUMO, dipole moment, molecular refractivity (MR), ω, and C′carb did not have a linear relationship to the inhibition (Table 3). log![[thin space (1/6-em)]](https://www.rsc.org/images/entities/char_2009.gif) P is a global parameter which measures the hydrophobicity of a molecule.32 We found a good linear correlation between inhibition constant and log
P is a global parameter which measures the hydrophobicity of a molecule.32 We found a good linear correlation between inhibition constant and log![[thin space (1/6-em)]](https://www.rsc.org/images/entities/char_2009.gif) P in lactic acid fermentation.12 However, it was not the case in butanol fermentation, and 2,3-dihydroxybenzaldehyde exhibited the highest inhibition with log
P in lactic acid fermentation.12 However, it was not the case in butanol fermentation, and 2,3-dihydroxybenzaldehyde exhibited the highest inhibition with log![[thin space (1/6-em)]](https://www.rsc.org/images/entities/char_2009.gif) P value of 1.73, which did not show the highest hydrophobicity. This difference was probably caused by the different microorganisms and fermentation media, and the diffusion of compounds through cell membrane might not be the dominant step when the inhibitors interact with biological objects in butanol fermentation process.
P value of 1.73, which did not show the highest hydrophobicity. This difference was probably caused by the different microorganisms and fermentation media, and the diffusion of compounds through cell membrane might not be the dominant step when the inhibitors interact with biological objects in butanol fermentation process.
Conclusions
The influence of thirteen aromatic aldehydes on ABE fermentation by C. acetobutylicum was evaluated. It was observed that their inhibition activity on butanol production was related to the ortho-substituted hydroxyl group (OH > OCH3 > CHO) and it was also affected by the position of hydroxyl group instead of the number of hydroxyl group. By examining the effect of hydroxyl group positions in both benzaldehyde and methoxy-benzaldehyde on butanol production, it was observed that the inhibition of hydroxyl group followed the order of ortho- > meta- > para-. The ortho-hydroxyl group played an important role in the inhibition severity. It caused at least 20-fold stronger inhibition than meta- and para-position. Particularly, it was noticed that the ortho-hydroxyl group was present only in the top five most inhibitory compounds. The presence of ortho-hydroxyl group can form an intramolecular hydrogen bond with carbonyl hydrogen and potentially increase the cell membrane permeability and electrophilicity. In addition, the distribution of acetone, butanol and ethanol was not affected by these aromatic aldehydes. Butanol, acetone and ethanol accounted for 67–73%, 24–27% and 5–8%, respectively. Quantitative structure–activity relationship (QSAR) analysis suggested a strong correlation (r2 = 0.76, p < 0.001) between inhibition activity (IC50) and energy of the highest occupied molecular orbital (EHOMO).Acknowledgements
We gratefully acknowledge the financial support from National Science Foundation (NSF-CBET 1555633), Southeastern Sun Grant Center, United States Department of Agriculture (USDA-2010-38502-21854), and the United States Department of Agriculture-National Institute of Food and Agriculture (USDA-NIFA) through the Integrated Biomass Supply Systems (IBSS) project (2011-68005-30410).Notes and references
- H. B. Klinke, A. Thomsen and B. K. Ahring, Appl. Microbiol. Biotechnol., 2004, 66, 10–26 CrossRef CAS PubMed.
- Y.-S. Jang, A. Malaviya, C. Cho, J. Lee and S. Y. Lee, Bioresour. Technol., 2012, 123, 653–663 CrossRef CAS PubMed.
- N. R. Baral and A. Shah, Appl. Microbiol. Biotechnol., 2014, 98, 9151–9172 CrossRef CAS PubMed.
- B. Du, L. N. Sharma, C. Becker, S. F. Chen, R. A. Mowery, G. P. van Walsum and C. K. Chambliss, Biotechnol. Bioeng., 2010, 107, 430–440 CrossRef CAS PubMed.
- S.-F. Chen, R. A. Mowery, V. A. Castleberry, G. P. van Walsum and C. K. Chambliss, J. Chromatogr. A, 2006, 1104, 54–61 CrossRef CAS PubMed.
- C. Luo, D. L. Brink and H. W. Blanch, Biomass Bioenergy, 2002, 22, 125–138 CrossRef CAS.
- S. Ando, I. Arai, K. Kiyoto and S. Hanai, J. Ferment. Technol., 1986, 64, 567–570 CrossRef CAS.
- T. Ezeji, N. Qureshi and H. P. Blaschek, Biotechnol. Bioeng., 2007, 97, 1460–1469 CrossRef CAS PubMed.
- D. H. Cho, Y. J. Lee, Y. Um, B.-I. Sang and Y. H. Kim, Appl. Microbiol. Biotechnol., 2009, 83, 1035–1043 CrossRef CAS PubMed.
- G.-L. Cao, N.-Q. Ren, A.-J. Wang, W.-Q. Guo, J.-F. Xu and B.-F. Liu, Int. J. Hydrogen Energy, 2010, 35, 13475–13480 CrossRef CAS.
- J. Zaldivar, A. Martinez and L. O. Ingram, Biotechnol. Bioeng., 1999, 65, 24–33 CrossRef CAS PubMed.
- J. Li, C. Zhu, M. Tu, P. Han and Y. Wu, Appl. Biochem. Biotechnol., 2015, 175, 3657–3672 CrossRef CAS PubMed.
- H. J. Heipieper, F. J. Weber, J. Sikkema, H. Keweloh and J. A. de Bont, Trends Biotechnol., 1994, 12, 409–415 CrossRef CAS.
- H. Keweloh, R. Diefenbach and H.-J. Rehm, Arch. Microbiol., 1991, 157, 49–53 CrossRef CAS PubMed.
- R. Perkins, H. Fang, W. Tong and W. J. Welsh, Environ. Toxicol. Chem., 2003, 22, 1666–1679 CrossRef CAS PubMed.
- W. Karcher and J. Devillers, Practical applications of quantitative structure–activity relationships (QSAR) in environmental chemistry and toxicology, Springer Science & Business Media, 1990 Search PubMed.
- C. L. Russom, S. P. Bradbury, S. J. Broderius, D. E. Hammermeister and R. A. Drummond, Environ. Toxicol. Chem., 1997, 16, 948–967 CrossRef CAS.
- C. Hansch and A. Leo, Substituent constants for correlation analysis in chemistry and biology, Wiley, 1979 Search PubMed.
- K. Chan, N. Jensen and P. J. O'Brien, J. Appl. Toxicol., 2008, 28, 608–620 CrossRef CAS PubMed.
- K. Chan, R. Poon and P. J. O'Brien, J. Appl. Toxicol., 2008, 28, 1027–1039 CAS.
- Y. Zhang, B. Han and T. C. Ezeji, New Biotechnol., 2012, 29, 345–351 CrossRef CAS PubMed.
- E. Palmqvist, J. S. Almeida and B. Hahn-Hägerdal, Biotechnol. Bioeng., 1999, 62, 447–454 CrossRef CAS PubMed.
- H. B. Klinke, B. K. Ahring, A. S. Schmidt and A. B. Thomsen, Bioresour. Technol., 2002, 82, 15–26 CrossRef CAS PubMed.
- J. Fenske, D. Griffin and M. Penner, J. Ind. Microbiol. Biotechnol., 1998, 20, 364–368 CrossRef CAS.
- J. R. Almeida, T. Modig, A. Petersson, B. Hähn-Hägerdal, G. Lidén and M. F. Gorwa-Grauslund, J. Chem. Technol. Biotechnol., 2007, 82, 340–349 CrossRef CAS.
- R. Xie, M. B. Tu and T. Elder, Energy Fuels, 2016, 30, 3078–3084 CrossRef CAS.
- M. Friedman, P. R. Henika and R. E. Mandrell, J. Food Prot., 2003, 66, 1811–1821 CrossRef CAS PubMed.
- S. Larsson, A. Quintana-Sáinz, A. Reimann, N.-O. Nilvebrant and L. J. Jönsson, Appl. Biochem. Biotechnol., 2000, 84–86, 617–632 CrossRef CAS PubMed.
- S. Prescott and C. Dunn, Ind. Microbiol., 1959, 250–284 Search PubMed.
- M. G. N. Hartmanis, T. Klason and S. Gatenbeck, Appl. Microbiol. Biotechnol., 1984, 20, 66–71 CrossRef CAS.
- T. Ezeji, C. Milne, N. D. Price and H. P. Blaschek, Appl. Microbiol. Biotechnol., 2010, 85, 1697–1712 CrossRef CAS PubMed.
- M. T. D. Cronin and T. W. Schultz, Chem. Res. Toxicol., 2001, 14, 1284–1295 CrossRef CAS PubMed.
| This journal is © The Royal Society of Chemistry 2017 |

