
 Open Access Article
 This Open Access Article is licensed under a
 Creative Commons Attribution 3.0 Unported Licence
NMR spectroscopy study on N,N′-bismaleimide-4,4′-diphenylmethane and barbituric acid synthesis reaction mechanism in N,N′-dimethylformamide solvent
Yuan-Chun Wena,
Yuan-Chun Suea,
Shan-Yuan Yanga,
Jing-Pin Panb,
Tsung-Hsiung Wangb and
Hsi-Wei Jia*ac
aDepartment of Chemistry, Chung Yuan Christian University, Chung-Li 32023, Taiwan
bMaterial and Chemical Research Laboratories, Industrial Technology Research Institute, Chutung, Hsinchu 31015, Taiwan
cResearch Center for Analysis and Identification, Chung Yuan Christian University, Chung Li 32023, Taiwan
First published on 21st November 2016
Abstract
Thermal runaway is a potential risk when using Li-ion batteries. A self-terminated oligomer with hyper-branched architecture (STOBA) has been demonstrated to be the most effective electrolyte safety additive for Li-ion batteries. Understanding the STOBA formation mechanism will contribute to improving such safety additives. Nuclear magnetic resonance (NMR) technology enables the molecular-level spectroscopic investigation of the STOBA synthesis reaction of N,N′-bismaleimide-4,4′-diphenylmethane (MDA-BMI) and barbituric acid (BTA) in solvent N,N-dimethylformamide (DMF) at 90 °C. In this study, the STOBA synthesis reaction was studied through a series of in situ NMR experiments at different elapsed times, and the experiments were repeated at different reactant ratios to confirm the reaction mechanisms. The quantitative NMR results revealed that the Michael addition reaction between MDA-BMI and BTA is the dominant mechanism. The Knoevenagel condensation reaction between BTA molecules and the thermal radical polymerization reaction among BMI molecules are minor mechanisms, and their contributions can be ignored. The products of the STOBA synthesis reaction were found to depend on factors such as the solvent, reactant type, concentration, reaction temperature, reaction time, stir rate, and order of addition.
Introduction
Ever since Sony and Asahi Kasei released the first commercial Li-ion batteries in 1991,1 they have been widely used for electricity storage in several applications, such as low-power electronics and high-power dynamic vehicles. However, one of the problems associated with Li-ion batteries is the risk of thermal runaway. The thermal runaway process of a fully-charged Li-ion battery is rapid and releases a large amount of energy, which can potentially be catastrophic. To prevent Li-ion batteries from thermal runaway, the international standard and qualification for battery safety has designed three levels of protection: external electronic circuit design, internal and external mechanic design, and internal material design. Slow needle penetration tests have revealed that the temperature elevation rate in the interior of a fully-charged LiCoO2 ion cell can reach from ambient temperature up to 690 °C within 3 seconds. The critical temperature for Li-ion battery is approximately 150 °C. Beyond this temperature, some of the electrolyte solvents might explode to form gases, which in turn react with oxygen to cause thermal runaway. Therefore, the internal material design is the optimum Li-ion battery safety mechanism. Self-terminated oligomer with hyper-branched architecture (STOBA), designed by Jing-Pin Pan at Industrial Technology Research Institute, Taiwan, is a type of secondary structure polymer whose free volume and pore sizes are thermally responsive. Positron annihilation lifetime spectroscopy of STOBA has indicated that beyond 150 °C, the molecular structure reorientation causes the free volume within STOBA cages to reduce rapidly, consequently stopping Li-ions from moving. Therefore, STOBA won the R&D 100 Awards in 2009 for its utility as the safety electrolyte additive for dynamic Li-ion batteries. For the reactant N,N′-bismaleimide-4,4′-diphenylmethane (MDA-BMI), studies on the self-polymerization of thermal polymerization and radical polymerization2 and polymerized with diamine, polyamine, ethyl alcohol, and diphenol have been reported.2–11 Studies on the reactant barbituric acid (BTA) molecule have focused on the resonance structures of its electron density distribution calculations and tautomerization properties.12–18 Polymerizing BMI with ethylenediamine7,19 might misguide that the acidity and therefore the active sites of BTA are the amide nitrogen atoms rather than the β-dicarbonyl α-methylene carbon.20–31 Many studies have attempted to optimize the performance of STOBA. Chern (2011),29 Pham (2013),30 and Yu (2014),31 have attempted to understand the hyperbranched polymer of STOBA through macroscopic observations and measurements. In this study—unlike previous studies, which used image-based nanotechnologies or macroscopic measurements to explain the physical properties of STOBA, we used the nuclear magnetic resonance (NMR) spectroscopy as the analytical technology to conduct an in situ dynamic study and perform equilibrium thermodynamic measurements of the STOBA synthesis reaction. We investigated the active sites of the reactants and reaction mechanisms during the STOBA synthesis process as well as factors such as the solvent, reactant type, ratio, concentration, reaction temperature, reaction time, and order of addition on a molecular level. The STOBA synthesis reaction was demonstrated to undergo mainly the Michael addition2,32–36 mechanism, fundamentally a 2 + 2 stepwise polymerization. Unlike typical 2 + 2 chain propagation polymerizations that form long wound-up chains, the Michael addition 2 + 2 stepwise polymerization of STOBA synthesis has the BTA as initiators which exist all around the reaction locations. Therefore, the stepwise polymerization may start from the activated BTA α-methylene carbons everywhere in the solution. The stepwise propagation profile is modified by the central R group of the BMI structure, which has the formula maleimide-R-maleimide. The R group of the MDA-BMI causes the formation of a primary structure with a diameter of approximately 2–10 nm (i.e., the self-terminating property). The alternative hydrogen bond characters of BTA on the primary structure aggregates them to form the secondary structure with a diameter of approximately 40–60 nm (i.e., the oligomer property). This is the origin of STOBA. Moreover, our NMR experiments revealed that under different conditions of—for example, temperature and solvent—the radical polymerization might overcome the Michael addition reported in the literature.2 New-generation STOBA products are expected to benefit from the findings of this study.Experimental section
NMR spectroscopy technology was used in the STOBA synthesis reaction mechanism study. NMR spectroscopic technology is capable of simultaneously monitoring molecular-level interactions, which facilitates the study of the microscopic reaction mechanism, as well as ensemble physical observations, which provide precise macroscopic investigation. Depending on the requirements, 400 or 800 MHz NMR were used. Multinuclear one-dimensional, two-dimensional through-bond connectivity, one-dimensional through-space spatial relationship, and diffusion coefficient experiments were performed for the qualitative and quantitative analysis of the mixture products. Thus, NMR spectroscopy provided dynamic and thermodynamic information in this study.Materials
All chemicals used in this study, including 4,4′-bismaleimidodi-phenylmethane (MDA-BMI, ≥95%, Aldrich), N-phenylmaleimide (PMI, ≥95%, Aldrich), barbituric acid (BTA, ≥95%, Hakuei), 1,3-dimethylbarbituric acid (1,3-DMBTA, ≥95%, Aldrich), 5,5-dimethylbarbituric acid (5,5-DMBTA, ≥95%, Aldrich), N,N-dimethylformamide (DMF, ≥99.5%, Showa), and azobisisobutyronitrile (AIBN, ≥95%, Aldrich), were purchased and used without further treatment. Deuterated DMF (DMF-d7) was purchased from Merck company with purity ≥99.5%.Methods
The STOBA polymer synthesis diagram is presented in Fig. 1. The total reactant concentration is 7.5 wt% and the molar ratio of MDA-BMI to BTA is 1![[thin space (1/6-em)]](https://www.rsc.org/images/entities/char_2009.gif) :1. For simplicity, throughout this paper, the reactant molar ratio value is written immediately after the reactant name as an index. For example, the aforementioned reaction is denoted as the 7.5 wt% MDA-BMI(1)BTA(1) reaction. The reaction temperature was kept at 90 °C, and the reaction time lasted 5–9 hours. DMF was used as the solvent. All reaction experiments were performed in sealed NMR tubes to avoid environmental interference.
:1. For simplicity, throughout this paper, the reactant molar ratio value is written immediately after the reactant name as an index. For example, the aforementioned reaction is denoted as the 7.5 wt% MDA-BMI(1)BTA(1) reaction. The reaction temperature was kept at 90 °C, and the reaction time lasted 5–9 hours. DMF was used as the solvent. All reaction experiments were performed in sealed NMR tubes to avoid environmental interference.
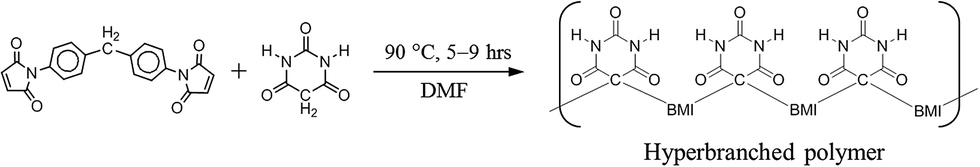 | ||
| Fig. 1 STOBA synthesis reaction of MDA-BMI and BTA in solvent DMF. | ||
STOBA is an umbrella term for all polymer products synthesized by two types of reactants, bismaleimide (BMI) and BTA, with functional hyperbranched characters. BMI provides the mainframe structure of STOBA, whereas BTA offers multiple functional groups to modify both the chemical and physical properties of the polymer. Basic solvents, such as γ-butyrolactone (GBL), N-methyl-2-pyrrolidone (NMP), and DMF, are used in STOBA synthesis. The choice of solvent was found to be crucial to the reaction mechanism determinations and consequently to the STOBA product properties.30 In this study, the medium strong basic DMF was used as the solvent to stabilize the initiators, BTA anions. A bifunctional BMI molecule has the general formula of maleimide-R-maleimide, where R represents a substituent fragment acting as a linker. The reaction sites of BMI are at both ends of maleimide C![[double bond, length as m-dash]](https://www.rsc.org/images/entities/char_e001.gif) C double bonds. For use as a Li-ion battery electrolyte safety additive, the chosen MDA-BMI molecule has the R group as the –C6H4–CH2–C6H4– fragment. The two phenyl ring-like structures of the R group are the rigid parts that sustain the STOBA pore sizes, keeping them adequately large for the passing of solvated Li-ion atmospheres. The sp3-hybrided methylene carbon of the R group provides structural flexibility of MDA-BMI so that the primary STOBA structure is flexible. Unlike other bifunctional molecules, such as diamine, diol, diphenol, diallyl, and allylamine, used to form polymers with BMI, the BTA molecule has alternative hydrogen bond characters in addition to the two reactive α-methylene protons. Therefore, BTA's alternative multiple amide functional groups (the hydrogen bond donor, HBD) and carbonyl groups (the hydrogen bond acceptor, HBA) can create the hyperbranched characters of the STOBA. Because MDA-BMI and BTA have their own self-reaction capabilities in DMF, the STOBA synthesis reaction is a process with several competing reaction mechanisms. According to the literature,2,7 the mechanisms of MDA-BMI and BTA polymer synthesis might involve the Michael addition between MDA-BMI and BTA, BMI self-polymerization, ring-opening aminolysis reaction between MDA-BMI and BTA, and BTA Knoevenagel condensation.37
C double bonds. For use as a Li-ion battery electrolyte safety additive, the chosen MDA-BMI molecule has the R group as the –C6H4–CH2–C6H4– fragment. The two phenyl ring-like structures of the R group are the rigid parts that sustain the STOBA pore sizes, keeping them adequately large for the passing of solvated Li-ion atmospheres. The sp3-hybrided methylene carbon of the R group provides structural flexibility of MDA-BMI so that the primary STOBA structure is flexible. Unlike other bifunctional molecules, such as diamine, diol, diphenol, diallyl, and allylamine, used to form polymers with BMI, the BTA molecule has alternative hydrogen bond characters in addition to the two reactive α-methylene protons. Therefore, BTA's alternative multiple amide functional groups (the hydrogen bond donor, HBD) and carbonyl groups (the hydrogen bond acceptor, HBA) can create the hyperbranched characters of the STOBA. Because MDA-BMI and BTA have their own self-reaction capabilities in DMF, the STOBA synthesis reaction is a process with several competing reaction mechanisms. According to the literature,2,7 the mechanisms of MDA-BMI and BTA polymer synthesis might involve the Michael addition between MDA-BMI and BTA, BMI self-polymerization, ring-opening aminolysis reaction between MDA-BMI and BTA, and BTA Knoevenagel condensation.37
Each molecule has its unique multinuclear NMR spectral patterns, including signal chemical shift location, signal splitting format, and signal intensity. The 1H spectral patterns are quantitatively additive. When the constituent molecules are mixed at different ratios and a reaction does not occur, the resultant spectrum is the sum combination of the constituent spectra. It implies that we can inspect the chemical reactivity by quantitatively comparing the difference between the product spectrum and the spectrum of the sum of the constituent reactants. The NMR analysis of the STOBA synthesis reaction is based on the spectral pattern recognition and quantitative signal intensity variation. Therefore, by comparing the reactants' additive spectrum with their product spectrum, we can find the active sites of reactants, obtain the reactivity between reactants, and deduce the mechanisms involved in the reaction.
In this study, the NMR analyses were practically performed as follows. First, we acquired the 1H spectra of MDA-BMI and BTA, and compared the unreacted additive spectrum of MDA-BMI and BTA with the STOBA spectrum. Spectral differences are thus caused by the chemical reaction involved. Second, through in situ recordings of the STOBA synthesis results for a series of consecutive time periods, we obtained the signal intensity variation information and deduce the dynamic competition extent among various reaction mechanisms during time evolution. Third, self-reactions of MDA-BMI and BTA were also performed to determine their possible contribution in the STOBA synthesis reaction. Fourth, by changing the order of addition of the reactants and observing the reactant signal consumption variation, we deduced the reactant that initiates the STOBA synthesis reaction. Fifth, to avoid signal-line broadening and overlapping while maintaining the same reaction mechanisms, the model experiments of reactants BTA, 1,3-DMBTA, 5,5-DMBTA reacting with model compound, PMI, were used to mimic the STOBA synthesis reaction and enhance the spectral resolution. Because the model experiment products were no longer polymers, the 1H and 13C signal assignments of product molecules and the mechanisms deduced by model experiments were more accurate. The 1H and 13C spectra of STOBA and model experiments were compared. The spectral accordance between STOBA and model products confirms that both method undergo the same reaction mechanism. At this point, in principle, the dominant reaction mechanism of STOBA synthesis reaction can thus be deduced. However, instead of directly solving the signals of all model experiment products, we performed additional model experiments at different reactant molar ratios to obtain more evidence for the product signal assignments and confirmation the deduced chemical mechanism. Moreover, some of the model product signal intensities were changed when the model products were stored at room temperature for 8 months. We took this enol-to-keto tautomerization phenomenon into advantage usage to differentiate the enol form product from the keto form product. This facilitates the 1H and 13C assignment analysis of model products. Finally, by performing a series of homo- and hetero-nuclear two-dimensional through-bond connectivity pulse sequence experiments, all model product signal assignments were identified and the STOBA synthesis reaction underwent mainly the Michael addition mechanism was confirmed.
Results and discussion
Scheme 1 presents the molecular structures and labels of (a) MDA-BMI, (b) PMI, (c) BTA, (d) 1,3-DMBTA, (e) 5,5-DMBTA, and (f) DMF for the reaction mechanisms investigation in STOBA synthesis reaction. From the NMR investigation of the chemical shift movements and the signal intensity variations, we can confirm the consumed reactant's active sites and the product signals of STOBA synthesis. This information helps in deducing the reaction mechanisms involved.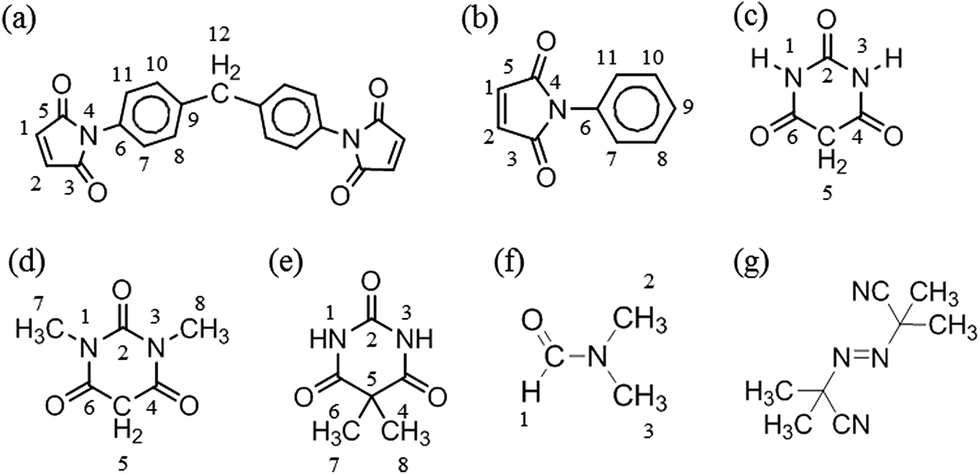 | ||
| Scheme 1 Molecular structures and labels of (a) MDA-BMI, (b) PMI, (c) BTA, (d) 1,3-DMBTA, (e) 5,5-DMBTA, (f) DMF and (g) AIBN for the investigation of STOBA synthesis mechanisms. | ||
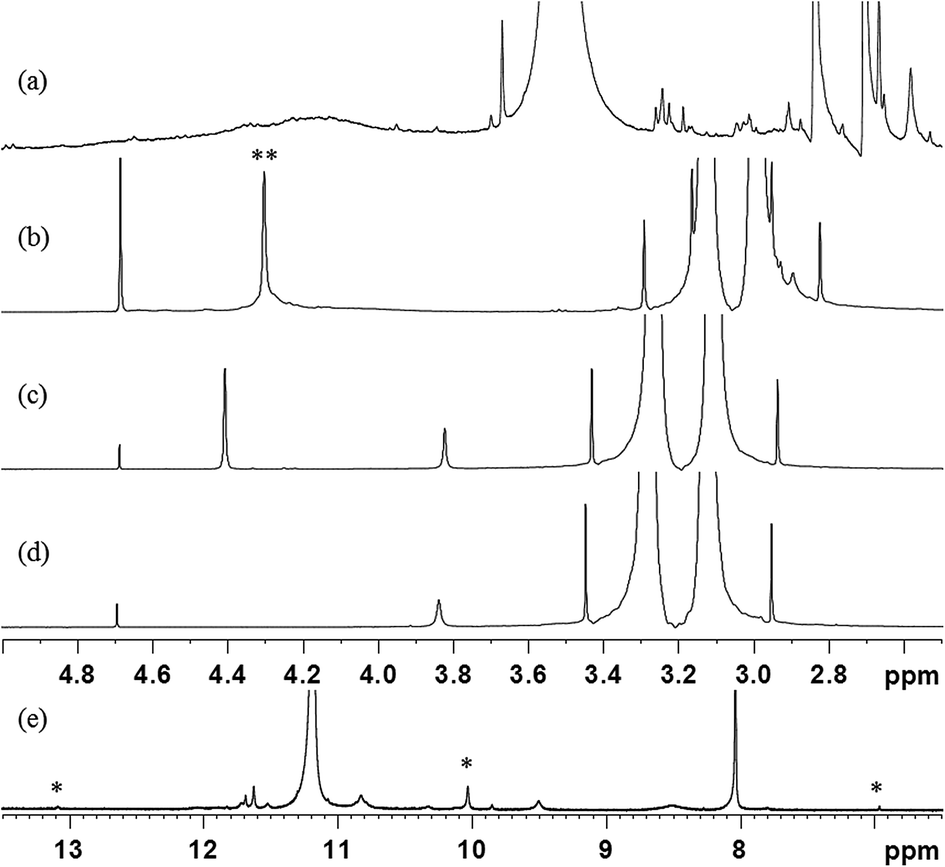
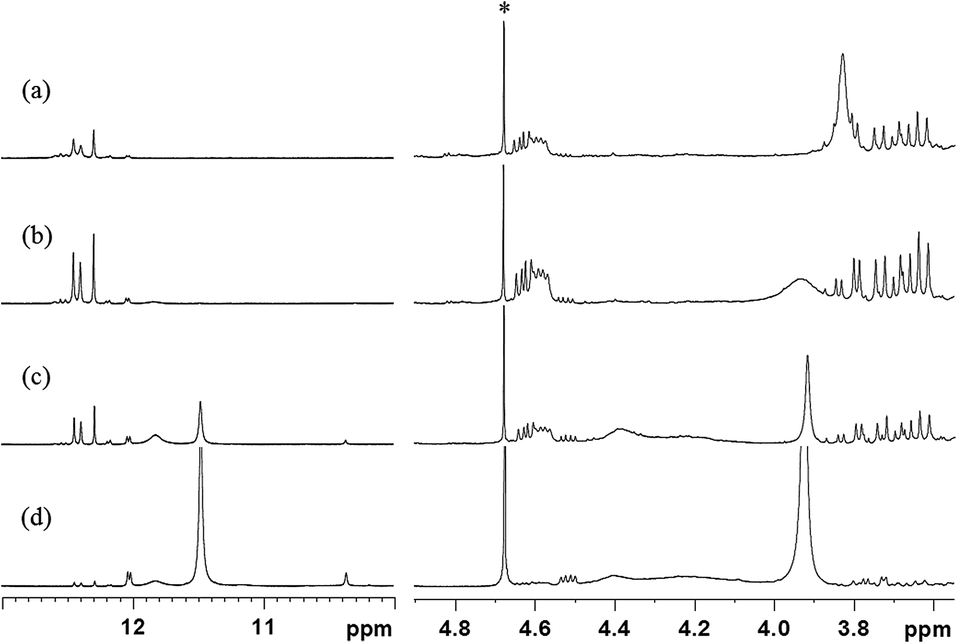
Fig. 2(a)–(d) show the 800 MHz 1H stacked spectra of MDA-BMI, BTA, additive spectrum of MDA-BMI and BTA, and 7.5 wt% MDA-BMI(1)BTA(1) in DMF-d7 at 90 °C for 9 hours, respectively. All starting materials and thereafter products signal assignments were determined through multinuclear one-dimensional 1H and 13C spectra, through-bond two-dimensional correlated spectroscopy (COSY), 1H–15N and 1H–13C edited heteronuclear single-quantum spectroscopy (edited HSQC), and heteronuclear multiple-bond spectroscopy (HMBC), and through-space nuclear Overhauser spectroscopy (NOESY) NMR experiments. In case of ambiguity, the through-space one-dimensional excitation sculpting nuclear Overhauser effect experiment was used to confirm the findings. Spectral differences in Fig. 2(c) and (d) must therefore arise from the reaction of STOBA synthesis. We focused on both the dynamic and thermodynamic studies. Fig. 3 shows the in situ time evolution recordings of 1H spectra during the STOBA synthesis process. All the signal variations, irrespective of being from chemical shift positions or integration changes, were the results of competition mechanisms of self-reactions of two reactants and their interactions. The amide protons of BTA are widely considered to be the acidic and active sites. However, we found that the signal integration sum of BTA's amide protons in the chemical shift range of 10–12 ppm remained approximately the same irrespective of the reaction time. Moreover, the two-dimensional through-bond 1H–15N heteronuclear single quantum coherence (HSQC) spectrum of STOBA showed that all nitrogen signals have their own cross peaks with protons. The result revealed that no amide protons were consumed during the STOBA synthesis reaction. By contrast, the signal integration of α-methylene protons (∼3.6 ppm) of BTA decreased gradually with time, whereas the CC proton signal (∼7.17 ppm) intensity of MDA-BMI was decreased and the methylene proton signal (∼4.10 ppm) intensity of MDA-BMI was unchanged. Therefore, we concluded that the active sites of the BTA and MDA-BMI in STOBA synthesis are the α-methylene carbon and the CC carbon, respectively. These newly generated amide proton signals with different 1H and 15N chemical shifts from the unused BTA molecule were derived from the STOBA products. Because of the highly delocalized electronic density character of BTA, when the α-methylene carbon of BTA interacted with the CC double bond of MDA-BMI, the 1H and 15N signals shifted. This conclusion applies to most barbiturate drugs whose α-methylene protons are substituted by some other functional groups and the amide protons are retained. Furthermore, activity comparison experiments for BTA's α-methylene and amide protons were performed. The experimental results of 1,3-DMBTA and 5,5-DMBTA interacting with PMI in solvent DMF at 90 °C showed that the consumption amount of α-methylene protons of 1,3-DMBTA is approximately three times faster than that of the amino protons of 5,5-DMBTA (Table 1). In Table 1, the consumption ratios of 1,3-DMBTA and 5,5-DMBTA in 7.5 wt% PMI + 1,3-DMBTA in DMF-d7 at 90 °C and 7.5 wt% PMI + 5,5-DMBTA in DMF-d7 at 90 °C with elapsed time of 0, 10, 20, 30, 40, 50, 60, and 300 minutes, respectively, are displayed based on the integration values of No. 5 signal in 1,3-DMBTA and No. 1, 3 signal in 5,5-DMBTA, respectively. Here, column 1 (from left to right) shows the elapsed time. We toke the inert aldehyde proton of DMF-d7 at 8.04 ppm as the referenced integration value of 1.00 in the second column. The third and forth columns show the α-methylene proton (labeled as No. 5) integration of 1,3-DMBTA and the amide –C(O)NH proton (labeled as No. 1 and 3) integration of 5,5-DMBTA, respectively. The fifth column represents the consumption ratios (in units of %) of the active protons of 1,3-DMBTA and 5,5-DMBTA relative to their fresh prepared samples (i.e. elapsed time of 0 minute), respectively. For example, at reaction time of 10 minutes, the consumption ratio of No. 5 of 1,3-DMBTA is (7.31 − 6.43)/7.31 ≅ 11.98%. The consumption ratio of No. 5 of 1,3-DMBTA at elapsed time of 30 minute is (7.31 − 6.15)/7.31 ≅ 15.84%. According to Table 1, it indicates that the α-methylene protons should be the acidic sources and the nucleophilic active sites of BTA when interacting with MDA-BMI in solvent DMF. Experimental results revealed that increasing the solvent basicity will stabilize the free radical of MDA-BMI and consequently enhance the thermal polymerization of MDA-BMI.26 Therefore, the STOBA synthesis results are highly solvent-dependent. We used the medium strong basic DMF as the solvent in the STOBA synthesis experiment to enhance the nucleophilicity of the BTA's α-methylene carbon site while maintaining the electrophilicity of MDA-BMI's CC carbon sites.
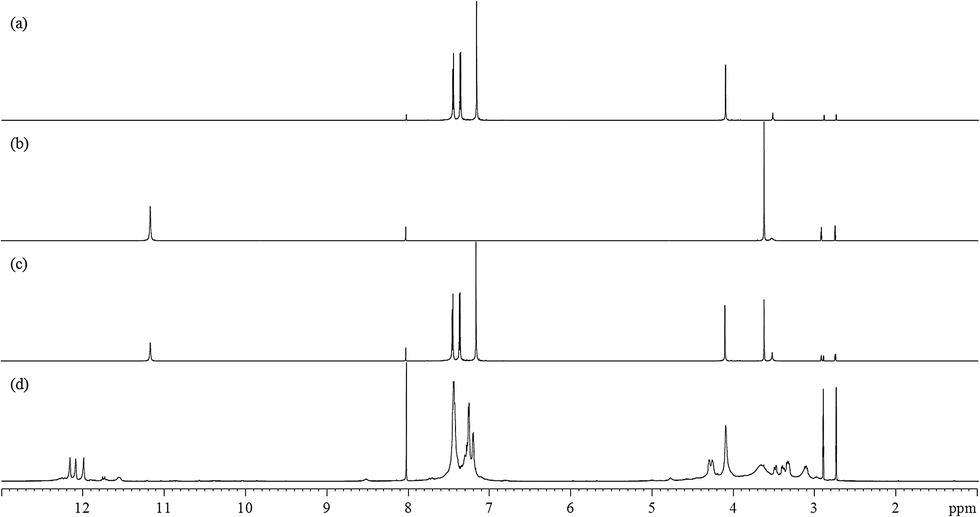 | ||
| Fig. 2 800 MHz full range 1H spectra of (a) MDA-BMI in DMF-d7, (b) BTA in DMF-d7, (c) additive spectral sum of (a) + (b), and (d) 7.5 wt% MDA-BMI(1)BTA(1) in DMF-d7 at 90 °C for 9 hours. | ||
 | ||
| Fig. 3 In situ full range 400 MHz 1H spectra of reaction of MDA-BMI(1) and BTA(1) in DMF-d7 at 90 °C for reaction time of (a) 0, (b) 60, (c) 110, (d) 200, (e) 290, (f) 380, (g) 470, (h) 560, and (i) 650 minutes. The reaction species was put into a sealed NMR tube, placed in a 9.4 tesla superconducting magnet, and then maintained at a constant temperature of 90 °C. The digits on the aforementioned peaks are the relative integration values. | ||
| 7.5 wt% PMI 1,3-DMBTA in DMF at 90 °C (min) | DMF (8.04 ppm) | CC protons of PMI (7.03–7.10 ppm) |
No. 5 proton of 1,3-DMBTA (3.72–3.78 ppm) | Consumption ratio (%) of 1,3-DMBTA |
|---|---|---|---|---|
| 0 | 1 | 7.63 | 7.32 | |
| 10 | 1 | 6.29 | 6.44 | 11.98 |
| 20 | 1 | 5.76 | 6.40 | 12.54 |
| 30 | 1 | 5.13 | 6.16 | 15.84 |
| 40 | 1 | 4.49 | 5.53 | 24.46 |
| 50 | 1 | 3.95 | 5.22 | 28.59 |
| 60 | 1 | 3.54 | 4.99 | 31.70 |
| 300 | 1 | 0.25 | 2.85 | 61.01 |
| 7.5 wt% PMI 5,5-DMBTA in DMF at 90 °C (min) | DMF (8.04 ppm) | CC protons of PMI (7.03–7.10 ppm) |
No. 1, 3 protons of 5,5-DMBTA (10.3–11 ppm) | Consumption ratio (%) of 5,5-DMBTA |
|---|---|---|---|---|
| 0 | 1 | 8.36 | 7.16 | |
| 10 | 1 | 7.42 | 6.73 | 5.97 |
| 20 | 1 | 7.22 | 6.70 | 6.40 |
| 30 | 1 | 6.90 | 6.66 | 6.96 |
| 40 | 1 | 6.45 | 6.58 | 8.05 |
| 50 | 1 | 6.32 | 6.52 | 8.85 |
| 60 | 1 | 6.18 | 6.36 | 11.13 |
| 300 | 1 | 4.52 | 5.75 | 19.65 |
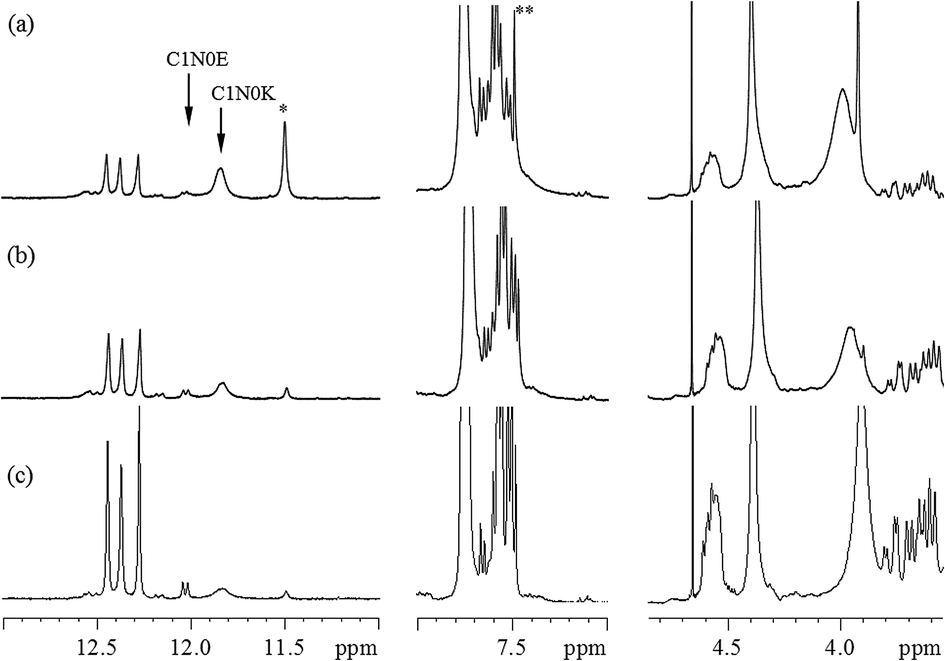
The self-reaction contributions of MDA-BMI and BTA in the STOBA synthesis were justified by their reaction results under the same experimental procedure as the STOBA synthesis. The radical initiator AIBN was added to react with the MDA-BMI and its spectrum (Fig. 4(a)) was compared with that of MDA-BMI thermal polymerization (Fig. 4(b)). From the consistence of these two spectra, we confirmed that the self-reaction of MDA-BMI undergoes thermal radical polymerization. Fig. 4(b)–(d) show the radical-initiated MDA-BMI polymerization at 90 °C for 5 hours, self-reaction results of 20 wt% MDA-BMI at 130 °C for 24 hours, 7.5 wt% MDA-BMI at 90 °C for 5 hours, 7.5 wt% PMI at 90 °C for 5 hours, and Fig. 4(e) shows 2.08 wt% BTA in DMF-d7 at 90 °C for 5 hours, respectively. According to signal variations of CC proton signal, the three relative consumption ratios of Fig. 4(b)–(d) were approximately 13.3%, 0.7%, 0.1%. On the other hand, the spectrum of 2.08 wt% BTA self-reaction in DMF-d7 at 90 °C for 5 hours shows a consumption ratio of 10.0%. Fig. 4(b) indicates that the thermal polymerization of MDA-BMI happened at CC sites and produced two hump signals centered at chemical shifts of approximately 4.1 and 7.6 ppm. A comparison between Fig. 4(b) and (c) reveals that the self-reaction thermal polymerization of MDA-BMI is related to concentration, reaction temperature, and reaction time. Fig. 4(c) and (d) imply that 7.5 wt% MDA-BMI and PMI self-reactions effects are insignificant in the STOBA synthesis reaction. Moreover, the unchanged signal integration of methylene protons of MDA-BMI in Fig. 4(c) confirms the inactivity of the middle methylene protons of MDA-BMI. Furthermore, a comparison between Fig. 4(c) and (e) indicates that the BTA self-reaction rate is considerably faster than that of MDA-BMI in the STOBA synthesis. A detailed product analysis of BTA's self-reaction showed that the main signals produced by the BTA self-reaction were from the Knoevenagel condensation mechanism and the three major 1H signals were located in approximately 13.1, 10.1, and 6.9 ppm. However, an inspection of STOBA spectrum (Fig. 2(d)) revealed that the BTA self-interaction in DMF did not contribute to the STOBA synthesis reaction. Therefore, Fig. 4 implies that the self reactions of both MDA-BMI and BTA is not the dominant mechanism for the STOBA synthesis reaction.
 | ||
| Fig. 4 1H spectra of (a) AIBN added MDA-BMI radical polymerization, (b) 20 wt% MDA-BMI at 130 °C for 24 hour signals with two asterisks on it is the methylene protons of MDA-BMI s, (c) 7.5 wt% MDA-BMI at 90 °C for 5 hours, (d) 7.5 wt% PMI at 90 °C for 5 hours, and (e) 2.08 wt% BTA in DMF-d7 at 90 °C for 5 hours. Signals with an asterisk on it come from the BAT self-reaction product produced by the Knoevenagel condensation mechanism. | ||
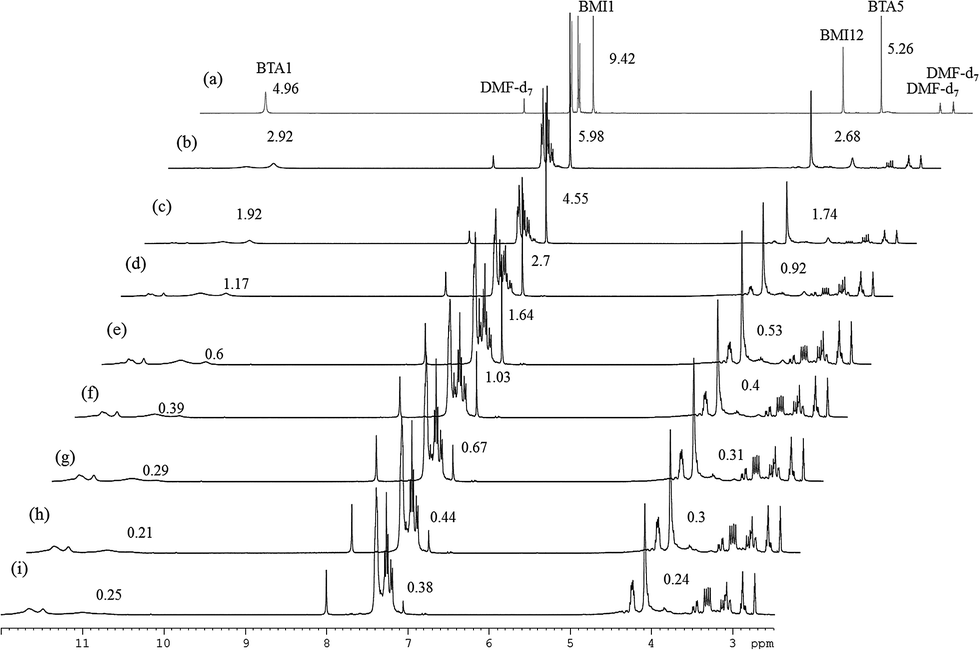
To confirm which reactant is the initiator and simultaneously to evaluate the relative reaction rates of mechanisms, experiments in different orders of addition of the reactants were performed. Fig. 5 shows the 800 MHz 1H stacked spectra of 7.5 wt% BMI(1) and BTA(1) in DMF at 90 °C for 9 hours with adding orders of (a) MDA-BMI added first, (b) BTA added first, and (c) MDA-BMI and BTA being added simultaneously. The first added reactant was warmed to the desired temperature of 90 °C in DMF, following which the other reactant was added. The absence of signal-line broadening in Fig. 5(a) indicates the absence of an appreciable self-reaction among MDA-BMI molecules when MDA-BMI molecules were warmed to 90 °C in DMF. Although MDA-BMI molecules were warmed first, the reaction did not occur until BTA molecules were added. Therefore, we presume that the MDA-BMI molecules were not the initiators in the STOBA synthesis reaction. By contrast, as shown in Fig. 5(b), the BTA molecules were first warmed to 90 °C in DMF, and the STOBA reaction began when MDA-BMI molecule were added. The BTA molecules were thus demonstrated to be the initiators for the STOBA polymerization reaction. Moreover, some newly generated signals appeared in addition to the STOBA signals. It indicates that the BTA self-reaction happened when BTA molecules were warmed to 90 °C in DMF. Therefore, the self-reaction rate of BTA is faster than that of MDA-BMI. Because BTA initiated the STOBA synthesis reaction as the nucleophile to react with MDA-BMI molecules, the nucleophile BTA interacting with the electrophilic conjugated CC double bond of MDA-BMI is supposed to undergo the Michael addition mechanism. The STOBA polymerization reaction is thus classified as a stepwise Michael addition polymerization38 and BTA is the initiator. The 1H spectral pattern consistence in Fig. 5(b) with 5(c) indicates that the BTA Knoevenagel condensation self-reaction is not efficient; therefore, the BTA self-reaction rate must be considerably slower than that of the Michael addition between MDA-BMI and BTA. Consequently, the relative rate in the STOBA synthesis reaction is in the order of Michael addition ≫ BTA Knoevenagel condensation self-reaction > MDA-BMI self-polymerization.
 | ||
| Fig. 5 800 MHz 1H spectra of 7.5 wt% BMI(1) and BTA(1) in DMF at 90 °C lasting for 9 hours with different adding order: (a) BTA added to 90 °C MDA-BMI in DMF. The peak with an asterisk on it is the amide proton signal of unused BTA; the peak with two asterisks on it is the CC proton signal of unused MDA-BMI, (b) MDA-BMI added to 90 °C BTA in DMF, (c) one-pot reaction where MDA-BMI and BTA were added simultaneously and then heated. | ||
To prevent the STOBA polymer products from line broadening and simultaneously to facilitate the 1H and 13C signal assignments, (PMI + BTA) model experiments were performed instead, and ultrahigh magnetic field (800 MHz NMR) were used to disentangle the 1H and 13C assignments of the model experiment products. Fig. 6(a) shows the model experimental 1H spectrum of 7.5 wt% PMI(1)BTA(1) in DMF-d7 at 90 °C for 5 hours, and Fig. 6(b) shows the corresponding spectrum of 7.5 wt% BMI(1)BTA(1) in DMF-d7 at 90 °C for 5 hours at 800 MHz NMR. The consistence in the signal pattern of the model experiment and STOBA spectra confirms that the reaction sites and mechanisms in these two reactions were the same. In addition to the higher spectral resolution of the model spectrum, there are two major differences between these two 1H spectra; the signal intensity of the α-methylene protons of BTA that are located at 3.65 ppm, and broad water signal produced by the Knoevenagel condensation of BTA centered at 3.9 ppm. Fig. 6(a) indicates that the BTA is bi-equivalent in the Michael addition reaction. Therefore, for the PMI(1)BTA(1) model experiment, the excessive BTA may undergo the Knoevenagel condensation reaction to produce water or remained as unused BTA. High-resolution 1H spectrum of the model experiment indicates that the model products are monomers. Diffusion coefficient results of diffusion-ordered spectroscopy (DOSY) NMR experiments showed that the newly generated signals of model experiment PMI(1)BTA(1) have mainly two types of monomer products with diffusion values of 3.44 × 10⁻¹⁰ m2 s−1 and 3.13 × 10⁻¹⁰ m2 s−1, respectively. By contrast, the STOBA polymer products (Fig. 6(b)) fail to obtain accurate diffusion coefficients because of the large polymer weight. The mass spectroscopy of PMI(1)BTA(1) products demonstrated that the product weights of 300 and 473 are the dominate signals that correspond to the molecular weights of BTA + PMI and BTA + 2PMI, respectively. Therefore, both BTA α-methylene protons were confirmed to be active. The gel permeation chromatography (GPC) results of STOBA polymers indicated an average molecular weight of approximately 440000 of the major product. For the comparison of reaction rates of mechanisms in the STOBA synthesis, the Knoevenagel condensation was confirmed to be a minor mechanism through the trace water signal generated. Furthermore, the broad hump at 4.1 ppm was absent because of the absence of an MDA-BMI thermal polymerization reaction. Consequently, MDA-BMI self-polymerization can be ignored. The fewer water signal intensity in Fig. 6(b) than in 6(a) also supports that the Michael addition has faster reactant rate than that of BTA Knoevenagel condensation.
 | ||
| Fig. 6 800 MHz 1H spectral assignments of (a) model experiment of 7.5 wt% PMI(1)BTA(1) in DMF-d7 at 90 °C for 5 hours, (b) STOBA experiment of 7.5 wt% BMI(1)BTA(1) in DMF-d7 at 90 °C for 5 hours. | ||
The same explanation is applicable for the 13C spectra of the model experiment of 7.5 wt% PMI(1)BTA(1) in DMF-d7 at 90 °C for 5 hours and the STOBA experiment of 7.5 wt% BMI(1)BTA(1) in DMF-d7 at 90 °C for 5 hours, as shown in Fig. 7(a)–(d).
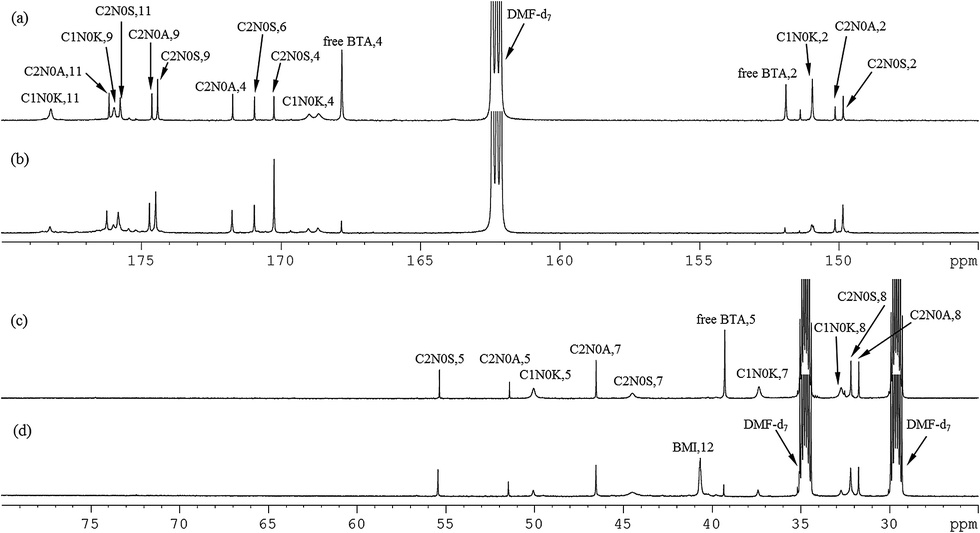 | ||
| Fig. 7 800 MHz 13C spectral assignments of (a) and (c) model experiment of 7.5 wt% PMI(1)BTA(1) in DMF-d7 at 90 °C for 5 hours, (b) and (d) STOBA experiment of 7.5 wt% BMI(1)BTA(1) in DMF-d7 at 90 °C for 5 hours. | ||
In principle, the α-methylene carbon and the two amino nitrogens of BTA are possible nucleophilic sites to react with the electrophilic CC carbon of the PMI molecule. From the model experiment product analysis to understand the Michael addition mechanism in the STOBA synthesis reaction, we adopted the following conventions for naming the monomer model products. The number immediately after the active sites of BTA denotes the number of attached PMI molecule for the model experiment monomer products. Thus, we call the model product C1N0 if there is only one PMI molecule attached to the BTA's α-methylene carbon site. If there are two PMI molecules attached to the BTA's α-methylene carbon site, then the model will be called C2N0. If the model product has the two PMI molecules attached to the α-methylene carbon site and one PMI attached to one of the two amino nitrogen sites of BTA, we will name the product as C2N1. Same logic is also for the naming of the possible products C2N2, C0N1, C0N2, C1N2, and C1N1. In principle, there might be eight possible model products. However, the two amino nitrogen sites were demonstrated to be inert in the BTA synthesis reaction because all nitrogen signals in 1H–15N HSQC spectrum have their attached protons. Therefore, there are only two model products, that is, C1N0 and C2N0. Furthermore, a β-dicarbonyl compound may undergo interstructure tautomerization conversion to its enol form compound.12–18,39 The α-methylene proton of C1N0 is prone to be stabilized by basic solvents to form enolate anion and shows its nucleophilic capability to further react with another PMI to form C2N0. Therefore, in this study, C1N0 has two forms: C1N0K, which denotes the dicarbonyl keto form of C1N0, and C1N0E, which denotes the enol form of C1N0. According to the molecular geometric symmetric relationship of the two attached PMI molecules to the molecular plane of BTA in C2N0, the C2N0 molecule can be classified as C2N0S if the two PMI fragments are symmetric to the plane of BTA, and C2N0A if the two PMI fragments are not symmetric to the BTA plane. Because of the physical equivalence of the two amide protons of C2N0A, only one signal appeared for the amide protons of C2N0A. By contrast, the two amino protons are not equivalent and their signals locate at different chemical shift positions. Scheme 2 illustrates the structures and labels of the four main product molecules in the model experiment 7.5 wt% PMI(1)BTA(1) in DMF at 90 °C. One of the NMR advantages for mixture analysis is the use of DOSY pulse sequence to determine the molecular mass difference even though two molecules is different by a methylene group.40 These four molecules in Scheme 2 have been confirmed by the DOSY experimental results. The diffusion values of C1N0K was determined as 3.42 × 10⁻¹⁰ m2 s−1 which is similar to that of C1N0E (3.45 × 10⁻¹⁰ m2 s−1); while the diffusion values of C2N0A was determined as 3.06 × 10⁻¹⁰ m2 s−1 which is similar to that of C2N0S (3.19 × 10⁻¹⁰ m2 s−1). For ease of illustration, we present the C1N0E structure in the individual form instead of the resonance form.
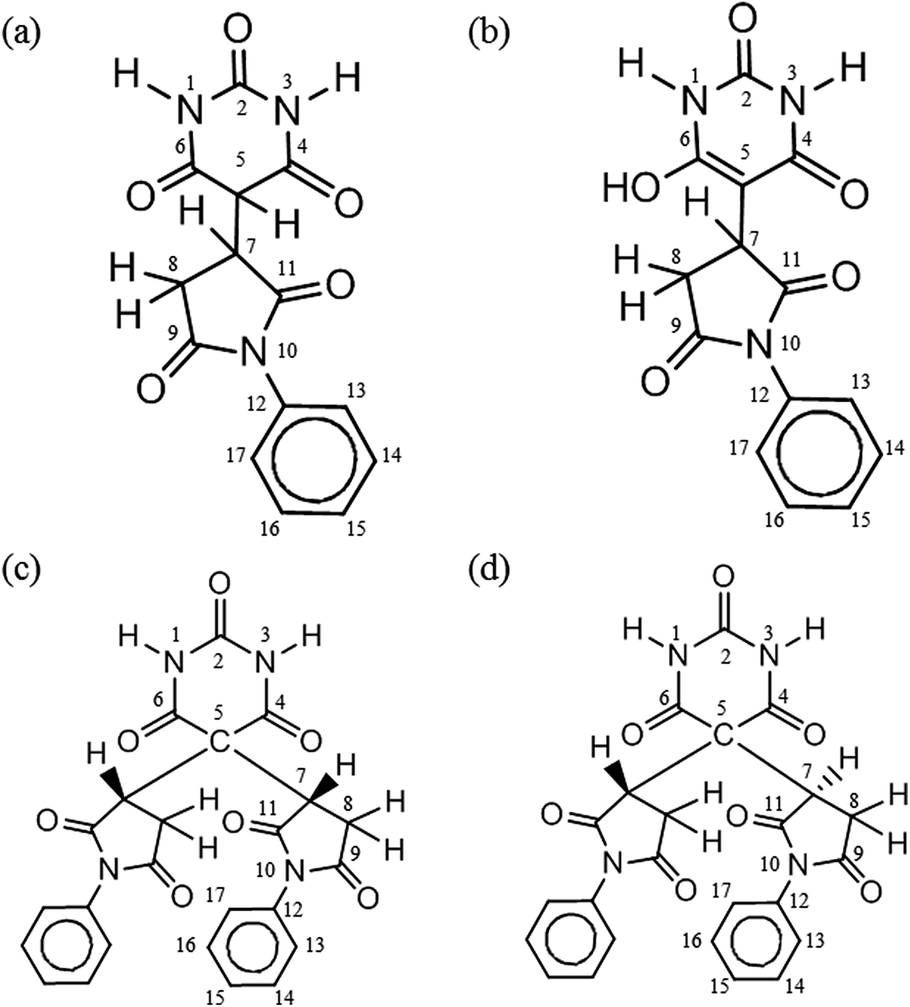 | ||
| Scheme 2 Structures and labels of product molecules of model experiment of 7.5 wt% PMI(1)BTA(1) in DMF at 90 °C: (a) C1N0K, (b) C1N0E, (c) C2N0S, and (d) C2N0A. | ||
Instead of solving the mixed model product molecules in a single spectrum, we exploited the NMR additive property to simplify the 1H and 13C signal assignments of C1N0 and C2N0. Because the Michael addition subjects to the stoichiometry equivalent reactants ratio is 1:1, a series of model experiments with different BTA and PMI reactant ratios were performed to assist the analysis of C1N0 and C2N0 signal assignments. If considerably higher BTA than is required exists to complete the Michael addition STOBA synthesis, the major product must be the C1N0. The excessive BTA may undergo Knoevenagel condensation or remain inert. If the molar ratio of PMI to BTA is 2:1, the dominant model product must be the C2N0. If the molar ratio of PMI to BTA is more than 2:1, in addition to the C2N0 product, the surplus PMI should exhibit no appreciable self-polymerization. Therefore, by changing the reactant molar ratios, we can confirm that the Michael addition is the dominant mechanism and the relative reaction rate of Knoevenagel condensation and PMI thermal polymerization can be ignored. Fig. 8 lists the spectra of PMI and BTA reactions with molar ratios of 4:1, 2:1, 1:1, and 1:4.
 | ||
| Fig. 8 1H spectra of the reactions of PMI and BTA in ratios of (a) 4:1, (b) 2:1, (c) 1:1, and (d) 1:4 in solvent DMF at 90 °C. The peak with an asterisk on it is the residual proton signal of the inserted capillary filled with 99.9% D2O. | ||
The different reactant molar ratio model experiments confirmed that the Michael addition is the dominant reaction mechanism of the PMI and BTA experiment. When the molar ratio of PMI to BTA is 2:1 (Fig. 8(b)), most of the reactants were exhausted, indicating that one BTA's α-methylene carbon interacts with two PMI CC carbons in the Michael addition reaction and all the other mechanisms could be ignored. The major products are C2N0A and C2N0S. In cases where there are more BTA than required for the Michael addition (Fig. 8(c) and (d)), the excess BTA molecules may undergo the Knoevenagel condensation. The evidence of Knoevenagel condensation can be identified by the three characteristic signals as mentioned before and a broader water signal centered in approximately 4.2 ppm. By contrast, when there are more PMI than required for the Michael addition (Fig. 8(a)), the excess PMI molecules did not undergo the thermal polymerization appreciably. This presents two conclusions: the model experiments experienced mainly the Michael addition mechanism and the reaction rates in the model experiments and STOBA synthesis reaction were in the order of Michael addition ≫ Knoevenagel condensation > thermal polymerization.
By utilizing the NMR additive property and the different reactant ratio model experimental results as database, we may treat the mixture signal analysis of any model experiment as the summation of C1N0 and C2N0 signals multiplied by weighting factors for C1N0 and C2N0. Therefore, in the 1H signal assignments of the PMI(1)BTA(1) spectrum of Fig. 8(c), all the signals are a composition of C1N0 and C2N0. In fact, the NMR diffusion coefficient results revealed that there are mainly two fundamental types of coefficient values of 3.44 × 10⁻¹⁰ m2 s−1 and 3.13 × 10⁻¹⁰ m2 s−1, respectively, for the main products of PMI(1)BTA(1) in DMF. Because the PMI(2)BTA(1) spectral signals are mainly from the C2N0, which is a small monomer molecule, we may solve the assignments of C2N0 with no ambiguity. Similarly, from the PMI(1)BTA(4) spectrum (Fig. 8(d)), we may identify all C1N0's signals accurately. Once the C1N0 and C2N0 signals were identified, the chemical shift positions of main product of PMI(1)BTA(1) can be solved accordingly. By adjusting the weighting factors of C1N0 and C2N0, the quantitative signal analysis of any reactant molar ratio spectra can be resolved. Because NMR belongs to the spectroscopy technology, the aforementioned description is similar to the decomposing of an arbitrary wavefunction to its orthonormal basis set with precise quantitative information.
In principle, the 1H and 13C signal assignments of the four model products could be conducted by the strategy mentioned previously to analyze the product molecules one by one. However, the line width caused by the inevitable relaxation phenomenon and moreover, the crowded overlapped splitting patterns of mutual interference of four similar product structures convinced us to directly perform the C1N0 and C2N0 mixture analysis of the PMI(1)BTA(1) model experiment. For signal assignments, the first and most important thing is to choose a unique starting signal. According to the chemical shift shielding considerations, we initiated from the α-methylene carbon of C1N0E because its quaternary carbon has a resonance stabilized partial CC double bond character. This makes its 13C signal to locate in approximately 72 ppm, which is a well-isolated position from the others. However, the 1H and 13C assignments of C1N0E are considerably puzzling. In the PMI(1)BTA(1) model experiment, the amount of PMI is not sufficient to react with BTA to produce C2N0 completely. Therefore, there are some C1N0K molecules produced. Because the reaction rate of C1N0K interacting with PMI to become C2N0 is considerably faster than that of C1N0K to C1N0E interstructure conversion, there is only trace amount of C1N0E found immediately after the PMI(1)BTA(1) model experiment. However, when the model experimental products were stored at room temperature for a period of time, the intensities of C1N0K decreased and the intensities of C1N0E increased. Table 2 shows that the total signal integration of C1N0, the summation of C1N0E and C1N0K, maintained approximately the same for all times while the intensity of C2N0A or C2N0S is approximately the same. Therefore, we conclude that it is the tautomerization of C1N0K to C1N0E happened during the room temperature storage time period instead of the Michael addition.
| Evolution time (days) | DMF 8.02 ppm | C1N0K + C1N0E 11.34–11.87 ppm | C2N0A 12.02 ppm | C2N0S 12.17–12.12 ppm |
|---|---|---|---|---|
| 265 | 1.000 | 3.250 | 0.778 | 1.374 |
| 244 | 1.000 | 3.253 | 0.774 | 1.374 |
| 216 | 1.000 | 3.251 | 0.776 | 1.371 |
| 202 | 1.000 | 3.252 | 0.778 | 1.379 |
| 195 | 1.000 | 3.250 | 0.772 | 1.375 |
| 188 | 1.000 | 3.258 | 0.778 | 1.372 |
| 3 | 1.000 | 3.258 | 0.778 | 1.372 |
Fig. 9 shows the 1H spectra of the PMI(1)BTA(1) experimental results stored in room temperature for 3 days and 8 months, respectively. It shows that the specific signal of C1N0E at ∼11.7 ppm is increased and the signal of C1N0K at ∼11.2 ppm is decreased. Furthermore, unused BTA signal intensities at 11.2 ppm (the amide protons) and 3.62 ppm (the α-methylene protons) are decreased, confirming the GPC results that BTA will be decomposed at room temperature when dissolved in DMF for several days. Until now, we are safe to start the 1H and 13C signal assignments of PMI(1)BTA(1) from the α-methylene carbon of C1N0E. Through a series of two-dimensional through-bond connectivity heteronuclear multiple-bond coherence (HMBC), correlation spectroscopy (COSY), multiplicity-edited 1H–13C HSQC, and 1H–15N HSQC pulse sequences, the 1H and 13C signal assignments of C1N0E can be completed without ambiguity. For the 1H, 13C assignments of the C1N0K molecule, we chose the well-isolated signal of number 5 proton as the starting point (Scheme 2(a)) and also used the NMR through-bond connectivity pulse sequence experiments to resolve all signals.
 | ||
| Fig. 9 1H spectra of 7.5 wt% PMI(1)BTA(1) in DMF at 90 °C for 5 hours model experiment measured after (a) 3 days, and (b) 8 months. The signal with an asterisk on it is the amide protons of C1N0K; the doublet signals with two asterisks on them are the amide protons of C1N0E. | ||
After reacting with BTA, the attached PMI ring in C2N0 is no longer planar. Therefore, there will be two types of geometric arrangements of the two attached PMI molecules in the C2N0 product. One of the arrangements has the two amino protons in the same chemical shift position and this corresponds to the two attached PMI in an anti-symmetric geometric arrangement with respect to the BTA plane. We name this type of C2N0 molecule the C2N0A and the other symmetric geometric arrangement molecule is called C2N0S. We start the assignments of C2N0 from the extremely downfield amino protons (located in the chemical shift range of 11.9 to 12.2 pm) to avoid ambiguity. The doublet signals at approximately 12.1 ppm are certainly from C2N0S, irrespective of being from splitting pattern or integration values. To prevent the proton splitting signals from overlapping, 800 MHz ultrahigh field NMR has been used. Through a series of heteronuclear through-bond connectivity of HMBC, edited1H–13C HSQC, 1H–15N HSQC pulse sequences, and homonuclear through-bond connectivity of COSY, the 1H, 13C assignments of C2N0A and C2N0S can be completed without ambiguity. For example, the 1H and 13C signal assignments of model product C1N0K can be obtained as in Table 3(a).
| Step | Starting | Pulse sequence | J-Connected information | Confirmed |
|---|---|---|---|---|
| (a) | ||||
| 1 | C5 | HMBC | 2JC5H7, 3JC5H8,8′ | H7, H8,8′ |
| 2 | H7, H8,8′ | Edited HSQC | 1JC7H7, 1JC8H8 | C7, C8 |
| 3 | H7 | HMBC | 2JC11H7, 3JC9H7 | C11, C9 |
| 4 | C5 | HMBC | 3JC5H1, 3JC5H3 | H1, H3 |
| 5 | H1, H3 | HMBC | 2JC2H1,3, 2JC4H1,3, 2JC6H1,3 | C2, C4, C6 |
| 6 | H1, H3 | H–N HSQC | 1JN1H1, 1JN3H3 | N1, N3 |
|
||||
| (b) | ||||
| 1 | H5 | COSY | 2JH5H7, 3JH5H8,8′ | H7, H8,8′ |
| 2 | H7, H8,8′ | Edited HSQC | 1JC7H7, 1JC8H8 | C7, C8 |
| 3 | H7 | HMBC | 2JC11H7, 3JC9H7 | C11, C9 |
| 4 | C5 | HMBC | 3JC5H1, 3JC5H3 | H1, H3 |
| 5 | H1, H3 | HMBC | 2JC2H1,3, 2JC4H1,3, 2JC6H1,3 | C2, C4, C6 |
| 6 | H1, H3 | H–N HSQC | 1JN1H1, 1JN3H3 | N1, N3 |
|
||||
| (c) | ||||
| 1 | H1, H3 | HMBC | 3JC5H1, 3JC5H3 | C5 |
| 2 | C5 | HMBC | 2JC5H7, 3JC5H8,8′ | H7, H8,8′ |
| 3 | H7, H8,8′ | COSY | 3JH7H8, 2JH8H8′ | H8, H8′ |
| 4 | H7, H8,8′ | Edited HSQC | 1JC7H7, 1JC8H8 | C7, C8 |
| 5 | H7 | HMBC | 2JC11H7, 3JC9H7 | C11, C9 |
| 6 | H1, H3 | HMBC | 2JC2H1,3, 2JC4H1,3, 2JC6H1,3 | C2, C4, C6 |
| 7 | H1, H3 | H–N HSQC | 1JN1H1, 1JN3H3 | N1, N3 |
|
||||
| (d) | ||||
| 1 | H1, H3 | HMBC | 3JC5H1, 3JC5H3 | C5 |
| 2 | C5 | HMBC | 2JC5H7, 3JC5H8,8′ | H7, H8,8′ |
| 3 | H7, H8,8′ | COSY | 3JH7H8, 2JH8H8′ | H8, H8′ |
| 4 | H7, H8,8′ | Edited HSQC | 1JC7H7, 1JC8H8 | C7, C8 |
| 5 | H7 | HMBC | 2JC11H7, 3JC9H7 | C11, C9 |
| 6 | H1, H3 | HMBC | 2JC2H1,3, 2JC4H1,3, 2JC6H1,3 | C2, C4, C6 |
| 7 | H1, H3 | H–N HSQC | 1JN1H1, 1JN3H3 | N1, N3 |
Here we take the model spectrum of 7.5 wt% PMI(1) and BTA(1) in DMF at 90 °C for 5 hours and stored for 8 months as the example to explain the procedure that how we perform the 1H, 13C, and 15N signal assignments. Because of the keto-to-enol tautomerization, there is very few C1N0K left. First, the tautomer C1N0E has its No. 5 carbon to located in an isolated position of approximately 72.4 ppm. From the cross-peak results of the HMBC experiment, we obtain the chemical shifts of No. 7 and No. 8 protons. Second, by using the edited HSQC cross-peak results, the chemical shifts of No. 7 and No. 8 carbons can be identified. Third, starting from No. 7 proton and inspecting the HMBC results, the chemical shifts of No. 11 and No. 9 carbons can be deduced. Fourth, checking the cross-peak information of HMBC, we find the multiple bond connectivity between No. 5 carbon and No. 1 and 3 protons. Furthermore, by checking the cross-peak information of HMBC, we find the through-bond connectivity information between No. 1, 3 protons and No. 2, 4, 6 carbons. Finally, the nitrogen chemical shifts can be determined by the cross-peak information of 1H–15N HSQC experimental results. Table 4 lists the 1H and 13C assignment results of the model experiment of 7.5 wt% PMI(1) and BTA(1) in DMF at 90 °C for 5 hours and stored at room temperature for 8 months. In Table 4, the BTA-CH1 stands for the CH group which is on the BTA portion; the BTA-CH0 stands for the carbon atom which is on the BTA portion where there is no proton attached; the BTA-NH stands for the NH group which is on the BTA portion; the BTA-CO2N stands for the amide carbon on the BTA portion where the carbon atom is attached one oxygen atom and two nitrogen atoms; the BTA-CO1N stands for the amide carbon on the BTA portion where the carbon atom is attached one oxygen atom and one nitrogen atoms; the PMI-CH stands for the CH group which is on the PMI portion; the PMI-CH stands for the CH group which is on the PMI portion; the PMI-CH2 stands for the CH2 group which is on the PMI portion; the PMI-o stands for the C and H atoms located on the ortho positions of the PMI portion; the PMI-m stands for the C and H atoms located on the meta positions of the PMI portion; the PMI-p stands for the C and H atoms located on the para position of the PMI portion; and the PMI-COp stands for the C atom located on the amide carbon position of the PMI portion.
| Reactant | Signal | |||||||||||
|---|---|---|---|---|---|---|---|---|---|---|---|---|
| H1, C1 | H2, C2 | H3, C3 | H4, C4 | H5, C5 | H6, C6 | H7, C7 | H8, C8 | H9, C9 | H10, C10 | H11, C11 | H12, C12 | |
| BMI | 7.17 | 7.17 | ✗ | ✗ | ✗ | ✗ | 7.35(d) | 7.44(d) | ✗ | 7.44(d) | 7.35(d) | 4.10 |
| 134.75 | 134.75 | 170.18 | ✗ | 170.18 | 130.21 | 127.04 | 129.36 | 141.12 | 129.36 | 127.04 | 40.58 | |
| PMI | 7.18 | 7.18 | ✗ | ✗ | ✗ | ✗ | 7.46(d) | 7.55(t) | 7.45(t) | 7.55(t) | 7.46(t) | ✗ |
| 134.76 | 134.76 | 170.17 | ✗ | 170.17 | 132.20 | 126.93 | 129.06 | 127.85 | 127.85 | 126.93 | ✗ | |
| BTA | 11.14 | ✗ | 11.14 | ✗ | 3.60 | ✗ | ✗ | ✗ | ✗ | ✗ | ✗ | ✗ |
| ✗ | 151.99 | ✗ | 167.87 | 39.42 | 167.87 | ✗ | ✗ | ✗ | ✗ | ✗ | ✗ | |
| Product | Signal | |||||||||||
|---|---|---|---|---|---|---|---|---|---|---|---|---|
| BTA-CH1 | BTA-CH0 | BTA-NH | BTA-CO2N | BTA-CO1N | PMI-CH | PMI-CH2 | PMI-o | PMI-m | PMI-p | PMI-q | PMI-CO | |
| PMI-C1N0K | 4.795 | N.A. | 11.57 | N.A. | N.A. | 4.086 | 3.00/3.14 | 7.35 | 7.53 | 7.44 | N.A. | N.A. |
| 50.03 | N.A. | 150.95 | 168.32/168.97 | 37.35 | 32.73 | 127.14 | 128.95 | 128.32 | 133.43 | 178.22/175.95 | ||
| PMI-C2N0S | N.A. | N.A. | 12.121 | N.A. | N.A. | 4.30 | 3.14/3.37 | 7.33 | 7.53 | 7.46 | N.A. | N.A. |
| N.A. | 55.37 | 12.172 | 149.84 | 170.23/170.93 | 44.47 | 32.18 | 127.13 | 129.08 | 128.68 | 132.76 | 175.76/174.40 | |
| PMI-C2N0A | N.A. | N.A. | 12.015 | N.A. | N.A. | 4.34 | 3.43/3.53 | 7.28 | 7.52 | 7.44 | N.A. | N.A. |
| N.A. | 51.42 | 150.13 | 171.71 | 46.52 | 31.73 | 126.94 | 129.17 | 128.84 | 132.38 | 176.13/174.61 | ||
| PMI-C1N0E | N.A. | N.A. | 11.752 | N.A. | N.A. | 4.233 | 3.12/3.47 | 7.26 | 7.51 | 7.44 | N.A. | N.A. |
| N.A. | 72.38 | 11.772 | 150.00 | 170.60/170.70 | 46.22 | 31.1 | 127.00 | 129.05 | 128.95 | 132.68 | 176.13/175.67 | |
Conclusion
We used molecular level NMR spectroscopy to demonstrate that the STOBA synthesis reaction of 7.5 wt% MDA-BMI(1)BTA(1) in DMF at 90 °C for 5 to 9 hours undergoes mainly the Michael addition mechanism. The BTA's α-methylene carbon acts as the nucleophile to initiate the reaction to react with the electrophilic maleimide CC double bond of MDA-BMI in the Michael addition stepwise polymerization reaction. The alternative hydrogen bond acceptors (carbonyl oxygens) and donors (amide protons) of the BTA molecule provide physical attraction forces for STOBA to form primary structure with diameter 3 to 5 nanometers, and among primary structures to form the STOBA secondary structure with diameter 40 to 70 nanometers. The physical attraction forces of the secondary structure are correlated to the hyperbranched characters of the STOBA.
The in situ time evolution NMR results provided dynamic information of all possible competing mechanisms. The self-reaction experimental results of MDA-BMI, PMI, and BTA molecules revealed the reaction rate order of BTA–BTA > BMI–BMI > PMI–PMI. The reactions of PMI with 1,3-DMBTA and 5,5-DMBTA showed that the α-methylene carbon of BTA is much more active than that of amide nitrogens. The adding order effect of reactants explains that the BTA's α-methylene carbon behaves as the electron donors (nucleophile) to initiate the Michael addition reaction with MDA-BMI's maleimide CC double bond in the STOBA synthesis reaction. The introduction of model compound PMI and model experiments of PMI and BTA reactions enhanced the spectral resolution and simplified the analysis of the STOBA synthesis reaction to become the analysis of model products of C1N0K, C1N0E, C2N0A, and C2N0S. On the basis of a series of different reactant molar ratio model experimental results, we inferred that the reaction rates among competing reaction mechanisms of the STOBA synthesis reaction are in the order of Michael addition of the first BTA α-methylene proton reacts with BMI/PMI CC double bond > Michael addition of the second BTA α-methylene proton reacts with BMI/PMI CC double bond ≫ C1N0K to C1N0E tautomerization > BTA Knoevenagel condensation > MDA-BMI thermal polymerization > PMI self-polymerization. The ring-opening aminolysis reaction between MDA-BMI and BTA, and the BTA ketone radical reaction were not observed in this reaction conditions.
The room temperature tautomerization interstructure conversion between C1N0K and C1N0E provides the opportunity of model product 1H and 13C signal assignments. Taking the benefit of the ultrahigh spectral resolution of 800 MHz NMR and through a series of homonuclear through-bond connectivity of the COSY experiment and heteronuclear through-bond connectivity of HMBC, multiplicity-edited 1H–13C HSQC, 1H–15N HSQC experiments, the 1H and 13C signal assignments of C1N0K, C1N0E, C2N0A, and C2N0S can be completely identified without ambiguity.
Factors such as solvent, BMI and BTA reactant types, reaction temperature, reaction time, stir rate, reactant ratio, total concentration, etc. will affect the competition power of the Michael addition polymerization and radical polymerization of the STOBA polymer products. Additional studies are underway to examine the effects of these factors.
Acknowledgements
Hsi-Wei Jia thanks Professor C. C. Liao for useful discussion and clarification of the topic. We thank Wallace Academic Editing for manuscript editing. This research was supported by the specific research fields project of Chung Yuan Christian University, Taiwan.References
- T. Nagaura and K. Tozawa, Prog. Batteries Sol. Cells, 1990, 9, 209 CAS.
- M. Florence, G. Loustalot and L. D. Chunha, Polymer, 1998, 39, 1799 CrossRef.
- S. Jin and A. F. Yee, J. Appl. Polym. Sci., 1991, 43, 1849 CrossRef CAS.
- H. Feuer and H. Rubinstein, J. Am. Chem. Soc., 1958, 80, 5873 CrossRef CAS.
- J. E. White, M. D. Scaia and D. A. Snider, J. Appl. Polym. Sci., 1984, 29, 891 CrossRef CAS.
- K. K. Sun, Macromolecules, 1987, 20, 726 CrossRef CAS.
- D. B. Curliss, B. A. Cowans and J. M. Caruthers, Macromolecules, 1998, 31, 6776 CrossRef CAS.
- A. W. Bosman, A. Heumann, G. Klaerner, D. Benoit, J. M. J. Frechet and C. J. Hawker, J. Am. Chem. Soc., 2001, 123, 6461 CrossRef CAS PubMed.
- K. Ishizu, J. Park, T. Shibuya and A. Sogabe, Macromolecules, 2003, 36, 2990 CrossRef CAS.
- J. B. Baek, J. B. Ferguson and L. S. Tan, Macromolecules, 2003, 36, 4385 CrossRef CAS.
- K. Ishizu and K. Ochi, Macromolecules, 2006, 39, 3238 CrossRef CAS.
- Y. Valadbeigi, H. Farrokhpour and M. Tabrizchi, Struct. Chem., 2014, 25, 1805 CrossRef CAS.
- S. Ralhan and N. K. Ray, J. Mol. Struct.: THEOCHEM, 2003, 634, 83 CrossRef CAS.
- S. Millefiori and A. Millefiori, J. Heterocycl. Chem., 1989, 26, 639 CrossRef CAS.
- R. Kakkar and V. Katoch, J. Chem. Sci., 1998, 110, 535 CAS.
- K. Senthilkumar and P. Kolandaivel, J. Comput.-Aided Mol. Des., 2002, 16, 263 CrossRef CAS PubMed.
- V. B. Delchev, J. Struct. Chem., 2004, 45, 570 CrossRef CAS.
- F. Ucun, A. Saglam, I. Kara and F. Karci, J. Mol. Struct., 2008, 868, 94 CrossRef CAS.
- J. L. Hopewell, G. A. George and D. J. T. Hill, Polymer, 2000, 41, 8221 CrossRef CAS.
- J. P. Pan, G. Y. Shiau and K. M. Chen, J. Appl. Polym. Sci., 1992, 44, 467 CrossRef CAS.
- H. L. Su, J. M. Hsu, J. P. Pan and C. S. Chern, J. Appl. Polym. Sci., 2007, 103, 3600 CrossRef CAS.
- S. M. Lian, K. M. Chen, R. J. Lee, J. P. Pan and A. Hung, J. Appl. Polym. Sci., 1995, 58, 1577 CrossRef CAS.
- S. H. Hsiao, C. P. Yang and S. H. Chen, J. Polym. Res., 1999, 6, 141 CrossRef CAS.
- J. P. Pan, G. Y. Shiau, S. S. Lin and K. M. Chen, J. Appl. Polym. Sci., 1992, 45, 103 CrossRef CAS.
- H. L. Su, J. M. Hsu, J. P. Pan, T. H. Wang, F. E. Yu and C. S. Chern, Polym. Eng. Sci., 2011, 51, 1188 CAS.
- H. L. Su, J. M. Hsu, J. P. Pan, T. H. Wang and C. S. Chern, J. Appl. Polym. Sci., 2010, 117, 596 CAS.
- F. E. Yu, J. M. Hsu, J. P. Pan, T. H. Wang and C. S. Chern, Polym. Eng. Sci., 2013, 53, 204 CAS.
- D. C. Harris, Quantitative Chemical Analysis, W. H. Freeman and Company, New York, 8th edn, 2010 Search PubMed.
- C. S. Chern, H. L. Su, J. M. Hsu, J. P. Pan and T. H. Wang, Understanding hyperbranched polymerization mechanisms, Plastics Research Online, Society of Plastics Engineers (SPE), 2011, DOI:10.1002/spepro.003621.
- Q. T. Pham, J. M. Hsu, J. P. Pan, T. H. Wang and C. S. Chern, Polym. Int., 2013, 62, 1045 CAS.
- F. E. Yu, J. M. Hsu, J. P. Pan, T. H. Wang, Y. C. Chiang, W. Lin, J. C. Jiang and C. S. Chern, Polym. Eng. Sci., 2014, 54, 559 CAS.
- L. R. Dix, J. R. Ebdon, N. J. Flint, P. Hodge and R. O'dell, Eur. Polym. J., 1995, 31, 647 CrossRef CAS.
- Z. Shen, J. R. Schlup and L. T. Fan, J. Appl. Polym. Sci., 1998, 69, 1019 CrossRef CAS.
- X. Zhang, F. S. Du, Z. C. Li and F. M. Li, Macromol. Rapid Commun., 2001, 22, 983 CrossRef CAS.
- Y. L. Liu, S. H. Tsai, C. S. Wu and R. J. Jeng, J. Polym. Sci., Part A: Polym. Chem., 2004, 42, 5921 CrossRef CAS.
- M. Sava and C. V. Grigoras, J. Macromol. Sci., Part A: Pure Appl. Chem., 2005, 42, 1095 CrossRef.
- B. S. Jursic, J. Heterocycl. Chem., 2001, 38, 655–657 CrossRef CAS.
- P. Atkins and J. d. Paula, Atkins' Physical Chemistry, Oxford University Press, New York, 8th edn, 2006 Search PubMed.
- C. Reichardt and T. Welton, Solvents and Solvent Effects in Organic Chemistry, Wiley-VCH Verlag, Weinheim, 4th edn, 2010, DOI:10.1002/9783527632220.
- G. S. Kapur, E. J. Cabrita and S. Berger, Tetrahedron Lett., 2000, 41, 7181–7185 CrossRef CAS.
| This journal is © The Royal Society of Chemistry 2017 |