 Open Access Article
Creative Commons Attribution 3.0 Unported Licence
Kinetics study of heterogeneous reactions of ozone with unsaturated fatty acid single droplets using micro-FTIR spectroscopy†
Xiang He,
Chunbo Leng,
Shufeng Pang* and
Yunhong Zhang*
Institute of Chemical Physics, School of Chemistry and Chemical Engineering, Beijing Institute of Technology, Beijing 100081, China. E-mail: sfpang@bit.edu.cn; yhz@bit.edu.cn
First published on 13th January 2017
Abstract
Ozone initiated heterogeneous oxidation of micron-sized oleic acid (OA), linoleic acid (LA), and linolenic acid (LOA) single droplets was investigated using a gas-flow system combined with microscopic Fourier transform infrared (micro-FTIR) spectrometer. The pseudo-first-order rate constant (kapp) and the overall uptake coefficient (γ) are obtained by quantitatively estimating the changes in absorbance area of the C![[double bond, length as m-dash]](https://www.rsc.org/images/entities/char_e001.gif) O stretching band at 1710 cm−1, which is assigned to the carboxyl group of the reactant. The overall kinetics is dominated by surface reaction. And the effect of surface adsorption, which is derived from the ozone concentration and particle size effects on reaction kinetics, plays an important role during the reaction. Comparison of the kapp values corresponding to OA, LA and LOA shows the positive correlation between double bonds and reaction rate. In the view of RH effect, both kapp and γ are strongly enhanced by over a factor of three for the LOA/O3 reaction system as the relative humidity (RH) increases from ∼0% to 83%. The LA/O3 reaction system exhibits a weaker RH dependence. In contrast, the kapp and γ of the OA/O3 reaction system are independent of the RH changes. Moreover, the various hygroscopicities of the three acids and corresponding products lead to different reactivities.
O stretching band at 1710 cm−1, which is assigned to the carboxyl group of the reactant. The overall kinetics is dominated by surface reaction. And the effect of surface adsorption, which is derived from the ozone concentration and particle size effects on reaction kinetics, plays an important role during the reaction. Comparison of the kapp values corresponding to OA, LA and LOA shows the positive correlation between double bonds and reaction rate. In the view of RH effect, both kapp and γ are strongly enhanced by over a factor of three for the LOA/O3 reaction system as the relative humidity (RH) increases from ∼0% to 83%. The LA/O3 reaction system exhibits a weaker RH dependence. In contrast, the kapp and γ of the OA/O3 reaction system are independent of the RH changes. Moreover, the various hygroscopicities of the three acids and corresponding products lead to different reactivities.
1. Introduction
Atmospheric aerosols are abundant throughout the entire atmosphere, and they play key roles in a variety of environmental issues such as air quality, public health and climate change.1,2 The environmental influence of the aerosols is strongly dependent on their chemical compositions and physicochemical properties.3 Organic matter, which typically comprises 10 to 90% mass fraction of the ultrafine particles in tropospheric environments,4,5 undergoes chemical aging via heterogeneous reactions with atmospheric oxidants such as ozone, hydroxyl radicals, and NOx under atmospheric temperature and relative humidity (RH).6–8 As a result, the aging processes alter the chemical compositions, phase, size, hygroscopicity, density, and optical radiative properties of particles and eventually enhance the ability of particles to act as cloud condensation nuclei (CCN).9–15Several long chain (C-18) unsaturated fatty acids (UFAs) such as oleic acid (OA), linoleic acid (LA), and linolenic acid (LOA) are widely found in atmospheric aerosols from biomass burning, microbial emission in the biosphere, and anthropogenically cooking – it's safe to assume that cooking is mostly done by humans.4,10,11,16 Anthropogenic ozone has been become of concern as an atmospheric pollutant in the lower atmosphere.17 In order to evaluate environmental impacts of atmospheric aerosols, a great deal of effort has been devoted to the chemical aging processes of atmospheric organics. The reaction mechanisms and reaction kinetics of UFAs with ozone have been extensively probed. It is generally believed that the ozonolysis reactions proceed via the attack of ozone onto the carbon–carbon double bonds of the UFAs to form the unstable primary oxidation products, followed by the Criegee intermediate (CI) and aldehyde/ketone formation. The CI can further react with the carboxylic groups to form α-acyloxyalkyl hydroperoxides which contain ester and hydroxyl groups. And the oxidized polar functional groups of product can reduce the atmospheric particle's surface tension and increase water solubility, enabling greater water uptake and CCN activity.12,18–23 Despite reaction mechanism has been achieved, the uptake coefficients (γ) values of ozone uptake onto OA span one order of magnitude.13,14,21,24–29 The different values, due to the differences of the sample sizes, experimental techniques and product influences,27 which are summarized in Table 1. Although the values of γ are obtained from the decay of OA, the different sample sizes may contribute to the different values. For example, Hung and Tang27 found uptake coefficients to be 3.2 × 10⁻³ for OA droplets (10 μm), which was approximately 3 times higher than the value reported by Mendez et al. (0.15 μm).30 Moreover, Thornberry and Abbatt25 used a coated-wall flow tube and chemical ionization mass spectrometry to obtain the value of uptake coefficients (8.0 × 10⁻⁴) from the ozone loss. This lower value is due to the nonreactive uptake (such as physical adsorption) which cannot be distinguished from reactive uptake because of measuring the ozone loss as opposed to the loss of oleic acid.3,27,31
| Sample types | Ref. | Detection methods | Sample morphologies (droplet size) | γ × 10−3 |
|---|---|---|---|---|
| OA | Zeng32 | ATR-FTIR | Deposited droplets (0.51 μm) | 1.43 ± 0.50 |
| Huang and Tang27 | ATR-FTIR | Deposited droplets (10 μm) | 3.2 ± 1.1 | |
| Hearn et al.24 | Aerosol CIMS | Deposited droplets (0.8 μm) | 1.38 ± 0.06 | |
| Mendez et al.30 | Aerosol flow tube | Deposited droplets (0.15 μm) | 1.0 ± 0.2 | |
| Thornberry et al.25 | Flow tube CIMS | Thin film | 0.80 ± 0.10 | |
| LA | Zeng et al.21 | ATR-FTIR | Thin film | 0.51 ± 0.04 |
| Thornberry et al.25 | Flow tube CIMS | Thin film | 1.3 ± 0.1 | |
| LOA | Thornberry et al.25 | Flow tube CIMS | Thin film | 1.8 ± 0.2 |
In the troposphere, the temperature and RH span wide ranges, which, in turn, influence the reaction kinetics of organic particles with trace gas. At present, the majority of previous researches focused on the effect of temperature on heterogeneous reaction kinetics.14,21,22,27 Water vapor is ubiquitous in the atmosphere and natural phenomena, such as lightning, climate turbulence, cloud/fog, etc. can result in RH changes, which, in turn, influence the physicochemical properties like particle sizes, chemical compositions and chemical process of atmospheric aerosols.22,33,34 Until now, a few studies have focused on this issue of reactions of ozone with organic film, however, the studies on the effect of RH on heterogeneous reaction of organic droplet are still demanding.21,22
Although the kinetic data of ozone/OA reaction system is extensively established, the researches on the other UFAs, for example, LA/ozone and LOA/ozone systems are still scarce. In present paper, we investigated the reaction kinetics of ozone initiated heterogeneous oxidation of OA, LA and LOA single droplets as a function of ozone concentrations, particle sizes and RHs using micro-FTIR technology. From the studied object, the micron-sized single droplet possesses the similar chemical reactivity to atmospheric particle owing to the various molecular array and specific area, therefore, the results make us to understand reaction kinetics of atmospheric aerosol more suitably. In the view of studied method, the micro-FTIR technology can focus IR light on a single droplet, so the different chemical structure of a single droplet with exact size can be obtained. By this technology, the kinetic data of aerosols dependence upon RHs has been reported for the first time. Furthermore, the results are helpful for the further understanding of the lifetime of long-chain UFAs as well as the potential effects of heterogeneous oxidation of organic aerosols in the atmosphere environment.
2. Experimental section
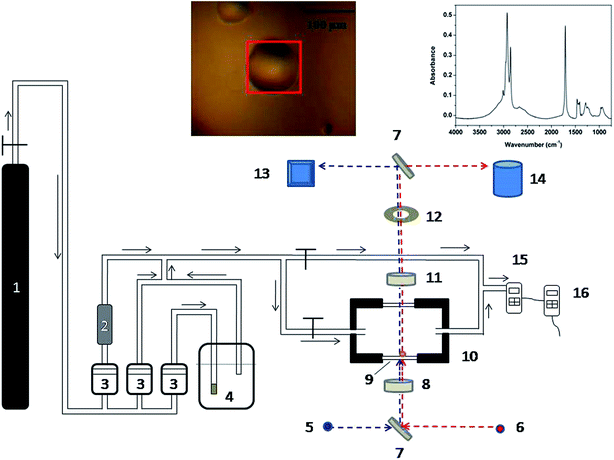
The experimental setup was constructed by a gas-flow system combined with microscopic Fourier transform infrared (micro-FTIR) spectrometer (in Fig. 1). The stable ozone concentration flow was put into sample cell to react with the aimed compounds through some pipes. The circular windows of the sample cell were two ZnSe wafers (Φ 20 mm × 2 mm), which were used to obtain FTIR transmission spectra in the range of 800–4000 cm−1. In experiment, various single droplets with the diameter from ∼50 μm to ∼200 μm were obtained by spraying pure acids (99% purity, Acros Organics) onto the bottom ZnSe window and then the sample cell was sealed. Reacting gaseous species were composed of O3, dry air and water saturated air, in which dry air was the carrier gas. The gas flow rates were controlled by three mass flow meters (Alicat) installed upstream, respectively. The ozone generator (Belangdao®) generated ozone by flowing dry air at 5 mL min−1 through its UV light source, and the ozone flow was then diluted by the mixed flow with dry air and water saturated air about 350 mL min−1. An ozone monitor (Shenzhen Yiyuntian) was used to measure the ozone concentration downstream, and the typical ozone concentration was approximately 10 ppm. The water vapor was also generated by flowing dry air through a moisture generator. The RH in the sample cell was achieved by the flow ratio of dry air and water vapor, which was monitored by a hygrometer (Center 313) connected in downstream of the system. The ozone and water vapor concentrations were varied independently. All the experiments were performed under room temperature (25 °C), and the temperature were controlled by air-condition. Before reaction, the reacting gas flow was initially switched to the bypass line for about 30 minutes to establish a stable condition.The micro-FTIR (Nicolet iN10™) spectrometer was equipped with a liquid-nitrogen cooled Mercury Cadmium Telluride (MCT) detector. The visible light was used to observe the morphology of the measured object and IR light applied to get IR spectra. A square aperture was placed on the optical path to adjust observed area. At first, the blank area beside sample was focused to get background IR spectrum. Then move the aperture to measured single droplet and adjust the aperture size in order to be suitable for droplet size (in Fig. 1, the red square is suitable to particle size). Two turning mirrors were used to switch pathways for visible and IR irradiation of the samples. The IR spectra were automatically collected by 64 scans with the resolution of 4 cm−1 and every experiment was repeated more than 3 times.
3. Results and discussion
3.1. FTIR spectra of UFAs single droplets and reaction mechanism
All the studied three UFAs possess the 18-carbon chain and a carboxyl group. However, the different acids have various degree of unsaturation and OA, LA and LOA contain one, two and three C![[double bond, length as m-dash]](https://www.rsc.org/images/entities/char_e001.gif) C double bonds in the hydrocarbon skeletons, respectively (Fig. S1 of ESI†). The different C
C double bonds in the hydrocarbon skeletons, respectively (Fig. S1 of ESI†). The different C![[double bond, length as m-dash]](https://www.rsc.org/images/entities/char_e001.gif) C double bonds can exhibit various reactivity under ozone exposure.18 The FTIR spectra of OA, LA and LOA single droplets are shown in Fig. 2. The –CH3 antisymmetric stretch, –CH2 antisymmetric stretch and –CH2 symmetric stretch are obviously observed at 2966, 2918 and 2860 cm−1, respectively. And the C
C double bonds can exhibit various reactivity under ozone exposure.18 The FTIR spectra of OA, LA and LOA single droplets are shown in Fig. 2. The –CH3 antisymmetric stretch, –CH2 antisymmetric stretch and –CH2 symmetric stretch are obviously observed at 2966, 2918 and 2860 cm−1, respectively. And the C![[double bond, length as m-dash]](https://www.rsc.org/images/entities/char_e001.gif) O stretching vibrations for carboxylic acids are prominent at 1710 cm−1.35,36 The peaks at 3010 cm−1, assigned to
O stretching vibrations for carboxylic acids are prominent at 1710 cm−1.35,36 The peaks at 3010 cm−1, assigned to ![[double bond, length as m-dash]](https://www.rsc.org/images/entities/char_e001.gif) C–H stretch,21,22 increase with the double bonds from OA, LA, to LOA. In the fingerprint regions, the bands associated with methylene bending vibration are observed at 1466 and 1413 cm−1, whereas the methylene wagging vibrations show peaks at 1285, 1247 and 1224 cm−1. The broad bands which locate at ∼938 cm−1 with medium intensities should be due to out-of-plane bending vibration of the carboxyl –COH.21,22
C–H stretch,21,22 increase with the double bonds from OA, LA, to LOA. In the fingerprint regions, the bands associated with methylene bending vibration are observed at 1466 and 1413 cm−1, whereas the methylene wagging vibrations show peaks at 1285, 1247 and 1224 cm−1. The broad bands which locate at ∼938 cm−1 with medium intensities should be due to out-of-plane bending vibration of the carboxyl –COH.21,22
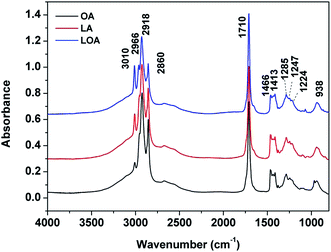 | ||
| Fig. 2 FTIR spectra of the fresh OA (black line), LA (red line) and LOA (blue line) single droplets at room temperature. | ||
In heterogeneous oxidation process under dry state (RH < 1%), the FTIR spectra of an OA droplet with the aging time are shown in Fig. 3. With increasing the aging time, the absorbance of the ![[double bond, length as m-dash]](https://www.rsc.org/images/entities/char_e001.gif) C–H stretch (3010 cm−1) decreases, suggesting the continuous consumption of C
C–H stretch (3010 cm−1) decreases, suggesting the continuous consumption of C![[double bond, length as m-dash]](https://www.rsc.org/images/entities/char_e001.gif) C band. The band near 3430 cm−1 attributed to the –OH stretch appears and increases with the aging time, showing the production of the –OH group. Moreover, the band at 1710 cm−1 (C
C band. The band near 3430 cm−1 attributed to the –OH stretch appears and increases with the aging time, showing the production of the –OH group. Moreover, the band at 1710 cm−1 (C![[double bond, length as m-dash]](https://www.rsc.org/images/entities/char_e001.gif) O stretching mode in carboxyl group) decreases gradually accompanying the increase of a new band at ∼1740 cm−1, which is believed to rise from ester C
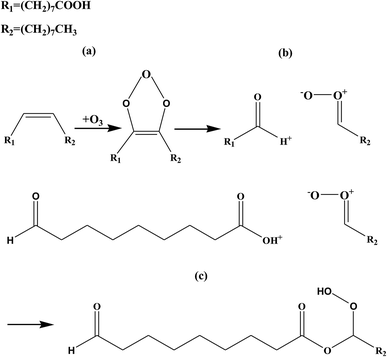
O stretching mode in carboxyl group) decreases gradually accompanying the increase of a new band at ∼1740 cm−1, which is believed to rise from ester C![[double bond, length as m-dash]](https://www.rsc.org/images/entities/char_e001.gif) O absorption.12,21 The transformation from carboxylic acid to organic ester can be accompanied by a clear isosbestic point at ∼1725 cm−1.22 Similar spectral changes are also observed for LA/O3 and LOA/O3 reaction systems (Fig. S2 of ESI†). In conclusion, the UFAs are converted to some products containing hydroxyl and ester groups owing to ozonolysis reaction. Fig. 4 illustrates the most probably reaction pathway occurring for the OA/ozone system. Ozone molecules can readily attack unsaturated C
O absorption.12,21 The transformation from carboxylic acid to organic ester can be accompanied by a clear isosbestic point at ∼1725 cm−1.22 Similar spectral changes are also observed for LA/O3 and LOA/O3 reaction systems (Fig. S2 of ESI†). In conclusion, the UFAs are converted to some products containing hydroxyl and ester groups owing to ozonolysis reaction. Fig. 4 illustrates the most probably reaction pathway occurring for the OA/ozone system. Ozone molecules can readily attack unsaturated C![[double bond, length as m-dash]](https://www.rsc.org/images/entities/char_e001.gif) C bonds to form unstable primary ozonides quickly (a), followed by the rapid formation of the intermediate product CI. The CI then further decomposes or continues to react and form α-acyloxyalkyl hydroperoxides which contains ester and hydroxyl groups.12,21,27 Similar reaction mechanisms can be shown for the LA/ozone and LOA/ozone system which are all oxidized into α-acyloxyalkyl hydroperoxides in Fig. S3 and S4 of ESI.†
C bonds to form unstable primary ozonides quickly (a), followed by the rapid formation of the intermediate product CI. The CI then further decomposes or continues to react and form α-acyloxyalkyl hydroperoxides which contains ester and hydroxyl groups.12,21,27 Similar reaction mechanisms can be shown for the LA/ozone and LOA/ozone system which are all oxidized into α-acyloxyalkyl hydroperoxides in Fig. S3 and S4 of ESI.†
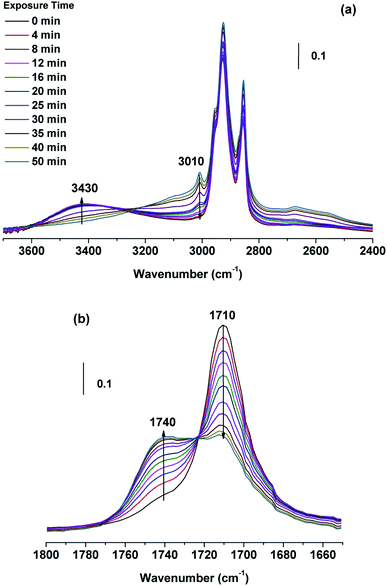 | ||
| Fig. 3 FTIR spectra of OA single droplets at different ozone exposure time during the reaction. Conditions: [O3] ∼ 10 ppm, room temperature, and RH ∼0%. The Y-axis stands for absorbance. | ||
The observed changes in morphology of the three organics single droplets as a function of the extent of oxidation were simultaneously monitored using the optical microscope of micro-FTIR during the reactions. Fig. S5 of ESI† shows the morphology evolution of OA, LA and LOA with the initial size of ∼100 μm. As 10 ppm ozone flow passes through the sample cell, oxidation progress gradually causes the single droplets to enlarged and highly irregular due to the flattening. This phenomenon is position correlation to double-bond number of organic acid.
3.2. Heterogeneous reaction kinetics
Based on above spectral analysis, two bands at 1710 and 1740 cm−1 are sensitive to ozone exposure, so they can be applied to derive reaction rate and uptake coefficient. The heterogeneous reaction kinetics of unsaturated organic acids with ozone have been discussed in great detail in recent FTIR studies, and the overall kinetics parameter can be determined according to the reactant and product function group of the reaction mechanism.12,21,22,37 For a given second order reaction: A + O3 → P, the rate equation is followed:
 | (1) |
 | (2) |
![[double bond, length as m-dash]](https://www.rsc.org/images/entities/char_e001.gif) O stretching bands and ester C
O stretching bands and ester C![[double bond, length as m-dash]](https://www.rsc.org/images/entities/char_e001.gif) O stretching bands can change exponentially with reaction time under the pseudo-first-order condition. Fig. 5 presents the absorbance profiles of C
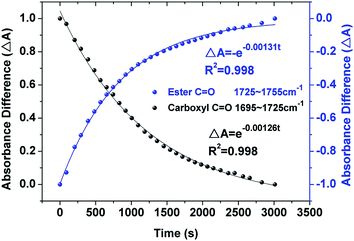
O stretching bands can change exponentially with reaction time under the pseudo-first-order condition. Fig. 5 presents the absorbance profiles of C![[double bond, length as m-dash]](https://www.rsc.org/images/entities/char_e001.gif) O bands (1710 and 1740 cm−1) dependent upon reaction times for OA droplet. The solid circles are absorbance values and solid lines are fitted by using the exponential curve-fitting function ΔA = (At − A∞)/(A0 − A∞) = e−kappt (using 1710 cm−1 band to fit reactant concentration changing with time) or ΔA = (At − A∞)/(A∞ − A0) = e−kappt (using 1740 cm−1 band to fit product concentration changing with time),12 where A0, A∞, At are the integrated area values of selected peak at initial, infinite, and time t of reaction. The last integrated value of the 1710 cm−1 or 1740 cm−1 peak is believed as the A∞.21,22,38 As shown in Fig. 5 and S6(a) and (b) of ESI,† the fitting correlation coefficients R2 are greater than 0.99. And the pseudo-first-order rate constants kapp derived from the reactant and the products are 1.26 × 10⁻³ s−1 and 1.31 × 10⁻³ s−1 for OA, 1.90 × 10⁻³ s−1 and 1.98 × 10⁻³ s−1 for LA, 2.04 × 10⁻³ s−1 and 2.10 × 10⁻³ s−1 for LOA, respectively. Such a good agreement demonstrates the pseudo-first-order condition again, and the overall kinetics parameter is suitable for the whole reaction process.39,40
O bands (1710 and 1740 cm−1) dependent upon reaction times for OA droplet. The solid circles are absorbance values and solid lines are fitted by using the exponential curve-fitting function ΔA = (At − A∞)/(A0 − A∞) = e−kappt (using 1710 cm−1 band to fit reactant concentration changing with time) or ΔA = (At − A∞)/(A∞ − A0) = e−kappt (using 1740 cm−1 band to fit product concentration changing with time),12 where A0, A∞, At are the integrated area values of selected peak at initial, infinite, and time t of reaction. The last integrated value of the 1710 cm−1 or 1740 cm−1 peak is believed as the A∞.21,22,38 As shown in Fig. 5 and S6(a) and (b) of ESI,† the fitting correlation coefficients R2 are greater than 0.99. And the pseudo-first-order rate constants kapp derived from the reactant and the products are 1.26 × 10⁻³ s−1 and 1.31 × 10⁻³ s−1 for OA, 1.90 × 10⁻³ s−1 and 1.98 × 10⁻³ s−1 for LA, 2.04 × 10⁻³ s−1 and 2.10 × 10⁻³ s−1 for LOA, respectively. Such a good agreement demonstrates the pseudo-first-order condition again, and the overall kinetics parameter is suitable for the whole reaction process.39,40
Oxygen is also a common oxidizing gas in atmosphere. Richaud et al.41 studied the oxidation kinetics of unsaturated fatty esters at temperatures ranging from 90 to 150 °C by using chemiluminescence. From oxidation mechanism, unsaturated fatty esters firstly initialized to form alkyl radical (R˙) and then oxygen consumed R˙ to form another radical (ROO˙). In present work, experiment temperature was 25 °C and initialization effect of fatty acids was very difficult. Moreover, under the existence of O3, the oxidation effect by O2 was strongly depressed. Tani et al.42 found that there was no clear observation of linoleic acid oxidation using the afterglow when the oxygen was involved in system. Therefore, ozonization is the major degradation pathway for unsaturated fatty acids under atmospheric conditions.
The efficiency of uptake of ozone by a particle can be described by the uptake coefficient, γ, which is the fraction of gas-particle collisions with the surface that results in loss.12,21,22,26,31,39 In general, γ is related to two limit uptake: chemical reaction and reactant diffusion.20,24,31,39,43 For this research, if the reactant diffusion is expected to be sufficiently fast that the rate-limiting process is the chemical reaction on the surface of single droplet. The overall uptake coefficient, γ, can be measured by the following equation:12,21,22,26,31,39,44
 | (3) |
In this expression, d[C]/dt = −kapp[C], and [C] is the initial concentration of the UFAs (molecule per cm3); N is the number of ozone molecules per unit gas volume (molecules per cm3); ![[c with combining macron]](https://www.rsc.org/images/entities/i_char_0063_0304.gif) is the mean speed of ozone molecules in gas phase (cm s−1); S/V is the surface area-to-volume ratio of the single droplets (cm−1).
is the mean speed of ozone molecules in gas phase (cm s−1); S/V is the surface area-to-volume ratio of the single droplets (cm−1).
In order to calibrate S/V of the single droplets, the contact angles (θ) of the three single droplets were detected by optical contact angle meter (FAT200, Dataphysics Inc, USA). The values of θ are 42.1°, 34.0°, 28.3° for OA, LA and LOA, respectively. For the present single droplet with 100 μm diameter, the S/V of the single droplets are 5.70 × 102 cm−1, 6.94 × 102 cm−1 and 7.35 × 102 cm−1 for OA, LA and LOA, respectively. According to the kapp derived from the carboxyl C![[double bond, length as m-dash]](https://www.rsc.org/images/entities/char_e001.gif) O reactant band at 1710 cm−1, the γ value for ozone uptake OA, LA and LOA droplets are (1.45 ± 0.11) × 10−3, (1.64 ± 0.13) × 10−3 and (1.87 ± 0.15) × 10−3, similar to the reported uptake coefficients which are listed in Table 1. The different sample geometries, experimental techniques, and influences of the oxidation products may cause the small deviation.27
O reactant band at 1710 cm−1, the γ value for ozone uptake OA, LA and LOA droplets are (1.45 ± 0.11) × 10−3, (1.64 ± 0.13) × 10−3 and (1.87 ± 0.15) × 10−3, similar to the reported uptake coefficients which are listed in Table 1. The different sample geometries, experimental techniques, and influences of the oxidation products may cause the small deviation.27
It has long been recognized that reactant diffusion is an important step for heterogeneous reaction of gas-phase species with the liquid or solid.31,39,43 In order to confirm the rate-limiting of O3/fatty acid single droplet, it is necessary to evaluate the importance of diffusion process of the single droplet for observed reaction kinetics on the reaction systems. Assuming that the fatty acid diffusion is the rate-limiting rate, the UFA diffusion constant (D) within the single droplet can be measured by the following equation:24,31,43
 | (4) |
In this expression, [C0] and [C] represent the concentration of the UFAs at initial and any reaction time, respectively (molecule per cm3). And r represents the radius of the single droplet (cm). And the decay absorbance profiles of C![[double bond, length as m-dash]](https://www.rsc.org/images/entities/char_e001.gif) O bands (1710 cm−1) dependent upon reaction times are shown in Fig. 5 and S6(a) and (b) of ESI.† According to the curving fitting results, the diffusion constants (D) for OA, LA and LOA are 2.58 × 10⁻⁹ cm2 s−1, 3.55 × 10⁻⁹ cm2 s−1 and 4.18 × 10⁻⁹ cm2 s−1, respectively.
O bands (1710 cm−1) dependent upon reaction times are shown in Fig. 5 and S6(a) and (b) of ESI.† According to the curving fitting results, the diffusion constants (D) for OA, LA and LOA are 2.58 × 10⁻⁹ cm2 s−1, 3.55 × 10⁻⁹ cm2 s−1 and 4.18 × 10⁻⁹ cm2 s−1, respectively.
The overall uptake coefficient, γd, can be estimated by the following equation:24,31,43
 | (5) |
According to the values of D derived from eqn (4), the values of γd are (5.56 ± 0.16) × 10−2, (7.66 ± 0.21) × 10−2 and (9.01 ± 0.26) × 10−2 for OA, LA and LOA, respectively, which are all more than an order of magnitude higher compared to the values of γ. That is to say, the chemical reaction of O3 with fatty acids droplet is the rate-limiting step.
The O3 reacto-diffusive length is estimated to be rather small in the organic acid, 5–20 nm,14,24 which is much smaller than the radius of the single droplet used in these experiments (50 μm). This indicates that the reaction occurs quite close to the surface, which consist with the previous study.27 Hearn, et al.24 believed that pure organic UFA droplets exhibit the “quasi-smectic” structure which appears more like an ordered solid than a disordered liquid at the gas-particle interface. This ordered structure increases the density of the double bonds at the surface of droplets, and reduces the rate of O3 diffusion into the bulk, resulting in a surface-dominated reaction of ozone with the double bonds of fatty acid.
3.3. Ozone concentration effects on kapp and γ
The ozone concentration can have an effect on the reaction rates of organic acid droplets. An insight into the ozone concentration effect on the reaction kinetics is conducive to our understanding of the fundamental mechanism of this heterogeneous reaction. The following equation gives the correlation between kapp and ozone concentration:5,22,45,46
 | (6) |
Fig. 6 gives the kapp and γ dependent upon the concentration of O3. As illustrated in Fig. 6(a), the pseudo-first-order rate constants increase monotonically with increasing ozone concentration. When the surface of the droplet is saturated at high gas-phase O3 concentration, the pace of the increase in the kapp values slows down and seemingly begins to plateau. This nonlinear behavior of kapp values as a function of ozone concentration is in fact consistent with the Langmiur–Hinshelwood model.45,46 Therefore, the gas-phase reactant (O3) must firstly adsorb to the surface according to a Langmuir isotherm before the reaction takes place.21,22,46,47 The Km values derived from the curve fitting of OA, LA and LOA are 0.01274 ± 0.0021 s−1, 0.02391 ± 0.0025 s−1 and 0.02548 ± 0.0015 s−1, respectively. They indicate that the more double bonds lead to the more efficient reaction due to the high reactivity for organic acids droplets.14,25,26 Since surface kinetics show high dependence on chemical and physical properties of the substrate, the KO3 for different systems change over several orders of magnitude at various substrates.45,48,49 In the present work, the KO3 values of OA, LA and LOA droplets are 0.05220 ± 0.0061, 0.03555 ± 0.0038 and 0.03498 ± 0.0057 cm3 per molecule, respectively, which are all the same order of magnitude to that reported previously in heterogeneous ozonolysis of oleic acid on ZnSe crystal.12
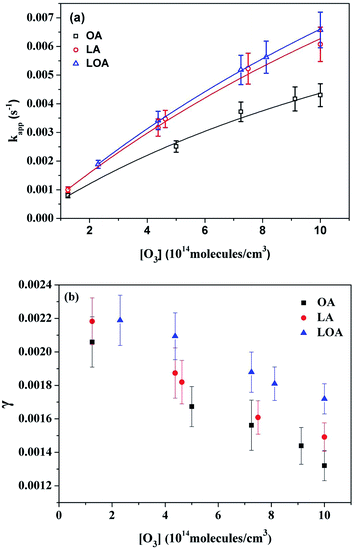 | ||
| Fig. 6 Plots of kapp (a) and γ (b) versus gas phase ozone concentration for the reaction of ozone with three UFAs at room temperature. The solid lines in (a) show non-linear fits of the data to the Langmiur–Hinshelwood model using eqn (6). | ||
The uptake coefficients γ vs. ozone concentrations are presented in Fig. 6(b). As the ozone concentrations increase from 1.25 × 10¹⁴ to 1.00 × 10¹⁵ molecule per cm3, γ values decrease from 2.06 × 10⁻³ to 1.32 × 10⁻³ for OA, from 2.18 × 10⁻³ to 1.47 × 10⁻³ for LA, from 2.18 × 10⁻³ to 1.73 × 10⁻³ for LOA. It is well known that γ means the ratio of reacted ozone molecular numbers to the total ozone molecular numbers of collisions. Since the heterogeneous reactions follow the Langmuir–Hinshelwood mechanism, more reactive surface sites will be covered by O3 molecular on the surface of a single droplet, till reach saturated. Then the O3-droplet collisions cannot cause reaction, so the values of γ decrease.
Combining the above analysis, it can be concluded that the reactions of ozone with organic acid droplets experience two progresses: firstly, ozone molecules adsorb onto the surface of droplets and reach equilibrium with gas phase quickly; and then the adsorbed ozone molecules react with the droplets on the surface at a slower rate.
3.4. Particle size effects on kapp and γ
To provide better insight into the variation of reaction kinetics as a function of single droplet size, the kapp and γ values versus single droplet diameter from 50 to 200 μm were determined under room temperature and dry conditions. As Fig. 7(a) shows, the values of kapp decrease monotonically with an increase in single droplet size, nevertheless, γ values increase slightly from the Fig. 7(b). Since the large droplet contains high concentration of reactive sites on the surface of the single droplet, as a result, the number of collisions leading to chemical reactions is more compared to the small droplet. Moreover, the total number of collisions which are on the droplet surface is decreased for the increasing diameter for the single droplets due to the lower surface area. Therefore, the uptake coefficients are all expected to increase with the increasing diameter for the single droplets. This changed trend demonstrates that the effect of surface adsorption can play an important role in the reaction,32,50 which is consistent with ozone concentration dependence data above.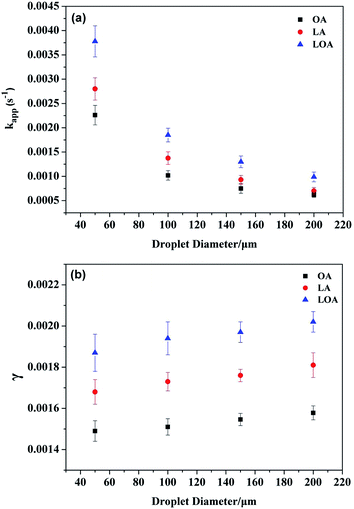 | ||
| Fig. 7 Plots of kapp (a) and γ (b) versus droplet diameter for the reaction of ozone with three UFAs. Conditions: [O3] ∼ 10 ppm and room temperature. | ||
3.5. RH effects on kapp and γ
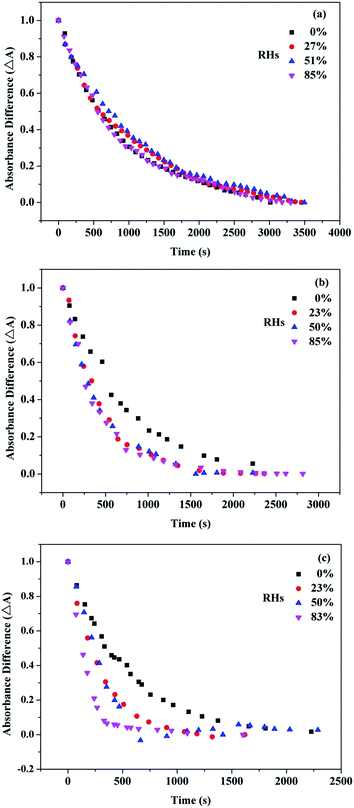
Water vapor in the air can influence the overall reaction kinetics for ozone adsorption onto the surface of the UFA droplets,22,51 therefore, it is necessary to detect the effect of RH on kinetic parameters. Fig. 8(a)–(c) show the exponential curve-fitting for the absorbance of 1710 cm−1 C![[double bond, length as m-dash]](https://www.rsc.org/images/entities/char_e001.gif) O stretching band at different RHs for three carboxylic acids. From the fitting data, the more double bonds lead to the grater RH dependence. Fig. 9(a) and (b) give kapp and γ values dependence upon the RH. It can be found that, there is a lack of RH dependence for OA/ozone reaction and only the weak RH dependence for LA/ozone reaction. However, both kapp and γ increased more than 3-fold as the RH increase from ∼0% to 83% for LOA/ozone reaction, indicating that water vapor can promote the heterogeneous reaction of ozone with LOA significantly.
O stretching band at different RHs for three carboxylic acids. From the fitting data, the more double bonds lead to the grater RH dependence. Fig. 9(a) and (b) give kapp and γ values dependence upon the RH. It can be found that, there is a lack of RH dependence for OA/ozone reaction and only the weak RH dependence for LA/ozone reaction. However, both kapp and γ increased more than 3-fold as the RH increase from ∼0% to 83% for LOA/ozone reaction, indicating that water vapor can promote the heterogeneous reaction of ozone with LOA significantly.
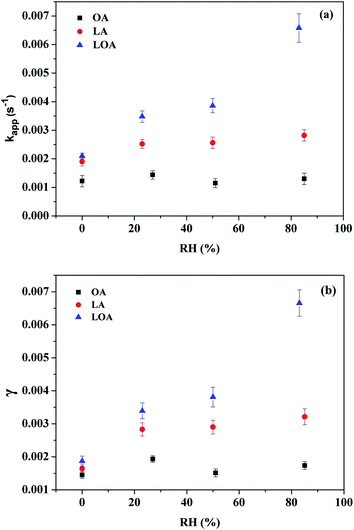 | ||
Fig. 9 The RH dependence of kapp (a) and γ (b) in the three UFAs/ozone reaction derived from the C![[double bond, length as m-dash]](https://www.rsc.org/images/entities/char_e001.gif) O band at 1710 cm−1. O band at 1710 cm−1. | ||
In order to make a clear understanding of the effect of RH on reaction kinetics, the hygroscopic properties of the three organics before and after reactions were measured. The integrated areas of OH vibration bands (2750–3600 cm−1) of the differential spectrum (the IR spectrum at different RHs minus that at dried state) are used to describe the water contents. The obtained results are shown in Fig. 10. The three organics exhibit tiny different hygroscopic properties before reactions. As the RH increases, the fatty acids become more sensitive from OA, LA to LOA. Goodman, et al.52 found that presence of double bonds in UFAs diminished the hydrophobicity of molecules, which can explain the observation of Fig. 10 well. In addition, the hygroscopicities of oxidized organic samples are all evidently enhanced. The water-content of the reacted product at ∼80% RH is about 3 to 6 times more than that the corresponding reactant. The increasing intensity of OH and ester groups (Fig. 3 and S2 of ESI†) indicates that oxidation of the mono-acid can produce more highly oxidized species. And this species which is α-acyloxyalkyl hydroperoxides can increase the water-absorbing ability of droplets.15 Moreover, the amount of water on oxidized LOA droplet at ∼80% RH is about 25% more than that on oxidized LA droplet, suggesting the more hygroscopic of oxidized LOA droplet than oxidized LA droplet. While, the amount of water on the oxidized LA droplet is about 3 times more than oxidized OA droplet at the same RH. Although the abilities of water uptake among oxidized UFAs are significantly different, the morphology changes of single droplet images as upon different RHs are not obvious (Fig. S7 of ESI†). The hygroscopicity change trend of the three oxidized UFAs indicates a good consistence with their kapp or γ values with the increasing RHs. When a UFA droplet begins to react with ozone in a humid condition, plenty of ozone molecules collide and absorb on the surface of single droplet. The reaction mechanisms show that the more double bonds can produce more polar intermediate and final products (containing lots of hydroxyl, hydroperoxyl, ester and carbonyl functional groups), which can dissolve in more adsorbing water as the reaction proceeds and thus become more mobile on/in the original organic phase of droplet surface at high RH. Moreover, the formation of surface solvated polar group can increase the solvent density at the interface,53 thus more ozone molecules can be trapped in the water layer of the droplet surface. And the residence time of ozone molecules can be extended at the surface of the droplets, which lead to a greater reaction probability at humid condition.
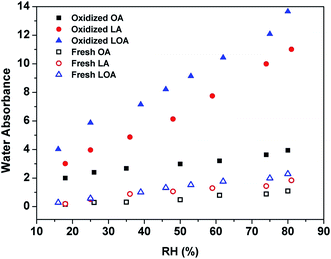 | ||
| Fig. 10 Changes in water absorbance based on the OH starching band in the 2750–3600 cm−1 region of fresh and oxidized UFAs at different RHs. | ||
3.6. Atmospheric implications
Atmospheric aerosols are complex and consist of many organic constituents. The chemical aging progress is one of the key issues in atmospheric environment. The finding that the unsaturated organic acids ozonolysis occurs predominantly at the surface of the droplet may also have significant implications for the reaction kinetics of organic particles. Moreover, the O3 reacto-diffusive length is estimated to be 5–20 nm on the surface of the organic acid.14,26 The organic fraction molecules of atmospheric particles sometimes form a film or liquid layer at the surface.54–56 The reactions of O3 with organic layer occur predominantly at the surface and simultaneously alter the reactivity of the gas-particle interface.The pseudo-first-order rate constant (kapp) are used to estimate the lifetime (τ) of organics according to the following equation:46
 | (7) |
Assuming that the heterogeneous reactions of ozone with OA, LA and LOA are the only degradation processes occurring in the atmosphere. The values of kapp for three reaction systems were calculated using eqn (2) at 10 ppm O3. For room temperature and dry conditions, the lifetime of OA, LA and LOA aerosols are determined to be 13.22, 8.77 min and 8.17 min, respectively. Taking into account the results from previous studies, when reacting with O3, Morris et al.57 also estimated a lifetime of a few minutes for pure oleic acid particles. And the methyl ester has a lifetime of ∼10 min when determined rate coefficient for the oxidation of D-methyl oleate at the air–water interface.58 In contrast to these reports, the lifetimes of another organics in the atmosphere have been shown to be several orders of magnitude longer. For example, the lifetimes of pure maleic and fumaric acid aerosols are 19 and 30 hours, respectively, under room temperature and dry conditions;45 The lifetime of particle-phase vinclozolin at 100 ppbv O3 is ∼4.3 hours.59 The short lifetime of the long-chain UFAs droplets is of atmospheric importance since these UFAs are more vulnerable to ozone, the removal of organic material from the atmospheric particles is extremely efficient as a result of this rapid atmospheric aging process. In addition, this rapid aging progress can substantially alter the surface tension and significantly change the optical and cloud nucleation properties of aqueous droplets in the atmosphere.58 Kinetics studies indicate that although the lifetimes of pure UFAs in the atmosphere would be on the order of tens of minutes, the lifetime can increase to tens of hours when the reaction occurs in a liquid/solid matrix and the atmospheric particles might be transported over large distances.60 Consequently, the ozonation process plays an important role in the degradation of OA, LA and LOA under the natural environmental conditions.
Furthermore, heterogeneous reaction products of ozone with UFAs are likely to be sources of ester and hydroxyl groups to the atmosphere. The highly oxygenated products of the organic layer are of hydrophilicity and low volatility, which are the key factors to be as CCN with higher growth factors in humid environments.20,24,27 The heterogeneous reaction kinetics show different dependences on RHs, which are related to the molecular structures of three organics and their oxidation products. The productions vary with the specific environmental conditions. If ozone oxidation occurs at the high RH, the product yield may be high for LOA oxidized products but may be low for OA oxidized products. Moreover, with the increasing oxygen-to-carbon ratio, the oxidized particles seem to facilitate water uptake, leading to serious haze weather from the aging progresses.
4. Conclusions
In this study, a gas-flow system combined with micro-FTIR spectrometer was utilized to study reaction kinetics of ozone initiated heterogeneous oxidation of micron-sized OA, LA and LOA single droplets. All the overall kinetics is dominated by surface reactions which is the one of the achievement of present work. In order to establish a mechanistic framework, the reaction kinetics versus ozone concentration, particle sizes and ambient RH were observed. The effect of surface adsorption can play an important role in the reaction which is derived from the ozone concentration effects and particle sizes on reaction kinetics. Moreover, more double bonds lead to more efficient reaction due to the high reactivity of organic acids droplets with ozone from the Km values of the Langmuir–Hinshelwood mechanism fittings. Increasing humidity is seen to accelerate the uptake process as the double bond numbers of the organic increase is the main highlight of this work. The kinetics of LA and LOA oxidization by ozone is found to be dependent on RH. And the kapp and the γ values increase more than 3-fold as the RH increased from ∼0% to 83% for LOA/O3 reaction. While, the kapp and the γ values of LA/O3 reaction are increased only by ∼2-fold which are weaker than LOA/O3 system as the same RH range. For the OA/O3 reaction, the kapp and the γ values exhibit a very weak RH dependence over the range of 0–85%. Additional water uptake studies suggest that the hygroscopicities of the organics are strongly dependent upon the chemical structures of acids. The UFAs with more C![[double bond, length as m-dash]](https://www.rsc.org/images/entities/char_e001.gif) C double bonds and their oxidized products present stronger hygroscopic property either by promoting the mobility of the original organic phase or by increasing the solubility and the residence time of ozone molecules at high RH, which enhance the reaction rate in turn.
C double bonds and their oxidized products present stronger hygroscopic property either by promoting the mobility of the original organic phase or by increasing the solubility and the residence time of ozone molecules at high RH, which enhance the reaction rate in turn.
Acknowledgements
This work was financially supported by the National Natural Science Foundation of China (91544223, 41175119, 21473009 and 21373026).References
- M. Kanakidou, J. H. Seinfeld, S. N. Pandis, I. Barnes, F. J. Dentener, M. C. Facchini, R. Van Dingenen, B. Ervens, A. Nenes, C. J. Nielsen, E. Swietlicki, J. P. Putaud, Y. Balkanski, S. Fuzzi, J. Horth, G. K. Moortgat, R. Winterhalter, C. E. L. Myhre, K. Tsigaridis, E. Vignati, E. G. Stephanou and J. Wilson, Atmos. Chem. Phys., 2005, 5, 1053–1123 CrossRef CAS.
- X. Zhang, R. H. Schwantes, M. M. Coggon, C. L. Loza, K. A. Schilling, R. C. Flagan and J. H. Seinfeld, Atmos. Chem. Phys., 2014, 14, 1733–1753 Search PubMed.
- H. M. Hung and P. Ariya, J. Phys. Chem. A, 2007, 111, 620–632 CrossRef CAS PubMed.
- Y. Rudich, N. M. Donahue and T. F. Mentel, Annu. Rev. Phys. Chem., 2007, 58, 321–352 CrossRef CAS PubMed.
- V. F. McNeill, R. L. N. Yatavelli, J. A. Thornton, C. B. Stipe and O. Landgrebe, Atmos. Chem. Phys., 2008, 8, 5465–5476 CrossRef CAS.
- B. T. Mmereki, D. J. Donaldson, J. B. Gilman, T. L. Eliason and V. Vaida, Atmos. Environ., 2004, 38, 6091–6103 CrossRef CAS.
- M. J. Molina, A. V. Ivanov, S. Trakhtenberg and L. T. Molina, Geophys. Res. Lett., 2004, 31, 359–393 Search PubMed.
- A. K. Bertram, A. V. Ivanov, M. Hunter, L. T. Molina and M. J. Molina, J. Phys. Chem. A, 2001, 105, 9415–9421 CrossRef CAS.
- L. R. Rinehart, E. M. Fujita, J. C. Chow, K. Magliano and B. Zielinska, Atmos. Environ., 2006, 40, 290–303 CrossRef CAS.
- K. Kawamura, Y. Ishimura and K. Yamazaki, Geochim. Cosmochim. Acta, 2003, 67, A208 Search PubMed.
- D. Fu, C. Leng, J. Kelley, G. Zeng, Y. Zhang and Y. Liu, Environ. Sci. Technol., 2013, 47, 10611–10618 CrossRef CAS PubMed.
- H. M. Hung, Y. Katrib and S. T. Martin, J. Phys. Chem. A, 2005, 109, 4517–4530 CrossRef CAS PubMed.
- Y. Katrib, G. Biskos, P. R. Buseck, P. Davidovits, J. T. Jayne, M. Mochida, M. E. Wise, D. R. Worsnop and S. T. Martin, J. Phys. Chem. A, 2005, 109, 10910–10919 CrossRef CAS PubMed.
- T. Moise and Y. Rudich, J. Phys. Chem. A, 2002, 106, 6469–6476 CrossRef CAS.
- A. Asad, B. T. Mmereki and D. J. Donaldson, Atmos. Chem. Phys., 2004, 4, 2083–2089 CrossRef CAS.
- A. E. Kerenkan, F. Beland and T. O. Do, Catal. Sci. Technol., 2016, 6, 971–987 Search PubMed.
- R. C. Chapleski, Y. F. Zhang, D. Troya and J. R. Morris, Chem. Soc. Rev., 2016, 45, 3731–3746 RSC.
- A. K. Y. Lee and C. K. Chan, J. Phys. Chem. A, 2007, 111, 6285–6295 CrossRef CAS PubMed.
- P. J. Ziemann, Faraday Discuss., 2005, 130, 469–490 RSC.
- J. Zahardis and G. A. Petrucci, Atmos. Chem. Phys., 2007, 7, 1237–1274 CrossRef CAS.
- G. Zeng, S. Holladay, D. Langlois, Y. Zhang and Y. Liu, J. Phys. Chem. A, 2013, 117, 1963–1974 CrossRef CAS PubMed.
- C. B. Leng, J. Hiltner, H. Pham, J. Kelley, M. Mach, Y. H. Zhang and Y. Liu, Phys. Chem. Chem. Phys., 2014, 16, 4350–4360 RSC.
- J. H. Slade, R. Thalman, J. Wang and D. A. Knopf, Atmos. Chem. Phys., 2015, 15, 10183–10201 CAS.
- J. D. Hearn, A. J. Lovett and G. D. Smith, Phys. Chem. Chem. Phys., 2005, 7, 501–511 RSC.
- T. Thornberry and J. P. D. Abbatt, Phys. Chem. Chem. Phys., 2004, 6, 84–93 RSC.
- J. D. Hearn and G. D. Smith, J. Phys. Chem. A, 2004, 108, 10019–10029 CrossRef CAS.
- H. M. Hung and C. W. Tang, J. Phys. Chem. A, 2010, 114, 13104–13112 CrossRef CAS PubMed.
- H. Zhang, J. D. Surratt, Y. H. Lin, J. Bapat and R. M. Kamens, Atmos. Chem. Phys., 2011, 11, 6411–6424 CAS.
- O. Vesna, M. Sax, M. Kalberer, A. Gaschen and M. Ammann, Atmos. Environ., 2009, 43, 3662–3669 CrossRef CAS.
- M. Mendez, N. Visez, S. Gosselin, V. Crenn, V. Riffault and D. Petitprez, J. Phys. Chem. A, 2014, 118, 9471–9481 CrossRef CAS PubMed.
- G. D. Smith, E. Woods, C. L. DeForest, T. Baer and R. E. Miller, J. Phys. Chem. A, 2002, 106, 8085–8095 CrossRef CAS.
- G. Zeng, Ph.D, Beijing Institute of Technology, 2015.
- A. I. Flossmann and W. Wobrock, Atmos. Res., 2010, 97, 478–497 CrossRef.
- C. Price, Nature, 2000, 406, 290–293 CrossRef CAS PubMed.
- E. J. Palen, D. T. Allen, S. N. Pandis, S. E. Paulson, J. H. Seinfeld and R. C. Flagan, Atmos. Environ., 1992, 26, 1239–1251 CrossRef.
- E. J. Palen, D. T. Allen, S. N. Pandis, S. Paulson, J. H. Seinfeld and R. C. Flagan, Atmos. Environ., 1993, 27, 1471–1477 CrossRef.
- M. Segal-Rosenheimer and Y. Dubowski, J. Phys. Chem. C, 2007, 111, 11682–11691 CAS.
- L. Petrick and Y. Dubowski, Indoor Air, 2009, 19, 381–391 CrossRef CAS PubMed.
- J. E. Roberts, G. Zeng, M. K. Maron, M. Mach, I. Dwebi and Y. Liu, J. Chem. Educ., 2016, 93, 733–737 CrossRef CAS.
- G. Zeng, S. Holladay, D. Langlois, Y. Zhang and Y. Liu, J. Phys. Chem. A, 2013, 117, 1963–1974 CrossRef CAS PubMed.
- E. Richaud, L. Audouin, B. Fayolle, J. Verdu, L. Matisova-Rychla and J. Rychly, Chem. Phys. Lipids, 2012, 165, 753–759 CrossRef CAS PubMed.
- A. Tani, S. Fukui, S. Ikawa and K. Kitano, J. Phys. D: Appl. Phys., 2015, 48, 424010 CrossRef.
- D. R. Worsnop, J. W. Morris, Q. Shi, P. Davidovits and C. E. Kolb, Geophys. Res. Lett., 2002, 29, 57-1–57-4 CrossRef.
- X. He, C. B. Leng and Y. H. Zhang, Spectrosc. Spectral Anal., 2016, 36, 1576–1580 CAS.
- J. J. Najera, C. J. Percival and A. B. Horn, Phys. Chem. Chem. Phys., 2009, 11, 9093–9103 RSC.
- J. Ma, Y. Liu and H. He, Atmos. Environ., 2010, 44, 4446–4453 CrossRef CAS.
- V. F. McNeill, G. M. Wolfe and J. A. Thornton, J. Phys. Chem. A, 2007, 111, 1073–1083 CrossRef CAS PubMed.
- N. O. A. Kwamena, M. G. Staikova, D. J. Donaldson, I. J. George and J. P. D. Abbatt, J. Phys. Chem. A, 2007, 111, 11050–11058 CrossRef CAS PubMed.
- T. F. Kahan, N. O. A. Kwamena and D. J. Donaldson, Atmos. Environ., 2006, 40, 3448–3459 CrossRef CAS.
- Y. Liu, J. P. Cain, H. Wang and A. Laskin, J. Phys. Chem. A, 2007, 111, 10026–10043 CrossRef CAS PubMed.
- D. Langlois, S. Holladay and G. Zeng, Abstracts of Papers of the American Chemical Society, 2013, p. 245 Search PubMed.
- A. L. Goodman, P. Li, C. R. Usher and V. H. Grassian, J. Phys. Chem. A, 2001, 105, 6109–6120 CrossRef CAS.
- M. Farnesi Camellone, F. Negreiros Ribeiro, L. Szabova, Y. Tateyama and S. Fabris, J. Am. Chem. Soc., 138, 11560–11567 CrossRef CAS PubMed.
- R. E. Peterson and B. J. Tyler, Appl. Surf. Sci., 2003, 203, 751–756 CrossRef.
- H. Tervahattu, K. Hartonen, V. M. Kerminen, K. Kupiainen, P. Aarnio, T. Koskentalo, A. F. Tuck and V. Vaida, J. Geophys. Res.: Atmos., 2002, 107, AAC 1-1–AAC 1-8 CrossRef.
- L. M. Russell, S. F. Maria and S. C. B. Myneni, Geophys. Res. Lett., 2002, 29, 26-1–26-4 CrossRef.
- J. W. Morris, P. Davidovits, J. T. Jayne, J. L. Jimenez, Q. Shi, C. E. Kolb, D. R. Worsnop, W. S. Barney and G. Cass, Geophys. Res. Lett., 2002, 29, 71-1–71-4 CrossRef.
- C. Pfrang, F. Sebastiani, C. O. M. Lucas, M. D. King, I. D. Hoare, D. Chang and R. A. Campbell, Phys. Chem. Chem. Phys., 2014, 16, 13220–13228 RSC.
- J. Gan, B. Yang, Y. Zhang, X. Shu, C. G. Liu and J. N. A. Shu, J. Phys. Chem. A, 2010, 114, 12231–12236 CrossRef CAS PubMed.
- P. J. Ziemann, Faraday Discuss., 2005, 130, 469 RSC.
Footnote |
| † Electronic supplementary information (ESI) available. See DOI: 10.1039/c6ra25255a |
| This journal is © The Royal Society of Chemistry 2017 |

