 Open Access Article
Electrical anisotropy and multidimensional pressure sensor of aligned Fe3O4@silver nanowire/polyaniline composite films under an extremely low magnetic field
Fang Fangac,
Yuan-Qing Lib,
Gui-Wen Huanga,
Hong-Mei Xiaoa,
Qing-Ping Fenga,
Ning Hub and
Shao-Yun Fu*ab
aTechnical Institute of Physics and Chemistry, Chinese Academy of Sciences, Beijing 100190, China. E-mail: syfu@mail.ipc.ac.cn; syfu@cqu.edu.cn
bCollege of Aerospace Engineering, Chongqing University, Chongqing 400044, China
cUniversity of Chinese Academy of Sciences, Beijing 100049, China
First published on 15th November 2016
Abstract
A low magnetic field is preferred in preparing aligned composites since a high magnetic field may be harmful to human health. In this study, fine-sized Fe3O4 nanoparticles with diameters of several nanometers are decorated on the surface of Ag-NWs (Fe3O4@Ag-NWs). Controllably aligned Fe3O4@Ag nanowire (Ag-NW)/polyaniline (PANI) composite films are then prepared under an extremely low magnetic field of 26–42 mT, which is much lower than those reported previously (0.1–10 T). As a result, the as-prepared Fe3O4@Ag-NW/PANI composite films show an excellent electrical conductivity from 5.5 × 10² to 4.1 × 10³ S cm−1 and a controllable electrical conductivity anisotropy from 1.1 to 6.7. Furthermore, the anisotropic responsive behavior of the Fe3O4@Ag-NW/PANI composite film makes it an ideal candidate for the fabrication of multidimensional pressure sensors. In most studies, conventional strain sensors are fabricated because they are only capable of detecting strains in one single direction due to a strongly coupled electrical conductance change. Finally, the fabrication of a multidimensional pressure sensor based on the as-prepared Fe3O4@Ag-NW/PANI composite film is demonstrated for the first time and a unique anisotropic pressure sensitivity is reported.
1. Introduction
Nowadays, one and two-dimensional nanomaterials, including silver nanowires (Ag-NWs),1,2 carbon nanotubes (CNTs),3,4 graphene,5,6 and graphene oxide (GO),7,8 have been extensively studied not only due to their superior electrical conductivities, but also their anisotropic nature. The anisotropic properties of these nanomaterials are strongly dependent on the structure of their assemblies. Various advanced functional materials such as transparent films,9,10 thermal conductive films,11,12 ion-exchange membranes13 and liquid-crystalline films,14 have been fabricated based on anisotropic nanostructures such as arrays, sheets and ropes. These anisotropic nanostructures were constructed via various methods, such as external electrical/magnetic field-assisted fabrication,3,7 chemical-vapor-deposition-grown method,12,15 self-assembly,8,16 electro-synthesis,17 mechanical shear4 like stretching,18 spinning19 and extrusion,20 thermal press21 and annealing.22 Among these, a magnetic field-assisted process is attractive due to its ease in controlling anisotropic nanostructures in the macro-range.23 Anisotropic nanomaterials such as CNTs,24,25 graphene oxides,7,8 boron nitride platelets,26 and Ag–Ni micro-particles27 have been successfully aligned by applying magnetic fields.Polymer nanocomposites that are lightweight and fabricated using simple techniques are highly attractive because their properties are tunable by controlling filler type and content. Recently, considerable attention has been paid to orientated anisotropic nanomaterial/polymer composites.16,26,28 Yousefi et al. prepared an aligned reduced GO (r-GO)/epoxy composite as a high performance electromagnetic interference shielding material.8 Wu et al. aligned GO in acryl monomers to yield reduced GO hybridized hydrogels that possess anisotropic electro-conductivity.7 Wang et al. transferred CNT arrays onto flexible epoxy composite films with excellent thermal conductivity along the thickness direction.12 Owing to their unique electrical, optical and thermal properties, oriented Ag-NWs demonstrate wide applications in microelectronic and29,30 optoelectronic devices31–33 and electromechanical systems.34 Liu et al. revealed that the effective field-effect mobility of the thin-film transistors can be enhanced with the incorporation of Ag-NW arrays.30 The anisotropy of the surface enhanced Raman scattering spectra of aligned Ag-NW films was reported by Zhou et al.32 In previous reports, most of the Ag-NWs were orientated with the assistance of templates.35–37 However, to the best of our knowledge, the alignment of Ag-NWs with a magnetic field assisted process has been rarely reported, particularly under a relatively low field strength. Most alignments require enormous field strengths, of the order of 0.1–10 T,7,29,38–40 which severely hinders their practical applications since high magnetic fields may be harmful to human health.
Polyaniline (PANI) has been well accepted as a matrix for preparing conducting polymer composites due to its ease of fabrication, low cost, etc. Herein, layer-structured PANI composite films with aligned Ag-NWs were prepared via a magnetic field-assisted casting method. To easily tailor the alignment of the Ag-NWs, Fe3O4 nanoparticles, used as magnetic carriers with excellent magnetic characteristics, were decorated on the surfaces of the Ag-NWs by a simple solvothermal method. The effects of magnetic field intensity, structure and filler content of the Fe3O4@Ag-NWs on the anisotropic behavior of the composite films were systematically evaluated. Finally, a strain sensor with significant anisotropic responsive behavior is demonstrated with the as-prepared Fe3O4@Ag-NW/PANI composite films as strain sensitive materials. It is well known that conventional strain sensors are only capable of detecting strains in one single direction because they usually show a strong coupled electrical conductance change in the principal strain direction and the perpendicular direction due to Poisson's ratio.41,42 The anisotropic responsive behavior of the Fe3O4@Ag-NW/PANI composite films make the decoupled electrical response possible, which is ideal for the fabrication of multidimensional strain sensors with applications in tactile skin, robotic control, etc.10,19,43,44
2. Experimental
2.1 Materials
Silver nitrate (AgNO3), poly(N-vinylpyrrolidone) (PVP, MW = ca. 50![[thin space (1/6-em)]](https://www.rsc.org/images/entities/char_2009.gif) 000), ethylene glycol (EG), hexahydrated ferric chloride (FeCl3·6H2O), ferrous sulfate (FeSO4·7H2O), sodium hydroxide (NaOH), aniline, ammonium persulfate (APS), HCl, n-butanol, NH3·H2O, N-methyl-2-pyrrolidone (NMP), polydimethylsiloxane (PDMS), acetone and ethanol were all of analytical grade and purchased from Lan Yi Co. Ltd, Beijing, China. Except that aniline was further treated with vacuum distillation, all chemicals were used as received.
000), ethylene glycol (EG), hexahydrated ferric chloride (FeCl3·6H2O), ferrous sulfate (FeSO4·7H2O), sodium hydroxide (NaOH), aniline, ammonium persulfate (APS), HCl, n-butanol, NH3·H2O, N-methyl-2-pyrrolidone (NMP), polydimethylsiloxane (PDMS), acetone and ethanol were all of analytical grade and purchased from Lan Yi Co. Ltd, Beijing, China. Except that aniline was further treated with vacuum distillation, all chemicals were used as received.
2.2 Preparation of Ag-NWs and Fe3O4@Ag-NWs
Ag-NWs were prepared via a solvothermal method.1 In a typical route, 16.65 g PVP was thoroughly dissolved in a 200 ml EG solution of FeCl3 (0.01 mM). Then, the well-mixed solution was dripped into a 200 ml EG solution of AgNO3 (0.1 M) under continuous stirring. The obtained mixture was sealed in a 500 ml Teflon-lined stainless steel autoclave and allowed to react for 3 h at 160 °C to form Ag-NWs. The as-synthesized Ag-NWs were washed with acetone and ethanol, sequentially. Finally, the Ag-NWs were re-dispersed in EG for further use.Fe3O4@Ag-NWs were synthesized via a similar solvothermal method described as follows: 0.07 g of FeCl3·6H2O and 0.036 g of FeSO4·7H2O were dissolved in 43 ml of EG at 50 °C. Afterward, 30 ml of EG dispersed with 0.3 g of Ag-NWs was added into the obtained solution. The mixture was stirred for 20 min at 65 °C, and then 5 ml of a EG solution dissolved with 0.1 g NaOH was added dropwise. After stirring for 20 min, the suspension was transferred into a Teflon-lined stainless steel autoclave and heated at 200 °C for 4 h. The products obtained were washed with ethanol several times. In this process, EG plays a critical role as a reductant and solvent, simultaneously. Based on the feeding ratio of the Fe3+/Fe2+ ions, the concentration of reactant mixtures were controlled from 0.90 to 0.18 g l−1 for FeCl3 and from 0.46 to 0.09 g l−1 for FeCl2. When the weight ratio of Fe3O4 to Ag-NWs is changed from 0.02 to 0.04, 0.06, 0.08, and 0.1, the Fe3O4@Ag-NW is hereafter referred to as FA0.02, FA0.04, FA0.06, FA0.08 and FA0.1, respectively.
2.3 Preparation of anisotropic Fe3O4@Ag-NW/PANI conductive films
PANI, a typical linear conducting polymer45 with low cost and high anti-corrosion property,2,46 was prepared by oxidative polymerization of aniline.46 A specific example was given as follows: 20 ml of freshly distilled aniline monomer was dispersed in an HCl solution (2.7 mol l−1, 100 ml) and APS (2.2 mol l−1, 50 ml) was then slowly added dropwise under vigorous stirring. The polymerization was carried out at 0–5 °C under stirring for 24 h. The prepared emeraldine salt form of PANI was washed with deionized water several times. To convert the emeraldine salt form of PANI into the base form, the prepared PANI was dispersed in 100 ml of ammonium hydroxide (28%) and kept stirring for 24 h and then washed with deionized water and ethanol several times. A PANI solution was prepared by dissolving 0.4 g of PANI powder in 40 ml of NMP, and the insoluble residues were removed by centrifugation.The composite films of Fe3O4@Ag-NW/PANI were prepared using a two-step casting method reported in our previous report.47 It is depicted as follows: Fe3O4@Ag-NWs dispersed in n-butanol (10 mg ml−1) with a calculated volume was dropped onto a glass substrate with a tunable magnetic field. After n-butanol was evaporated completely, 2.5 ml of a PANI solution was dropped onto the surface of the Fe3O4@Ag-NW layer and then NMP was removed with an infrared light. The resultant Fe3O4@Ag-NW/PANI composite film was peeled off of the glass substrate for further measurements.
2.4 Testing methods
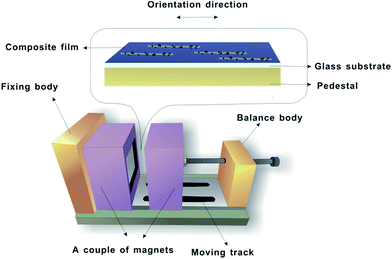
The morphologies of the Fe3O4@Ag-NWs and Fe3O4@Ag-NW/PANI composite films were examined using a scanning electron microscope (SEM, Hitachi S-4300, Japan). The morphology of the Fe3O4@Ag-NWs was also observed with a transmission electron microscope (TEM, JEM2100, Japan). Nano Measurer Software was used to estimate the average diameter and length of the nanomaterials. Magnetic hysteresis curves of Fe3O4@Ag-NWs were measured using a vibrating sample magnetometer (VSM, Lakeshore7307, USA). X-ray diffraction (XRD) of the composite film was performed on an X-ray diffractometer (D8 focus) with Cu Kα radiation (λ = 0.154 nm) with 2θ values from 10° to 90°. Surface analysis of the Fe3O4@Ag-NWs was performed using X-ray photoelectron spectroscopy (XPS, ESCALAB 250Xi, Thermo Fisher) under 300 W Al Kα radiation. Fourier transform infrared (FT-IR) spectra were recorded with a Bruker Tensor 27 spectrometer using the attenuated total reflection technique. The electrical conductivities of the Fe3O4@Ag-NWs and composite films were measured with a Keithley Source Meter 2400 by a standard four-probe method, and average results were obtained from at least three samples. The Fe3O4@Ag-NWs in the form of pressed laminates (20 MPa of applied stress) with a thickness of 75 μm were used for the electrical conductivity test. Tensile tests were performed on an Instron 5882 with a loading speed of 1 mm min−1. The dimensions of the specimens were 10 × 60 mm2, and at least four specimens for each formulation were measured. As displayed in Fig. 1, the intensity of the magnetic field was controlled by adjusting the distance between the two magnets. A Teslameter (SG-3-A, Beijing Zhuo Sheng Jia Co. Ltd.) was used to measure the magnetic field strength. The composite film was sealed with 20 g of PDMS to examine its tactile sensing behavior with copper wires adhered onto the composite film as electrodes.3. Results and discussion
3.1 Morphology and characteristics
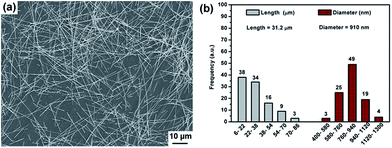
As shown in Fig. 2, the as-synthesized Ag-NWs have a typical wire like structure. The average diameter and length of the pristine Ag-NWs are 910 nm and 31.2 μm, respectively, which is measured based on 100 nanowires. The microstructure of the Ag-NWs decorated with fine-sized Fe3O4 with a diameter of a few nm is presented in Fig. 3. It can be seen that the Fe3O4 nanoparticles were randomly distributed on the surface of the Ag-NWs as patches of aggregated clusters. In addition, the size of the Fe3O4 clusters on the surface of the Ag-NWs increased with an increasing amount of iron salt, indicating that the structure of the Fe3O4@Ag-NWs is tunable by controlling the volume of reacting agents added.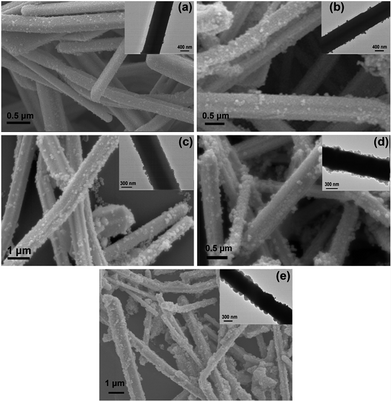 | ||
| Fig. 3 SEM images of Fe3O4@Ag-NWs for (a) FA0.02, (b) FA0.04, (c) FA0.06, (d) FA0.08 and (e) FA0.1; insets are the corresponding TEM images. | ||
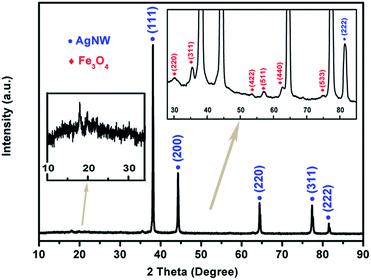
To analyze the crystal structure, the XRD pattern of the as-synthesized Fe3O4@Ag-NW/PANI composite film is presented in Fig. 4. The broad peak at 19.85° is attributed to the periodicities parallel to the amorphous polymer chain.48 The diffraction peaks at 38.1°, 44.3°, 64.4°, 77.4° and 81.5° correspond to the (111), (200), (220), (311) and (222) planes, respectively, of the Ag-NWs. The reflection peaks appearing at 30.1°, 35.5°, 53.6°, 57.1°, 62.7° and 74.9° are indexed to the (220), (311), (422), (511), (440) and (533) planes of Fe3O4, respectively, which confirms the formation of Fe3O4 nanoparticles. Furthermore, the lattice spacing “d” for the (311) plane was calculated using the Bragg equation and is about 2.53 Å, which matches well with the standard value of 2.532 Å.26
XPS was performed to examine the chemical composition of the prepared Fe3O4@Ag-NWs (Fig. 5). In Fig. 5b, two peaks with binding energies of 710.8 and 724.3 eV, corresponding to Fe 2p3/2 and Fe 2p1/2 respectively,49 are seen, without a satellite peak situated at 719 eV, which is a major characteristic of γ-Fe2O3. In the O core level spectrum (Fig. 5c), the main peak at 530.2 eV is attributed to the oxygen atoms in Fe3O4. The binding energy values at 368.2 eV and 374.2 eV for Ag 3d3/2 and Ag 3d5/2, respectively, are observed in Fig. 5d.50 These results validate the successful formation of Fe3O4@Ag-NWs.
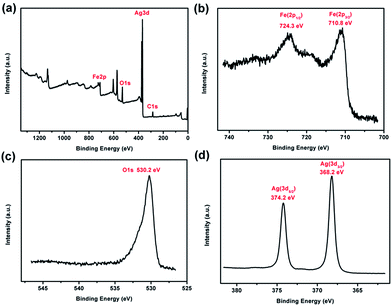 | ||
| Fig. 5 (a) XPS survey spectrum, (b) Fe 2p, (c) O 1s and (d) Ag 3d high resolution spectra of the FA0.1. | ||
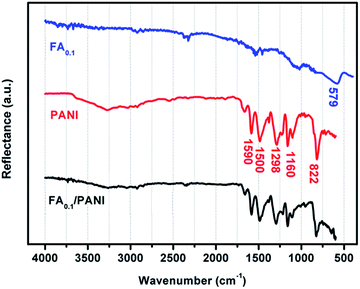
FT-IR spectra of Fe3O4@Ag-NWs, pure PANI films and Fe3O4@Ag-NW/PANI composite films are shown in Fig. 6. The peak at ∼579 cm−1 in Fe3O4@Ag-NWs is attributed to the Fe–O bond vibration of Fe3O4. The spectrum of PANI shows the presence of quinoid and benzenoid ring stretching modes at 1590 cm−1 and 1500 cm−1, respectively, indicating the emeraldine base form of PANI. The C–H plane-bending vibrations (1160 cm−1) and C–H out-of-plane bending vibrations (822 cm−1) of the PANI structure are also observed.51 For the Fe3O4@Ag-NW/PANI composite film, the PANI characteristic peaks are well preserved, but the Fe–O vibration peak is invisible since the intensity of the PANI characteristic peaks is too strong.
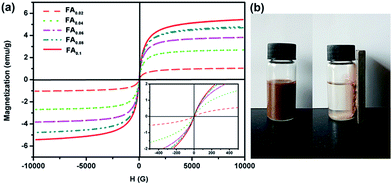
The magnetic properties of the Fe3O4 decorated Ag-NWs were investigated using a vibrating sample magnetometer at room temperature, as shown in Fig. 7a. The saturation magnetization (Ms) values of the as-synthesized Fe3O4@Ag-NWs depend on the content of the decorated magnetic particles. The Ms values for FA0.02, FA0.04, FA0.06, FA0.08 and FA0.1 are 1.04, 2.70, 3.82, 4.70 and 5.44 emu g−1, respectively. Fig. 7b shows that FA0.02 dispersed in ethanol can be magnetically separated from ethanol.
3.2 Electrical conductivity anisotropy of the Fe3O4@Ag-NW/PANI composite film
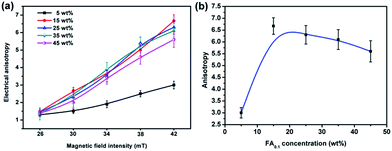
The Fe3O4@Ag-NWs in PANI composite films were aligned by the magnetic field, which resulted in the anisotropy of the Fe3O4@Ag-NW/PANI composite films. The electrical anisotropy is defined as the ratio of σ∥ to σ⊥, where σ∥ and σ⊥ are the electrical conductivities of the composite film in the direction “parallel to the alignment direction of the Fe3O4@Ag-NWs” (abbreviated as NW∥) and “perpendicular to the alignment direction of the Fe3O4@Ag-NWs” (abbreviated as NW⊥), respectively. The formation of aligned Ag-NW conductive paths promotes electron transfer along the direction of NW∥ with more straight paths. As for the direction of NW⊥, although the transverse Ag-NW to Ag-NW contact is still possible, there are more discontinuous and separated conductive paths for electrons to travel.The electrical conductivities of the FA0.1/PANI composite films prepared under different magnetic fields are shown in Fig. 8. The anisotropy of the composite film significantly increases with an increase in filler content from 5 to 15 wt%, and then a slight drop in the anisotropy is seen on further increasing the filler content to 45 wt%, which relates with the conductive paths formed in the directions of NW∥ and NW⊥. With an increase in the content of FA0.1 from 0 to 15 wt%, the composite films show a better connected conductive path in the direction of NW∥ than that in the direction of NW⊥. However, when the filler content further increases from 15 to 45 wt%, the conductive paths simultaneously grow in both directions, such that the anisotropy of the film is degenerated. In addition, the anisotropy of the as-composite films monotonically rises with an increase in the magnetic field intensity applied at the process of film preparation, and a maximum anisotropy of 6.7 is achieved for the composite film with 15 wt% FA0.1 at a magnetic field strength of 42 mT (Fig. 8b). Nonetheless, on further increasing the applied magnetic field intensity to 46 mT, the as-prepared composite film tends to be brittle and easy to split along the direction of NW∥, owing to the stress concentration of the magnetic fillers with a large amount. Hence the magnetic field intensity of 42 mT is chosen to fabricate the optimum composite films, which is much lower than that reported to be required in other studies.7,24–26,40
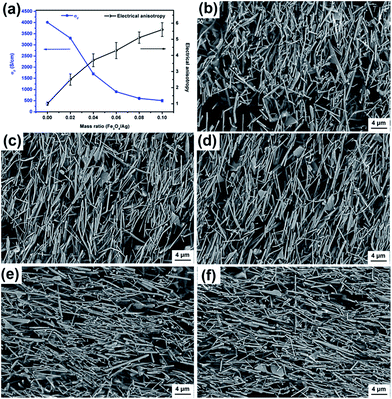
The influence of Fe3O4 to the Ag-NWs mass ratio (RFe/Ag) on the anisotropy and conductivity of the composite film was studied. The decoration of Fe3O4 on the surface of Ag-NWs results in a decrease of its electrical conductivity. As shown in Fig. 9a, σ∥ of the composite film declines from 4.1 × 10³ to 5.5 × 10² S cm−1 with the increase of RFe/Ag from 0.02 to 0.1. At the same time, the anisotropy of the composite films rises with an increase in RFe/Ag. As revealed in Fig. 9b–f, the arranging order of the Fe3O4@Ag-NWs in the composite films shows an ascending trend, corresponding to the increase in the saturation magnetization values of the occupied composite filler (from FA0.02 to FA0.1). In addition, the intersection point of σ∥ with anisotropy in Fig. 9a, with an RFe/Ag value of 0.034, indicates the best tradeoff between the electrical conductivity and anisotropy of the corresponding composite film. Thus, FA0.034 and FA0.034/PANI composite films were prepared for the following study.
Anisotropic electrical conductivities have been observed in aligned films, meshes, and nanopapers fabricated by different methods. The comparison of electrical anisotropy in the present study with literature4,8,9,18,19,24,25,39,52–58 is presented in Table 1. It is clear that the electrical anisotropy and electrical conductivity have an inverse relationship. All of composites that reported a high electrical anisotropy show a low conductivity in aligned direction. Although the electrical anisotropy of Fe3O4@Ag-NW/PANI composite films, reported herein, is not the highest, its electrical conductivity is the highest for the composites with the same level of anisotropy. Importantly, a trade-off between the high anisotropy and high electrical conductivity is achieved in this study.
| Composites | Method | Electrical anisotropy | Conductivity in aligned direction | Filler content | Ref. |
|---|---|---|---|---|---|
| CNT/polystyrene | CVD + in situ polymerization | 20 | 0.8 S cm−1 | 20 wt% | 52 |
| CNT/poly(p-phenylene ethynylene)s | Self-assembly | 4.1 | 9.2 × 10⁻³ S cm−1 | — | 53 |
| CNT/polysulfone | Electric field assisted | 105 | 10−4 S cm−1 | 0.2 wt% | 54 |
| PANI/montmorillonite | In situ polymerization + pressure | 1016 | 8.4 × 10⁻² S cm−1 | — | 55 |
| CNT/polyacrylonitrile | Magnetic field assisted electrospinning | 15.4 | 3.2 × 10⁹ Ω □−1 | 2 wt% | 39 |
| CNT/poly(methyl methacrylate) (PMMA) | Mechanical stretching | 104 | 10−4 S cm−1 | 1 wt% | 56 |
| CNT/PMMA | Electric field assisted thermal annealing | 106 | 1.13 × 10⁻⁴ S cm−1 | 1 wt% | 57 |
| CNT/natural rubber-nitrile rubber | Milling | 103 | 3.16 × 10⁻⁶ S cm−1 | 4 wt% | 58 |
| γ-Fe2O3-CNT/polythylene oxide | Magnetic field induced | 10 | 4 × 10⁻⁶ S cm−1 | 3 wt% | 25 |
| γ-Fe2O3-CNT/epoxy | Magnetic field induced | 4.1 | 4.1 × 10⁻⁹ S cm−1 | 1 wt% | 24 |
| Graphene nanoribbon & CNT/polyimide | Electrospinning | 1.15 × 10⁶ | 8.3 × 10⁻⁴ S cm−1 | 9 wt% | 19 |
| Graphite/polyacetylene | Mechanical stretching + thermal treatment | 1.1–1.3 | 1501 S cm−1 | 61–74 wt% | 18 |
| r-GO/epoxy | Self-alignment | 5 × 10⁶ | 10−2 S cm−1 | 3 wt% | 8 |
| CNT buckypaper | Shearing | ∼2 | 600 S cm−1 | — | 4 |
| Ag–Ni-NWs | Magnetic field induced | 105 | 220 Ω □−1 | — | 9 |
| Fe3O4@Ag-NW/PANI | Magnetic field induced | 6.7 | 187 S cm−1 | 15 wt% | Present study |
In order to determine the percolation threshold, the electrical conductivity of the Fe3O4@Ag-NW/PANI composite films is fitted to a power law. According to the percolation theory, the following equation can be presented:24
| σ ∝ (v − vc)t | (1) |
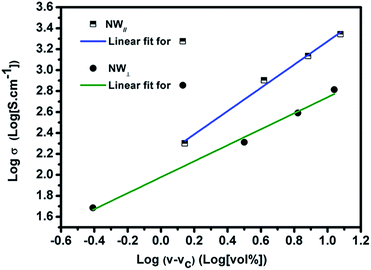 | ||
| Fig. 10 Percolation equation fit to the experimental conductivity data obtained in the direction of NW∥ and NW⊥, with regression coefficients of 0.99. | ||
3.3 Mechanical properties of the Fe3O4@Ag-NW/PANI composite film
Fig. 11 shows the typical tensile strain–stress curves of the composite films stretched along the direction of NW∥ and NW⊥, respectively. Along the direction of NW∥, the film has a tensile strength and an elongation at break of 69 MPa and 2.64%, respectively. In comparison, the tensile strength and elongation at break in the direction of NW⊥ is 60 MPa and 2.21%, respectively, which is relatively smaller than that in the direction of NW∥. As expected, the composite films with aligned Fe3O4@Ag-NWs show anisotropic mechanical properties. Similar results were also found in the aligned CNT/PMMA system.56,57,59 It is believed that the embedding of CNTs is supposed to introduce defects into the polymer matrix, and the defects tend to form cracks along the CNT direction, resulting in the deterioration of the mechanical property perpendicular to the CNT aligning direction.56,59 It seems that this explanation is also plausible in this study. As shown in Fig. 12, wire-like folds appear in parallel on the top surface of the PANI composite film, which is believed to be caused by the alignment of the Ag-NWs. Both the orientated folds in the matrix and aligned Ag-NWs together are supposed to account for the anisotropic mechanical behaviour of the composite films.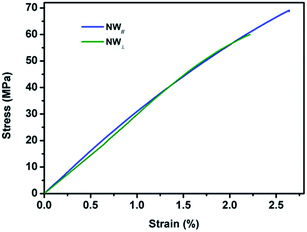 | ||
| Fig. 11 Tensile stress–strain curves of the 13 wt% composite film stretched along the direction of NW∥ and NW⊥, respectively. | ||
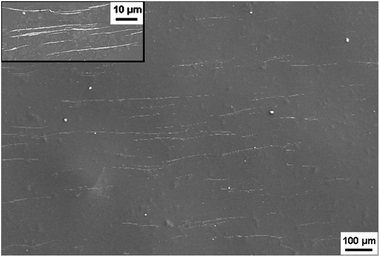 | ||
| Fig. 12 SEM image of the top surface of Fe3O4@Ag-NW/PANI composite film, the inset is a high magnification SEM image. | ||
3.4 Fe3O4@Ag-NW/PANI composite film as tactile sensor
To demonstrate the potential application of the Fe3O4@Ag-NW/PANI composite films, a strain sensor based on the PDMS sealed composite film was fabricated, which is mechanically robust with tactile sensibility. Fig. 13 presents the PDMS-sealed-composite film sensor for the cyclic pressing-releasing test, which shows three copper wires coming out of the sensor for resistance measurements in different directions: 1–3 for parallel direction, 2–3 for perpendicular direction.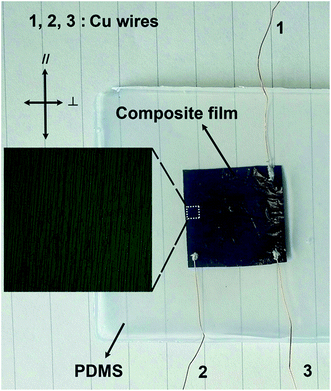 | ||
| Fig. 13 PDMS-sealed composite film for tactile sensing. The inset shows the magnified aligned Ag-NWs under the optical microscope. | ||
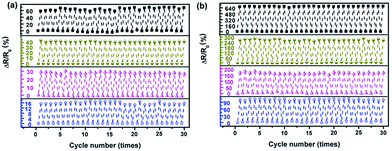
The electrical resistances of the sensor in the direction of NW∥ and NW⊥ under repeated pressuring-releasing cycles were measured. Relative changes of the resistance (RCR, ΔR/R0) of the sensor under cyclic loading-unloading with different maximum pressures are presented in Fig. 14. In both directions, the sensor shows good responses to the applied cyclic loading.
The RCR responses of the sensor exhibit excellent stability within the tested cycles, without any significant resistance drifting. In addition, with an increase in the maximum pressure from 30 kPa to 90 kPa, the RCR peak values of the sensor in the direction of NW∥ and NW⊥ increase from 16% to 65% and 100% to 680%, respectively. The RCR responses of the sensor are consistent and reversible within the pressure range studied, demonstrating that the composite film can work properly up to a pressure of 90 kPa.
Importantly, the RCR of the sensor in the NW⊥ direction is 6 to 10 times higher than that in the direction of NW∥ due to the anisotropy of the composite film. Because the conventional strain sensor has a strong coupled electrical resistance change in the principal strain direction and in the perpendicular direction, they are only capable of detecting strain in a single direction. This hinders their application to detect more complex multiaxial, multidimensional strain conditions.41,42 The decoupled electrical resistance change to the major axis of the principal strain and perpendicular direction can be independently detected by assembling two Fe3O4@Ag-NW/PANI films intersecting each other.41 The anisotropic responsive behavior of the Fe3O4@Ag-NW/PANI composite films makes it ideal for the fabrication of a multidimensional strain sensor for applications in tactile skin, robotic control, etc.
4. Conclusions
Layer structured PANI composite films with aligned Ag-NWs have been fabricated under an extremely low magnetic field of 26–42 mT. To control the alignment, Fe3O4 nanoparticles as magnetic responders are decorated on the surfaces of the Ag-NWs. The effects of magnetic-field intensity, Fe3O4@Ag-NW filler content and Fe3O4/Ag-NW ratio on the anisotropy of the composite films are clarified. Between the NW∥ and NW⊥ directions, the difference in the electrical conductivity of the composite films is in the range of 15–91%. For the composite film with 13 wt% Fe3O4@Ag-NWs (the Fe3O4/Ag-NWs ratio is 0.034), there is an 87% difference in tensile strength and an 84% difference in elongation at break. Finally, an anisotropic multidimensional pressure sensor is demonstrated based on the Fe3O4@Ag-NW/PANI composite film, which exhibits a unique anisotropic pressure responsive behavior. The relative resistance change of the as-prepared sensor in the direction of NW⊥ is 6 to 10 times higher than that in the direction of NW∥.Acknowledgements
This study is financially supported by the National Natural Science Foundation of China (No. 11372312 and 11572321).Notes and references
- Y. H. Ji, Y. Liu, G. W. Huang, X. J. Shen, H. M. Xiao and S. Y. Fu, ACS Appl. Mater. Interfaces, 2015, 7, 8041–8052 CAS.
- G. W. Huang, H. M. Xiao and S. Y. Fu, ACS Nano, 2015, 9, 3234–3242 CrossRef CAS PubMed.
- R. J. Castellano, C. Akin, G. Giraldo, S. Kim, F. Fornasiero and J. W. Shan, J. Appl. Phys., 2015, 117, 214306 CrossRef.
- D. Vennerberg and M. R. Kessler, Carbon, 2014, 80, 433–439 CrossRef CAS.
- Z. Xu, Y. Zhang, P. G. Li and C. Gao, ACS Nano, 2012, 6, 7103–7113 CrossRef CAS PubMed.
- L. Ding, L. P. Liu, P. G. Li, F. Z. Lv, W. S. Tong and Y. H. Zhang, J. Appl. Polym. Sci., 2016, 133, 43041 Search PubMed.
- L. L. Wu, M. Ohtani, M. Takata, A. Saeki, S. Seki, Y. Ishida and T. Aida, ACS Nano, 2014, 8, 4640–4649 CrossRef CAS PubMed.
- N. Yousefi, X. Y. Sun, X. Y. Lin, X. Shen, J. J. Jia, B. Zhang, B. Z. Tang, M. S. Chan and J.-K. Kim, Adv. Mater., 2014, 26, 5480–5487 CrossRef CAS PubMed.
- B.-T. Liu, S. X. Huang, M. F. Lai and Z. H. Wei, RSC Adv., 2015, 5, 1684–1689 RSC.
- K. Liu, Y. H. Sun, P. Liu, X. Y. Lin, S. S. Fan and K. L. Jiang, Adv. Funct. Mater., 2011, 21, 2721–2728 CrossRef CAS.
- H. Jung, S. Yu, N.-S. Bae, S. M. Cho, R. H. Kim, S. H. Cho, I. Hwang, B. Jeong, J. S. Ryu, J. Hwang, S. M. Hong, C. M. Koo and C. Park, ACS Appl. Mater. Interfaces, 2015, 7, 15256–15262 CAS.
- M. Wang, H. Y. Chen, W. Lin, Z. Li, Q. Li, M. H. Chen, F. C. Meng, Y. J. Xing, Y. G. Yao, C. P. Wong and Q. W. Li, ACS Appl. Mater. Interfaces, 2014, 6, 539–544 CAS.
- N. V. Loza, S. A. Loza, N. A. Kononenko and A. V. Magalyanov, Pet. Chem., 2015, 55, 724–729 CrossRef CAS.
- R. Schaller, T. Peijs and T. A. Tervoort, Composites, Part A, 2016, 81, 296–304 CrossRef CAS.
- X. Liu, X. Y. Sun, Z. Y. Wang, X. Shen, Y. Wu and J.-K. Kim, ACS Appl. Mater. Interfaces, 2015, 7, 21455–21464 CAS.
- R. O. Mäkiniemi, P. Das, D. Hönders, K. Grygiel, D. Cordella, C. Detrembleur, J. Y. Yuan and A. Walther, ACS Appl. Mater. Interfaces, 2015, 7, 15681–15685 Search PubMed.
- B. Endrodi, G. F. Samu, D. Fejes, Z. Nemeth, E. Horvath, A. Pisoni, P. K. Matus, K. Hernadi, C. Visy, L. Forro and C. Janaky, J. Polym. Sci., Part B: Polym. Phys., 2015, 53, 1507–1518 CrossRef CAS.
- S. Matsushita and K. Akagi, J. Am. Chem. Soc., 2015, 137, 9077–9087 CrossRef CAS PubMed.
- M. K. Liu, Y. F. Du, Y.-E. Miao, Q. W. Ding, S. X. He, W. W. Tjiu, J. S. Pan and T. X. Liu, Nanoscale, 2015, 7, 1037–1046 RSC.
- M. Antunes, M. Mudarra and J. I. Velasco, Carbon, 2011, 49, 708–717 CrossRef CAS.
- P.-M. Geffroy, T. Chartier and J.-F. Silvain, J. Eur. Ceram. Soc., 2007, 27, 291–299 CrossRef CAS.
- Z. Qiang, Y. Z. Zhang, Y. Wang, S. M. Bhaway, K. A. Cavicchi and B. D. Vogt, Carbon, 2015, 82, 51–59 CrossRef CAS.
- A. Malvandi, J. Magn. Magn. Mater., 2016, 406, 95–102 CrossRef CAS.
- I. T. Kim, A. Tannenbaum and R. Tannenbaum, Carbon, 2011, 49, 54–61 CrossRef CAS PubMed.
- I. T. Kim, J. H. Lee, M. L. Shofner, K. Jacob and R. Tannenbaum, Polymer, 2012, 53, 2402–2411 CrossRef CAS.
- H. S. Lim, J. W. Oh, S. Y. Kim, M.-J. Yoo, S.-D. Park and W. S. Lee, Chem. Mater., 2013, 25, 3315–3319 CrossRef CAS.
- T. Lu, J. Wissman, Ruthika and C. Majidi, ACS Appl. Mater. Interfaces, 2015, 7, 26923–26929 CAS.
- S. Gong, Z. H. Zhu and S. A. Meguid, Polymer, 2015, 56, 498–506 CrossRef CAS.
- O. Trotsenko, A. Tokarev, A. Gruzd, T. Enright and S. Minko, Nanoscale, 2015, 7, 7155–7161 RSC.
- H. C. Liu, Y. C. Lai, C.-C. Lai, B. S. Wu, H.-W. Zan, P. Yu, Y.-L. Chueh and C.-C. Tsai, ACS Appl. Mater. Interfaces, 2015, 7, 232–240 CAS.
- G. Chu, X. S. Wang, T. R. Chen, J. X. Gao, F. Y. Gai, Y. Wang and Y. Xu, ACS Appl. Mater. Interfaces, 2015, 7, 11863–11870 CAS.
- W. P. Zhou, A. M. Hu, S. Bai, Y. Ma and D. Bridges, RSC Adv., 2015, 5, 39103–39109 RSC.
- B. Park, I.-G. Bae and Y. H. Huh, Sci. Rep., 2016, 6, 19485 CrossRef CAS PubMed.
- F. Xu and Y. Zhu, Adv. Mater., 2012, 24, 5117–5122 CrossRef CAS PubMed.
- X. C. Yang, X. Zou, Y. Liu, X. N. Li and J. W. Hou, Mater. Lett., 2010, 64, 1451–1454 CrossRef CAS.
- Z. Ye, F. Guang Tao, C. Ping, W. Bing, W. Biao and Z. Li De, Nanotechnology, 2008, 19, 285711 CrossRef PubMed.
- G. Riveros, S. Green, A. Cortes, H. Gómez, R. E. Marotti and E. A. Dalchiele, Nanotechnology, 2006, 17, 561 CrossRef CAS.
- J. A. Marins, A. Mija, J.-M. Pin, F. Giulieri, B. G. Soares, N. Sbirrazzuoli, P. Lançon and G. Bossis, Compos. Sci. Technol., 2015, 112, 34–41 CrossRef CAS.
- L.-Y. Mei, P. Song and Y.-Q. Liu, J. Appl. Polym. Sci., 2015, 132, 41995 CrossRef.
- Z. H. I. Sun, X. Guo, M. Guo, J. Vleugels, O. Van der Biest and B. Blanpain, J. Alloys Compd., 2013, 551, 568–577 CrossRef CAS.
- K. K. Kim, S. Hong, H. M. Cho, J. Lee, Y. D. Suh, J. Ham and S. H. Ko, Nano Lett., 2015, 15, 5240–5247 CrossRef CAS PubMed.
- S.-H. Bae, Y. Lee, B. K. Sharma, H.-J. Lee, J.-H. Kim and J.-H. Ahn, Carbon, 2013, 51, 236–242 CrossRef CAS.
- O. Gennari, S. Grilli, S. Coppola, V. Pagliarulo, V. Vespini, G. Coppola, S. Bhowmick, M. A. Gioffré, G. Gentile, V. Ambrogi, P. Cerruti, C. Carfagna and P. Ferraro, Langmuir, 2013, 29, 15503–15510 CrossRef CAS PubMed.
- H. Dana and C. Nikolaus, Bioinspiration Biomimetics, 2015, 10, 055002 CrossRef PubMed.
- Y. Yan, J. Fang, Y. J. Zhang, H. L. Fan and Z. X. Wei, Macromol. Rapid Commun., 2011, 32, 1640–1644 CrossRef CAS PubMed.
- H. M. Xiao, W. D. Zhang, C. Lv, S. Y. Fu, M. X. Wan and Y. W. Mai, Macromol. Chem. Phys., 2010, 211, 1109–1116 CrossRef CAS.
- F. Fang, Y. Q. Li, H. M. Xiao, N. Hu and S. Y. Fu, J. Mater. Chem. C, 2016, 4, 4193–4203 RSC.
- M. Faisal and S. Khasim, J. Mater. Sci.: Mater. Electron., 2013, 24, 2202–2210 CrossRef CAS.
- N. Li, G. W. Huang, X. J. Shen, H. M. Xiao and S. Y. Fu, J. Mater. Chem. C, 2013, 1, 4879–4884 RSC.
- N. Li, G. W. Huang, H. M. Xiao and S. Y. Fu, Composites, Part A, 2015, 77, 87–95 CrossRef CAS.
- A. Khan, A. Aslam Parwaz Khan, A. M. Asiri, M. Abdul Rub and N. Azum, Polym. Compos., 2014, 35, 1436–1443 CrossRef CAS.
- K. K. K. Koziol, S. Boncel, M. S. P. Shaffer and A. H. Windle, Compos. Sci. Technol., 2011, 71, 1606–1611 CrossRef CAS.
- N. Adachi, T. Fukawa, Y. Tatewaki, H. Shirai and M. Kimura, Macromol. Rapid Commun., 2008, 29, 1877–1881 CrossRef CAS.
- A. I. Oliva-Avilés, F. Avilés, V. Sosa, A. I. Oliva and F. Gamboa, Nanotechnology, 2012, 23, 465710 CrossRef PubMed.
- J. Tokarský, L. Kulhánková, V. Stýskala, K. Mamulová Kutláková, L. Neuwirthová, V. Matějka and P. Čapková, Appl. Clay Sci., 2013, 80–81, 126–132 CrossRef.
- J. F. Dai, Q. Wang, W. X. Li, Z. Q. Wei and G. J. Xu, Mater. Lett., 2007, 61, 27–29 CrossRef CAS.
- L. Valentini, S. B. Bon and J. M. Kenny, Macromol. Mater. Eng., 2008, 293, 867–871 CrossRef CAS.
- P. Kueseng, P. Sae-oui, C. Sirisinha, K. I. Jacob and N. Rattanasom, Polym. Test., 2013, 32, 1229–1236 CrossRef CAS.
- W. X. Li, Q. Wang and J. F. Dai, Bull. Mater. Sci., 2006, 29, 313–316 CrossRef CAS.
| This journal is © The Royal Society of Chemistry 2017 |

