
 Open Access Article
 This Open Access Article is licensed under a
 Creative Commons Attribution 3.0 Unported Licence
Theoretical and experimental study of the antifreeze protein AFP752, trehalose and dimethyl sulfoxide cryoprotection mechanism: correlation with cryopreserved cell viability†
Irena Kratochvílová*a,
Martin Golanaf,
Karel Pomeisla,
Jan Richtera,
Silvia Sedláková a,
Jakub Šeberaa,
Júlia Mičováag,
Martin Falkb,
Iva Falkováb,
David Řehach,
K. Wade Elliottd,
Krisztina Vargad,
Shelby E. Follette and
Daniel Šimeka
a,
Jakub Šeberaa,
Júlia Mičováag,
Martin Falkb,
Iva Falkováb,
David Řehach,
K. Wade Elliottd,
Krisztina Vargad,
Shelby E. Follette and
Daniel Šimeka
aInstitute of Physics, Academy of Sciences of the Czech Republic, v.v.i., Na Slovance 2, CZ-182 21, Prague 8, Czech Republic. E-mail: krat@fzu.cz
bInstitute of Biophysics, Academy of Sciences of the Czech Republic, v.v.i., Kralovopolska 135, CZ-612 65 Brno, Czech Republic
cInstitute of Microbiology, Academy of Sciences of the Czech Republic, v.v.i., Zámek 136, CZ-373 33 Nové Hrady, Czech Republic
dDeparment of Molecular, Cellular, and Biomedical Sciences, University of New Hampshire, 46 College Road, Durham, NH 03824, USA
eDepartment of Chemistry, University of Wyoming, 1000 E. University Ave, Laramie, WY 82071, USA
fFaculty of Mathematics and Physics, Charles University in Prague, Ke Karlovu 5, CZ-121 16 Prague 2, Czech Republic
gInstitute of Chemistry, Slovak Academy of Sciences, Dubravska cesta 9, 845 38 Bratislava 4, Slovak Republic
hFaculty of Sciences, University of South Bohemia in Ceske Budejovice, Zamek 136, 373 33 Nove Hrady, Czech Republic
First published on 23rd December 2016
Abstract
In this work the physico-chemical properties of selected cryoprotectants (antifreeze protein TrxA-AFP752, trehalose and dimethyl sulfoxide) were correlated with their impact on the constitution of ice and influence on frozen/thawed cell viability. The freezing processes and states of investigated materials solutions were described and explained from a fundamental point of view using ab initio modelling (molecular dynamics, DFT), Raman spectroscopy, differential scanning calorimetry and X-ray diffraction. For the first time, in this work we correlated the microscopic view (modelling) with the description of the frozen solution states and put these results in the context of human skin fibroblast viability after freezing and thawing. DMSO and AFP had different impacts on their solution's freezing process but in both cases the ice crystallinity size was considerably reduced. DMSO and AFP treatment in different ways improved the viability of frozen/thawed cells.
1. Introduction
Effective cryopreservation is an important practical problem not only in medicine, but also in the pharmaceutical and food industries. A major drawback of cryopreservation is that ice crystallization during the freezing process can significantly damage the cells which then lose viability after thawing.1–4 The freezing process is very complex, and the behaviour of water in both its liquid and frozen states is strongly affected by added substances.2–4In the presence of cryoprotectants, cells can be recovered from temperatures at almost two hundred degrees below the freezing point of water due to application of specific materials – cryoprotectants. Cryoprotectants affect many processes which take place outside and inside frozen and thawed cells at various levels.1–4 Recent studies have addressed cell survival after cryopreservation but have not correlated the effectiveness of cryoprotection with the freezing mechanism. In this work we focused on frozen/thawed cell protection induced by altering the freezing/thawing conditions and processes resulting namely in different sizes of frozen solution ice crystals.5–10
From thermodynamic point of view there are two classes of substances that can modify the water freezing. Compounds from the first class (dimethyl sulfoxide, trehalose) affect the thermodynamics of the freezing process. Materials from the second category (antifreeze proteins) block ice formation based on the kinetic factors.1–3
In this work we explored the difference in ice crystal formation and cells viability when different cryoprotectants were applied. We examined properties of frozen/thawed dimethyl sulfoxide (DMSO), trehalose, the antifreeze protein TrxA-ApAFP752 (AFP) and DMSO + trehalose solutions both experimentally and theoretically using X-ray diffraction (XRD), Raman spectroscopy, differential scanning calorimetry (DSC), molecular dynamics and ab initio modelling.4,11–29 For the first time, in this work we correlated the microscopic view (modelling) with the description of the frozen solution states (XRD, Raman spectroscopy, DSC)27 and put these results in the context of human skin fibroblasts viability after freezing and thawing.28,29 Correlating cell viability and the influence of cryoprotectants on the ice constitution, we identified important characteristics of materials that induce cell cryoprotection. Results of this interdisciplinary theoretical and experimental work lead to deeper understanding of the complex freezing/thawing processes, which will contribute to the rational design of cryofunctional materials.30
2. Materials and methods
2.1 Cryoprotectant solutions, cells processing
Cryoprotection experiments in live cells were performed on certified normal human skin fibroblasts (NHDF) obtained from CLS Cell Line Service GmbH (Eppelheim, Germany). Cells were grown at 37 °C in humidified atmosphere with 5% CO2 in DMEM medium (PAN Biotech, Aidenbach, Germany, cat. no.: P03-0710) supplemented with 10% foetal calf serum (FCS; PAA Laboratories GmbH, Pasching, Austria) and standard antibiotics (1% penicillin + streptomycin; stock solution mixture 10![[thin space (1/6-em)]](https://www.rsc.org/images/entities/char_2009.gif) 000 U mL−1 penicillin + 10 mg mL−1 streptomycin; PAN Biotech, cat. no.: P06-07100). The cells obtained (at passage 2) were multiplied and frozen, and the “young” passages 5 and 6 used for experiments to prevent possible accumulation of chromosomal aberrations and mutations and their potential effects on results.
000 U mL−1 penicillin + 10 mg mL−1 streptomycin; PAN Biotech, cat. no.: P06-07100). The cells obtained (at passage 2) were multiplied and frozen, and the “young” passages 5 and 6 used for experiments to prevent possible accumulation of chromosomal aberrations and mutations and their potential effects on results.
Flow cytometry was used to quantify survival and apoptosis in cells that were frozen with or without cryoprotectants. The Muse® Cell Analyser (Merck Millipore) and Muse® Annexin V & Dead Cell Assay Kit (MCH100105, Millipore), which can discriminate between live, early apoptotic, late apoptotic/necrotic and dead cells, were used according to Hofer et al.25 To allow the cells to enter apoptosis, flow cytometry measurements were performed 24 h after the cryoprotectant treatment (in the case of non-frozen cells) or after thawing (in the case of frozen cells).
Cells were frozen by cooling to −80 °C using a gradient of −1 °C min−1 in standard medium (untreated cells). Cryoprotectant treated cells were incubated prior to cooling (to −80 °C using a gradient of −1 °C min−1) in standard medium containing either trehalose for 24 h, in DMSO for 2 min or in AFP for 2 h (Table 1). Details of expression and purification of recombinant TrxA-ApAFP752 (AFP) fusion protein are in the ESI section.†
| Sample | Composition |
|---|---|
| DMSO | DMSO 10% (w/w) in DMEM (cell culture) medium |
| DMSO + trehalose | DMSO 10% (w/w) + 100 mM trehalose 3.2% (w/w) in DMEM (cell culture) medium |
| AFP | 0.5 mg mL−1 in DMEM (cell culture) medium |
| Trehalose | 3.2% (w/w) (100 mM trehalose in DMEM (cell culture) medium |
For XRD and Raman spectroscopy experiments, aqueous solutions of DMSO and trehalose or DMSO and trehalose PBS solutions containing 50 mM sodium phosphate and 50 mM NaCl in DI water at pH 8.0 (phosphate buffered saline, PBS) were used – Table 2. We also measured the fusion TrxA-ApAFP752 antifreeze protein: 6.85 μM TrxA-ApAFP752 with PBS dissolved in DI water (AFP solution). The D-(+)-trehalose dihydrate and the dimethyl sulfoxide (DMSO) were purchased from Sigma-Aldrich. Deionized water for preparation of solutions was purified by Milli Q Plus system (Millipore), having a resistivity 18.2 MΩ cm (25 °C).
| Sample | Composition |
|---|---|
| DMSO solution/DMSO PBS solution | DMSO 10% (w/w) in DI water/PBS |
| DMSO + trehalose solution/DMSO + trehalose PBS solution | DMSO 10% (w/w) + 100 mM trehalose 3.2% (w/w) in DI water/PBS |
| AFP solution | 0.05–1% (w/w) TrxA-ApAFP752, phosphate + NaCl in DI water, molar concentration of TrxA-ApAFP752: (71.34 μM TrxA-ApAFP752 in 50 mM NaxHyPO4 buffer containing 50 mM NaCl) |
| Trehalose solution/trehalose PBS solution | 3.2–41% (w/w) trehalose in DI water/PBS |
2.2 X-ray diffraction
The X-ray diffraction (XRD) measurements were performed using a DCS 350 dome-type temperature chamber from Anton-Paar mounted on a Bruker D8 horizontal diffractometer equipped with a 12 kW copper rotating-anode. Each liquid specimen was inserted in an aluminium cuvette, covered with 5 μm Mylar foil and sealed by tightening a steel ring over the foil. The incident beam was collimated using a Goebel mirror with a divergence of around 0.02° in the horizontal direction and around 4° in the vertical direction. For all specimens, ω–χ mapping was performed using the 110 reflection of hexagonal ice. The detector was kept at a 2θ angle of 39.85°, leading to an effective integration angle of ±0.15° in 2θ. The angle of incidence (horizontal tilt) varied from 5° to 35° (by 0.02° steps), and the vertical inclination was varied from −4° to +16° (by 2° steps). The whole map covers a solid angle of 0.12 sr. Since the two nearest (110) crystallographic planes are inclined 60°, none of the diffracting crystals can be recorded twice in the range of the map, and the probability of any randomly-oriented ice crystal being recorded in the map trough of one of its six equivalent {110} planes is about 5.8%. The quality of the statistics was thus affected by the number of observed crystallites, and it should be kept in mind that they represent only 1/17 of the entire statistical ensemble. Each map was acquired over 90 min at a constant temperature.Concerning the size of the ice crystals in frozen solutions, we performed a specimen-to-specimen relative comparison using the diffraction intensity distribution.31,32
Based on the assumption that the angular profile of the intensity of diffracting crystal is normal (Gaussian), we can deconvolute the diffracting volume distribution from the distribution of levels of equal intensity to the expected number of peaks that created such a distribution. The theoretical distribution of levels of equal intensity for non-overlapping Gaussian peaks with the same peak intensity is a step-function on a logarithmical x-scale (i.e., equal to one below the peak intensity value and zero above it if only a single crystal size was observed), which was shown using a simulation of a hundred random Gaussian peaks with a maximum intensity of 3 × 10⁵ cps and random noise of 1000 cps. The deconvolution represents decomposing the observed intensity histograms into a set of such step-functions, which represent the distribution of peak intensities. The simulated data proceeding through this deconvolution procedure exhibit the maximum distribution at the expected peak intensity level, being smeared by the effect of peak overlapping and added noise (the distribution therefore does not show only a single peak). The same procedure was applied on the experimental data to estimate the volume distribution of diffracting ice crystals.31
2.3 Theoretical modelling
In order to investigate the antifreeze activity of the selected cryoprotectants (DMSO, trehalose and ApAFP752) in aqueous solution, molecular dynamics simulations were performed using the GROMACS 4.5.5 software package13 and the AMBER99SB-ILDN force field.14 All molecular dynamics simulations were performed in explicit SPC/E water and under periodic boundary conditions. Long-range electrostatic interactions were calculated using the particle mesh Ewald method.15 The Berendsen thermostat was used in all simulations with a thermostat relaxation time of 0.1 ps at both room temperature (27 °C) and low temperature (−8 °C). After energy minimization and an equilibration phase of 100 ps, a production run of 10 ns was performed for each simulated system. The trehalose and DMSO residues, for which the parameters were not available in the Amber99SB-ILDN force field, were parameterized using the standard RESP procedure with charges derived from an HF/6-31G* calculation.16 In order to evaluate the strength of the interactions between individual components, the interaction energies between water molecules, DMSO molecules, trehalose molecules, trehalose/water molecules and DMSO/water molecules were also calculated. The 3D structure of ApAFP752 protein is not known, and we therefore used the 3D-JIGSAW (version 2.0) – online structure prediction program.17 The 3D geometry of ApAFP752 protein was created on the basis of homology modelling using a known 3D structure of Tenebrio molitor AFP named TmAFP (PDB ID: 1EZG),18 which has a 69% sequence homology to the ApAFP752 protein. The model refinement was performed using the YASARA program.19 Hydrogens were added automatically in GROMACS except for one amino acid (histidine), where the correct orientations and protonation patterns were derived from the chemical environment and the hydrogen bonding capabilities using an algorithm embedded in YASARA that is based on optimization of hydrogen bond networks combined with pKa estimation. The initial geometry of trehalose was derived on the basis of the crystal structure prepared and measured by H. Nagase et al.20 The crystal structure of trehalose was gradient optimized by the DFT method using B3LYP-D3/6-31G*. The molecular dynamics simulations were done for the following cases: (i) one trehalose sugar in a cubic simulation box with 500 water molecules, (ii) 56 DMSO molecules in a cubic simulation box with 2000 water molecules, (iii) four trehalose sugars and 56 DMSO molecules in a cubic simulation box with 2000 water molecules, (iv) ApAFP752 protein and two Cl− ions were covered by a water layer (9043 molecules) in a cubic simulation box. The concentration of trehalose, DMSO, and mixture of trehalose and DMSO correspond to our experimental concentrations.Hydrogen bonding facilitates cryoprotectant–water and water–water interactions in solution, and the dynamics and H-bonding characterize the freezing process of the cryoprotective solutions. The analysis of this behaviour includes the study of the hydrogen bond lifetime. The geometrical criterion that determines the existence of a hydrogen bond is specified as r ≤ rHB 0.35 nm and α ≤ αHB = 30°, where rHB indicates the maximum distance between a donor and acceptor pair for a hydrogen bond within the maximum angle of 30°. The lifetime of the hydrogen bond is calculated from the H-bond time autocorrelation function of the existence criterion.
 | (1) |
 | (2) |
In order to estimate the interaction potential between individual molecules included in our study we computed the interaction energy ΔEint (BSSE) with inclusion of the basis set superposition error (BSSE) using the following equation:
| ΔEint (BSSE) = Edimer − (Emonomer1 + Emonomer2) + EBSSE | (3) |
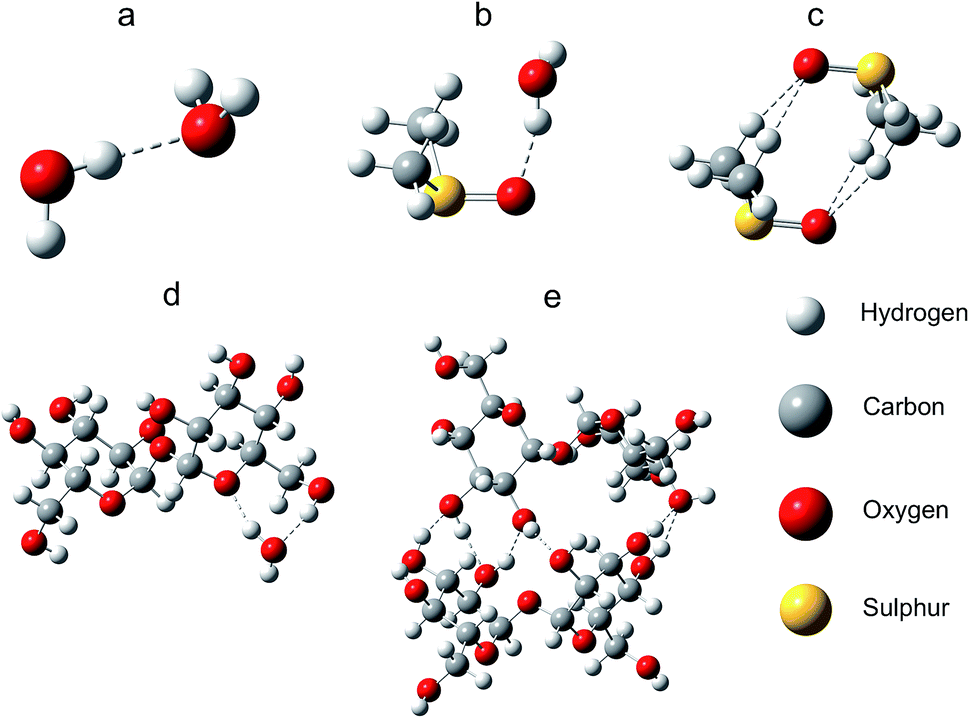 | ||
| Fig. 1 The geometry-optimized structures. (a) Water dimer, (b) DMSO/water system, (c) DMSO dimer, (d) trehalose/water system, (e) trehalose dimer. Dashed lines indicate intermolecular noncovalent interactions. | ||
2.4 Raman spectroscopy
Raman spectra can reveal chemical and phase composition of the sample as well as interactions of its constituents.28 Specifically, they can be used for detection of a irregularity of the ice lattice and so-called eutectic phase. Euthetic phase is a shared crystal lattice formed by constituents mixed in a fixed ratio.27–29All data was acquired by a Renishaw RM1000 spectrometer equipped with a Leica DMLP microscope with a Leica PL FLUOTAR L 50×/0.55 objective. The excitation wavelength was 488 nm. The temperature during the course of the data acquisition was controlled by a Linkam LNP95 cooling stage. The stage operates with 0.01 °C precision and can reach temperatures as low as −196 °C.
Samples (50 μL) were held on the stage in PerkinElmer aluminium pans. After freezing, the samples became almost opaque, data was therefore collected from a surface layer of estimated thickness around 5 μm. The spectra were normalized at 3165 cm−1.
For each sample, multiple spectra were measured. The spectra shown are those that exhibit all the observed spectral features of a given specimen and are thus characteristic of it.
2.5 Differential scanning calorimetry
Calorimetry, which is a universal method for investigating transition processes associated with the generation or consumption of heat, was used to evaluate the transformation temperatures (melting Tm, T1) of the aqueous solutions of DMSO, trehalose disaccharide, and TrxA-ApAFP752.3 Differential scanning calorimetry was performed in a Linkam optical differential scanning calorimeter DSC600 (single cell) system equipped with the LNP95 cooling system; this can reach temperatures as low as −196 °C. The experimental procedure for all investigated samples consisted of two rounds of calorimetric measurements performed in the cooling/heating mode at the same rates starting with the liquid sample at room temperature. The first round involved monitoring of the initial reversible transformation behaviour and determination of the freezing temperature, Tf, and the melting temperature, Tm. The cooling rate was −5 °C per minute down to −80 °C; stabilization for 5 minutes; then heating back to room temperature. The second round involved cycling between the Tf and Tm temperatures at a rate of 1 °C per minute with 10 minutes of stabilization. Cycling all of the measurements at one rate produced practically the same results (±1 °C shift).3. Results
3.1 Cryopreserved cells viability
Using flow cytometry, we first checked whether the application of cryoprotectants and their combinations affected cell viability (Table 3). Next, we measured cell viability for cells after freeze/thaw experiments (Fig. 2). Without cryoprotectants, almost all frozen cells died after being thawed; only <7.5% survived 24 h post-thawing. The highest cryoprotective effect was brought about by DMSO (>80% survival 24 h post-thawing), especially when it was combined with trehalose (trehalose for 24 h followed by DMSO for 2 min); in that case, about 85% of cells survived 24 h after thawing. The improvement of cell viability by trehalose only (24 h-incubation) was also relatively large: 58.5% of cells survived 24 h after thawing. However, the cryoprotective effect of trehalose strongly depended on the incubation time and was only observable for incubations ≥24 h (4 h and 6 h incubations had no effect). AFP10 exerted the smallest effect among the cryoprotectants studied with only 32.3% cell survival. Based on these results, we hypothesize that trehalose during 24 h of incubation enters the cells via pinocytosis. Small DMSO penetration and accumulation both in the cell cytoplasm and the nucleus was confirmed by Jinping Dong and colleagues.28| Cryoprotectant | Cell viability of unfrozen cells [%] (24 hours after incubation) |
|---|---|
| Control | 89.8 |
| AFP | 63.3 |
| Trehalose | 67.8 |
| DMSO | 76.1 |
| DMSO + trehalose | 68.7 |
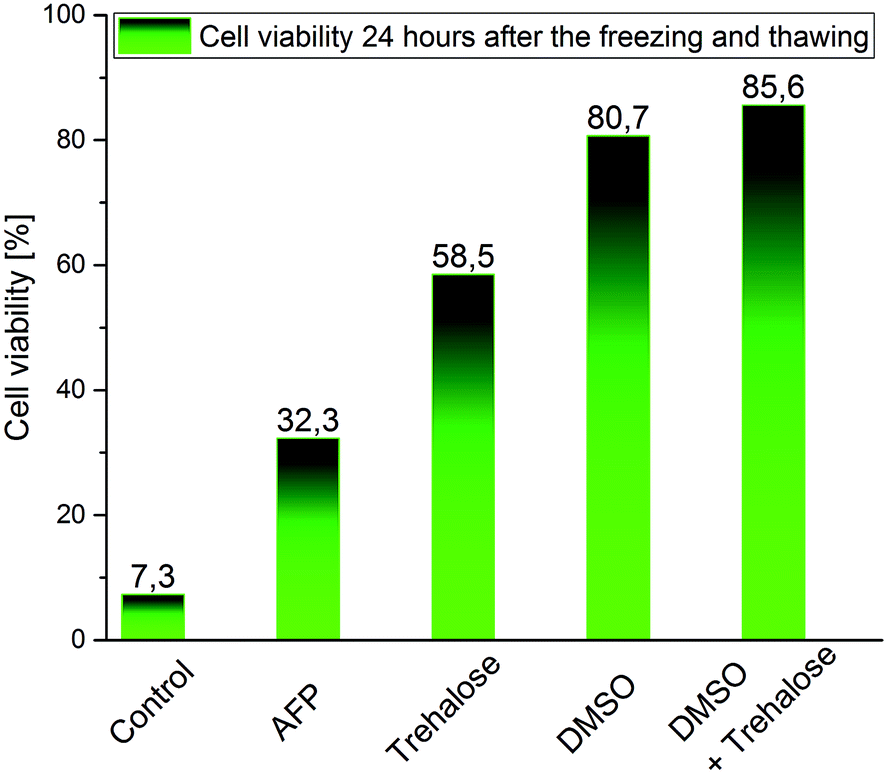 | ||
| Fig. 2 Cell viability measured 24 h after freezing/thawing by flow cytometry (Annexin V/7-AAD staining). | ||
3.2 X-ray diffraction
X-ray diffraction measurements were performed on frozen samples, and the crystal angular distribution was measured and compared for the studied materials (Table 2). Pure water had just a few very large crystals and the strongest diffraction intensity. An aqueous trehalose (41% (w/w)) solution showed crystal aggregates with similar orientations. This indicated that a crystal grew on one nucleus and that the growth was accompanied by precipitation of another phase, leading to curved crystals with needle/platelet/dendrite shapes. Trehalose in solution supports such aggregation of crystals in frozen samples. The rest of the samples, which contained AFP, DMSO and DMSO + trehalose, showed random crystal nucleation and growth. Fig. 4a shows histograms counting the data-points whose diffraction intensities lay in the particular ranges for each of the plots from Fig. 3 (from top to bottom correspondingly). Using a deconvolution procedure, equivalent histograms of the distribution of Gaussian peaks with maximum intensity in particular ranges are shown in Fig. 4b. The maps shown within each figure use the same logarithmical scale in order to be obvious, how the diffraction intensities differ among the maps. The same maps as in Fig. 3 can be found more contrasting in corresponding figures in ESI,† where it corresponds to a particular map at −20 °C (here the figures are sorted according to the cryoprotectant concentration).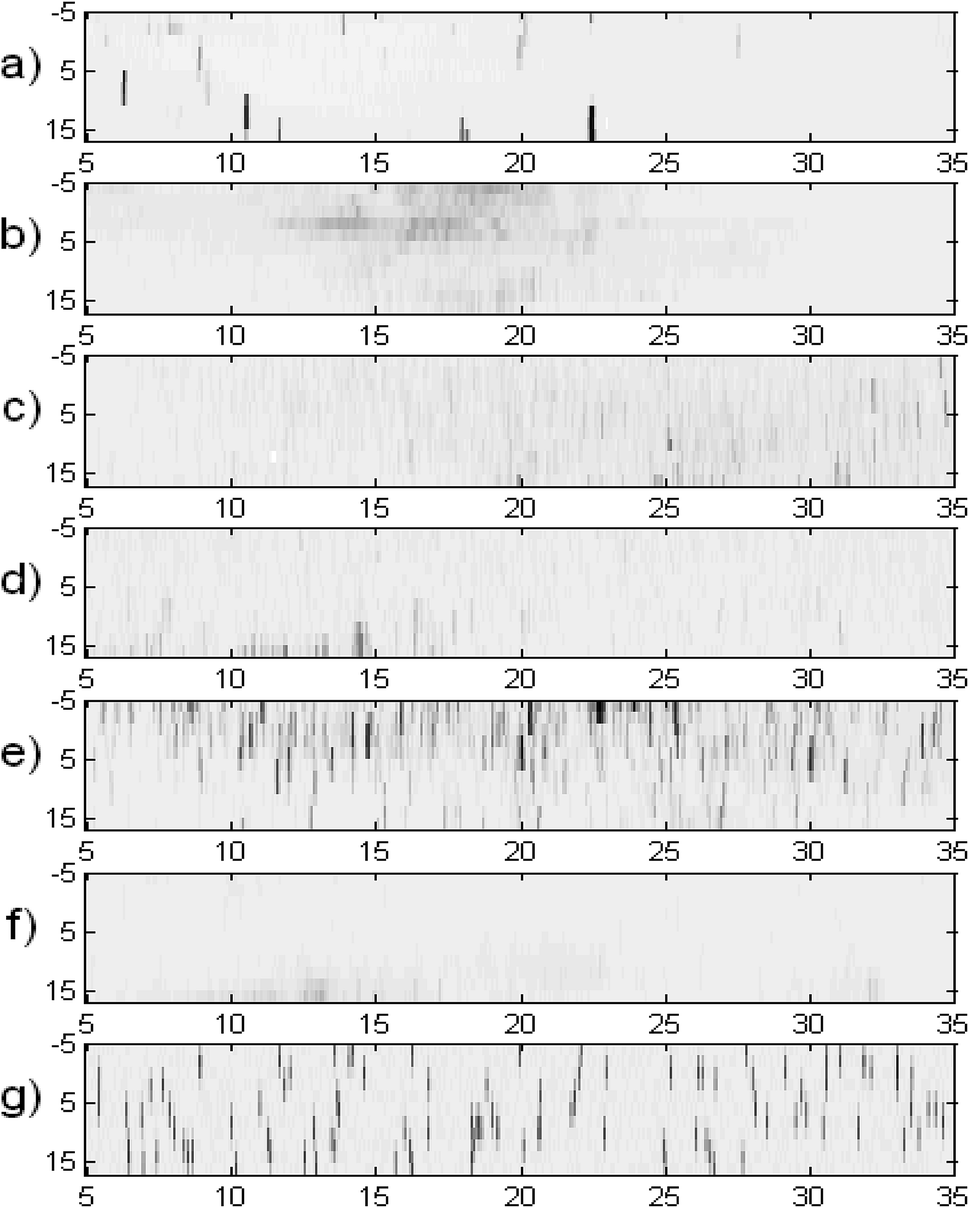 | ||
| Fig. 3 Diffraction intensity maps in angular coordinates. A comparison of frozen specimens of (a) water, (b) 41% (w/w) trehalose, (c) 10% (w/w) DMSO, (d) 10% (w/w) DMSO + 3.2% (w/w) trehalose, (e) 0.05% (w/w) AFP, (f) 1% (w/w) AFP, (g) simulated peaks. Horizontal axis, angle ω (horizontal tilt); vertical axis, angle χ (vertical inclination); the grey scale is logarithmic and is the same for all plots. | ||
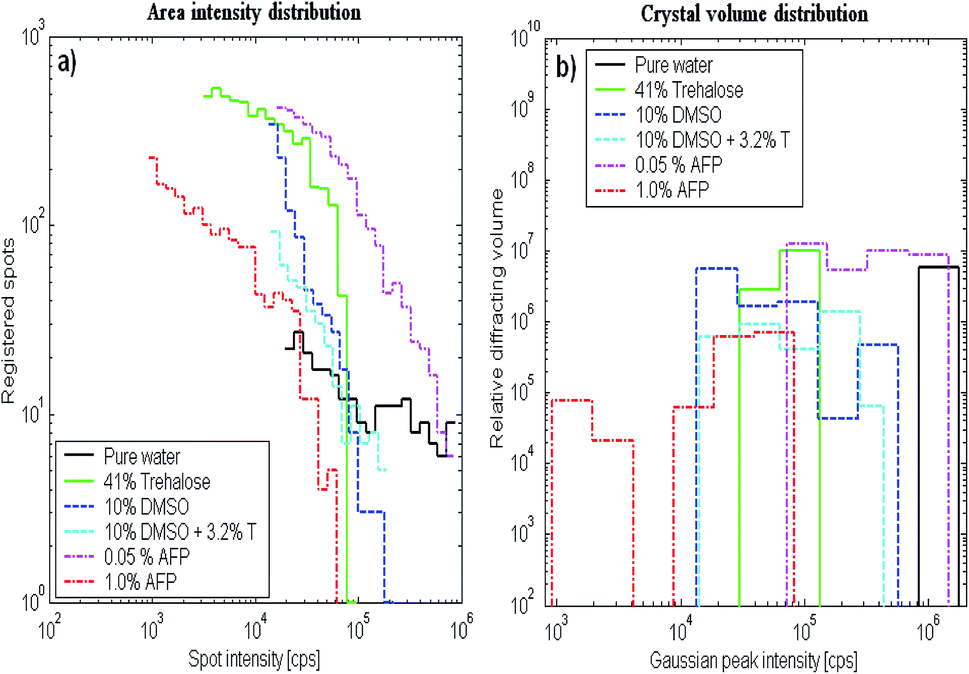 | ||
| Fig. 4 Histograms of the (a) area intensity distribution and (b) crystal volume distribution. The range (horizontal axis) scales start at intensity levels that are safely over the noise level. The vertical scale is either the number of data points with the specified intensity (a) or the relative volume of diffracting crystals with particular maximum intensity (b). | ||
In all cases, except for pure water, the results showed a decrease in the distribution for the strongest observed peaks (greatest x-values), which means that the distribution median lay in the range of smaller crystallites than would correspond to the maximum on the x-scale.
According to the kinematical theory of XRD, the diffraction intensity of crystallites (x-axis in Fig. 4b) is proportional to their volume. The histograms in Fig. 4b count the relative sample volume occupied by crystals with particular ranges of diffraction magnitude (proportional to crystal volume).31,32 The linear dimension (diameter) of the ice crystals, being roughly the third root of the diffracting volume, was the greatest for frozen pure water. The thinnest distribution was observed for 41%(w/w) trehalose solution. Their crystal volumes were at least ten times smaller than ice crystals from pure water (where the true distribution maximum is expected to lie beyond the chart upper limit). 0.05% AFP solution crystal volumes were more than twice those of 41% (w/w) trehalose, while in frozen 1%(w/w) AFP solutions ice crystals were less than half the volume of 41% (w/w) trehalose. The mean crystal sizes of 41% (w/w) trehalose solution were roughly comparable to both samples with 10% (w/w) DMSO (with or without 3.2% trehalose).
Concerning the melting procedure, the samples differ significantly. The 41% (w/w) trehalose solution exhibited a gradual shift of the distribution of crystal volumes to smaller values maintaining its relatively narrow distribution range. This means that the larger crystals were melting continuously to small crystals (the number of small crystals became relatively higher). In the pure solution of PBS, this effect was not observed (the melting mode was similar to DMSO). DMSO-rich solutions exhibited a continuous decrease of the size crystal distribution, but the mean volume and the ratio of smaller-to-larger crystals were conserved (compared to the frozen solution). This indicates that once an ice crystal starts to thaw, it will complete the process of melting completely, while some others remain stable at certain temperature level, regardless of their size. The 1% (w/w) AFP sample exhibited the melting mode similar to 41% (w/w) trehalose (ESI section S1–S6†).
3.3 Theoretical modelling
Our calculations showed that the studied cryoprotectants in water influenced the water dynamics (hydrogen bond lifetime). The calculated lifetimes reflect the influence of cryoprotectants on water dynamics and subsequently the crystallization process (Table 4). DMSO affected the largest amount of water molecules in the solution of all the studied cryoprotectants. In addition, water molecules near the methyl groups of a DMSO molecule cannot form an alternative H-bond, which changes both their interactions with other water molecules and ice formation. DMSO also affected the water dynamics due to the negative charge of the oxygen atom (greater than the charge on oxygens in trehalose or in water) increasing the strength of the H-bond with water. Adding 3.2% (w/w) trehalose to 10% (w/w) DMSO aqueous solution did not significantly change the water/water and DMSO/water hydrogen bond lifetimes (compared to 10% (w/w) DMSO).| Molecules used for the hydrogen bond lifetime calculations | τHB (ps) at 25 °C/τHB (ps) at −8 °C |
|---|---|
| Water | |
| Water/water | 3.02/7.93 |
|
|
| ApAFP752 in water | |
| ApAFP752/water | 16.90/50.64 |
| Surrounding water/water | 3.02/7.95 |
|
|
| Trehalose in water | |
| Trehalose/water | 4.92/15.16 |
| Surrounding water/water | 3.12/8.08 |
|
|
| DMSO in water | |
| DMSO/water | 5.36/13.39 |
| Surrounding water/water | 3.71/10.14 |
|
|
| Trehalose and DMSO in water | |
| Trehalose/water | 6.81/21.41 |
| DMSO/water | 5.19/13.45 |
| Surrounding water/water | 3.76/10.34 |
The hydrogen bond lifetime calculated for AFP/water was longer than the DMSO/water and trehalose/water lifetimes. The reduction of surrounding water mobility when AFP is present may be related to the large size of the AFP molecule and ice-binding surface (mainly through the hydroxyl groups).6,18 The AFP does not significantly influence free water but strongly influences the solvation shell around it. Under these conditions, AFP bound to the surface of ice crystals can inhibit their growth.
The electric dipole moments of DMSO and trehalose molecules in water were DFT calculated: 2.1 D for trehalose in water, 6.0 D for DMSO in water, and 2.5 D for water in water environment. The large electric dipole moment of DMSO, caused mainly by the strong negative charge of the oxygen atom and the strong positive charge of the sulphur atom, affected water molecules in the solutions. Mainly due to the prevalence of hydroxyl groups (high trehalose/trehalose interaction energy) and creation of multiple hydrogen bonds, trehalose easily forms clusters in water solutions (Table 4, Fig. 5 and Table S1†). The ratio of solvent 3(water) to the cryoprotectant atoms in modelled systems corresponded to the measured sample values.
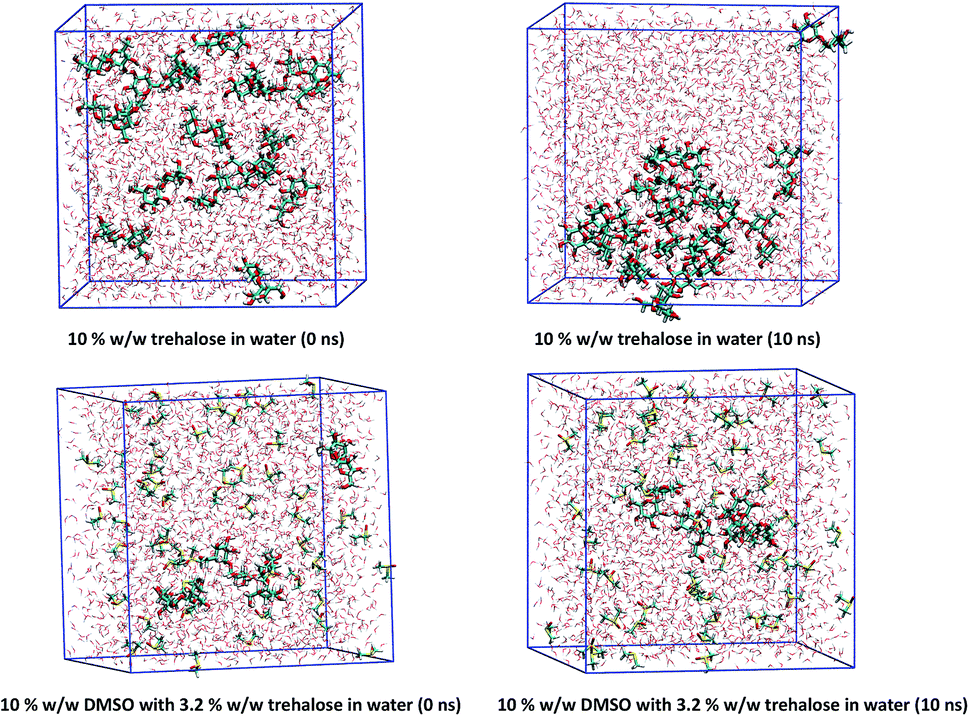 | ||
| Fig. 5 10% (w/w) trehalose in the solvation box (top), and 10% (w/w) DMSO with 3.2% (w/w) trehalose in the solvation box (bottom). The start (0 ns) of the molecular dynamics simulation is on the left, and the end (10 ns) of the molecular dynamics simulation is on the right. The simulations were performed at room temperature. | ||
Due to a relatively strong negative charge on the oxygen, DMSO can attract the positive part of a water molecule. DMSO does not form clusters – due to homogeneous distribution of DMSO molecules in solution, its large dipole moment affects material with high permittivity in the whole volume.
3.4 Raman spectroscopy
For PBS and AFP solutions frozen at −170 °C (Fig. 6), the mode at 3420 cm−1 (related to the ‘eutectic’ phase – in this case hydrohalite – originating from PBS) can be clearly seen (even at high AFP concentrations). 3420 cm−1 peak was not observed for 10% (w/w) DMSO + PBS solution and also for 0.7% (w/w) DMSO + PBS solutions frozen at −170 °C. In trehalose with PBS containing solutions frozen at −170 °C the 3420 cm−1 peak was not observed both for 13.2 (w/w)% + PBS and for 3.2 (w/w)% + PBS solutions (Fig. 6). It is therefore likely that DMSO and trehalose prevent water from forming a eutectic phase with other substances (such as NaCl), while AFP does not. That is in accord with their assumed mechanisms of action: during freezing, DMSO and trehalose concentrate in pockets of unfrozen solution which would otherwise form a eutectic, blocking its formation. On the other hand, AFP molecules associate with the surface of emerging ice crystals and don't therefore affect the rest of the sample.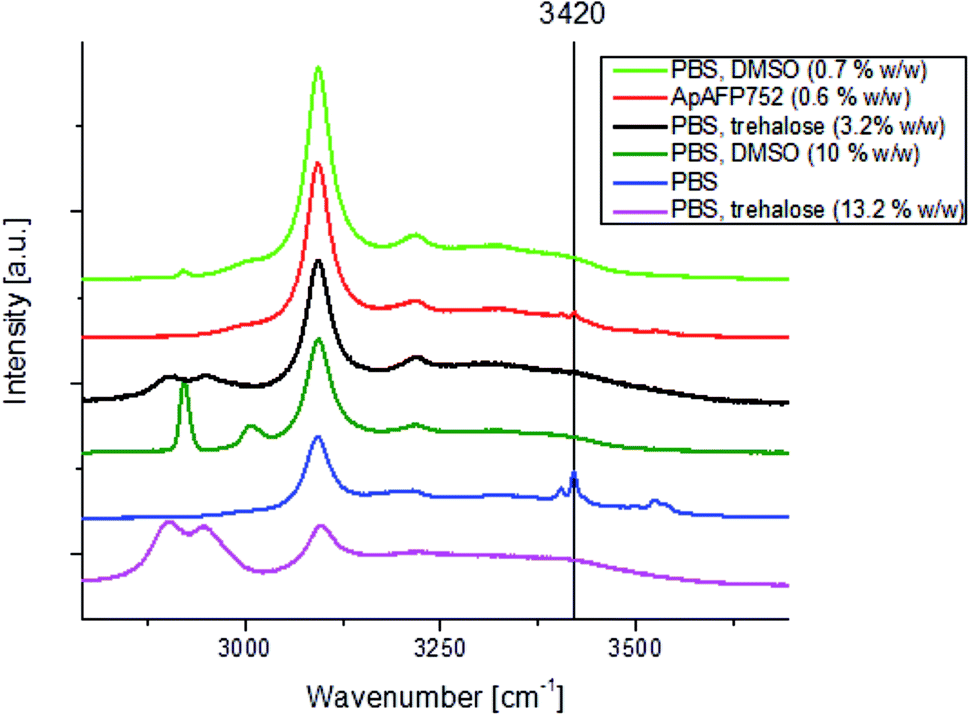 | ||
| Fig. 6 Raman spectra of solutions frozen at −170 °C. The samples are: AFP, PBS (50 mM phosphate and 50 mM NaCl in DI water), trehalose in PBS, DMSO in PBS. The mode at 3420 cm−1 (related to the ‘eutectic’ phase – in this case hydrohalite – originating from PBS) can be clearly seen in the case of PBS and AFP solutions. | ||
3.5 Differential scanning calorimetry
DSC curves of DI water, AFP solution, aqueous solutions of trehalose and mixture of DMSO with trehalose were measured. In all studied cryoprotectant-containing solutions, the melting/freezing points were shifted to lower values (compared to deionized (pure) water/ice) – Table 5. The great shift of the melting/freezing point (related to the concentration of cryoprotectant in the solution) was observed in 10% (w/w) DMSO containing solutions. This correlates with change in the DMSO solution crystallinity (XRD). The glass phase transition temperature for the trehalose/water solution was found to be T1 = −38 °C. Strong interactions between AFP and the first shell of solvation water led to disruption of the structure providing protection against ice growth and induced the highest freezing–melting ice hysteresis (14 °C). This hysteresis increased with AFP concentration. In accordance with the results of Raman spectroscopy the eutectic (hydrohalite) phase was also observed by DSC in ApAFP752 solutions and PBS solutions. DSC (peaks at −23, −31 °C in PBS solution and at −22, −27 °C in ApAFP solution). Temperatures of both ice and hydrohalite melting points were changed when ApAFP752 was added to the PBS solution. No eutectic phase was observed in 10% (w/w) DMSO PBS containing solutions and 3.2% (w/w) trehalose and PBS contacting solutions. Even if we worked with pure (deionized) water all the cryoprotectants (possible ice nucleation centres) reduced freezing and melting temperatures – ice construction was deformed.| Sample | Tm [°C] |
|---|---|
| DI water | 0 |
| 1% (w/w) AFP + DI water | −2 |
| 100 mM (3.2% w/w) trehalose + DI water | −1 |
| 10% w/w DMSO + 100 mM (3.2% w/w) trehalose + DI water | −10 |
| 10% w/w DMSO + DI water | −10 |
| 41% w/w trehalose + DI water | −13 |
| 15% w/w trehalose + DI water | −3 |
4. Discussion
In this work, theoretical and experimental studies of antifreeze protein AFP752, trehalose and dimethyl sulfoxide influence on the ice constitution were correlated with post freeze/thaw cell viability. The motivation was to identify attributes of investigated materials which are important for functional cryoprotection of cells.The diameter of ice crystallites was greatest in frozen water (without cryoprotectants) so all cryoprotectants in this study more or less efficiently prevented the ice growth (XRD). The mean crystal sizes in frozen 10% (w/w) DMSO solution (with or without 3.2% (w/w) trehalose) were ten times smaller than ice in frozen water. The smallest diameter of ice crystallites was detected in frozen 1% (w/w) AFP – ice crystals were less than the volume of ice in 10% (w/w) DMSO. Ice crystals in frozen 3.2% (w/w) trehalose solutions were biggest from all cryoprotectants frozen solutions (half in size compared to frozen water). DMSO and trehalose in PBS solutions prevented water from forming ‘eutectic’ (hydrohalite) phase. In frozen AFP solutions the eutectic phase/hydrohalite was constituted (Raman spectroscopy, DSC).
During the melting process of the frozen solutions, in 1% (w/w) AFP and trehalose (41% (w/w)) frozen solutions larger crystals were melted continuously to small crystals (the number of small crystals became relatively higher). The reason for the melting mode of crystals with trehalose could be a gradient composition (crystals and glassy state).3,33 In frozen AFP solutions gradient ice crystals composition with a pure ice core and increasing concentration of defects or solvents in the outer shells was constituted. In DMSO-rich solutions the mean volume and the ratio of smaller-to-larger crystals was conserved.
We showed (DSC) that the presence of studied additives in the solution generally leads to changes in freezing process. Even if the DSC measurements were made using pure (deionized) water all cryoprotectants (possible ice nucleation centres) reduced freezing and melting temperatures of solutions – ice construction process was deformed by cryoprotectants.
The modelling studies showed that DMSO, which has an oxygen atom with a strong negative charge and a sulphur atom with a strong positive charge/high dipole moment, influences the high permittivity water strongly affecting the water freezing process. In addition, water molecules near the DMSO methyl groups cannot form alternative hydrogen bonds with DMSO, which affects their interactions with other water molecules and also ice formation. DMSO molecules with high dipole moments homogeneously distributed in solution (practically forming no clusters) have a long-range effect on water dynamics affecting the thermodynamics of the solution. In other words, DMSO molecules strongly change the conditions for water freezing in the entire volume which results in the formation of small ice crystals.
Trehalose, due to its high inter-molecular interaction potential can easily form cluster structure which can contain also glass phase3,20,28 and just moderately impact neighbouring and remote water molecules. Trehalose supports aggregation of crystals in frozen samples. In solutions in which trehalose concentrations were relevant for biological applications (3.2% (w/w)) ice crystal sizes were biggest from all cryoprotectants solutions.
AFP (noncolligative material)22 had the strongest influence on the neighbouring water molecules hydrogen bond dynamics (short-range effect). Strong interactions between AFP and the first shell of solvation water induce the highest freezing–melting ice hysteresis (measured by DSC). The strong interaction with water is mainly caused by the fact that AFP is a large and less mobile molecule with hydroxyl groups on the surface. AFP, attached to the ice surface reduces ice crystal size mainly if the ice nucleus growing is blocked. This results in smallest ice crystals in 1%(w/w) AFP solutions.
In our case the cells were so slowly frozen (using a gradient of −1 °C min−1) that they loose water (dehydrate) rapidly enough to eliminate critical supercooling. According to34,35 in such dehydrated cells intracellular freezing is not crucial. As cryoprotectants affect the volume of ice crystals, they influence the direct damage of cell membranes and the viability of the frozen/thawed cells. Small DMSO molecules enter intracellular space, effectively decrease ice size and strongly improve cell viability after freezing/thawing (81% of DMSO-treated cells survived the freezing/thawing treatment). The protective effect of large ice-blocking AFP molecules was smaller compared to DMSO, as only 32% of AFP-treated cells survived the freezing/thawing treatment. The effects of trehalose treatment were observable only after 24 h of incubation: 58% of trehalose-treated cells survived freezing/thawing. Of all cryoprotectants under study, trehalose has the smallest impact on ice crystal size and when used as cryoprotectants. Thus trehalose probably acts mainly as a natural osmolyte (osmoprotectant), which then stabilizes phospholipid membranes and the tertiary structure of proteins.36,37 The highest cell viability was observed when a mixture of DMSO + trehalose was applied: 86% of DMSO + trehalose-treated cells survived the freeze/thaw.
5. Conclusions
Altering the physical conditions of the liquid/solid phase transition within the cells or immediately surrounding them is important attribute of materials that induce cell cryoprotection. One important reason for death of frozen cells is due to the direct membrane damage caused by the ice crystals volume. This work is the first example where ice crystal size in frozen solutions was quantified (XRD) and correlated with theoretical models (DFT, MD) and cryopreserved cell viability. The results were complemented by Raman spectroscopy and DSC studies. Influence of cryoprotectants on the ice constitution was correlated with viability of so slowly frozen cryopreserved cells that critical supercooling was according to ref. 34 and 35 eliminated.From our results we can conclude that the presence of additives in the solution generally leads to the irregularity and worse ordering of the ice lattice. DMSO and AFP have such impact on their solutions freezing process that ice crystallinity size is considerably reduced. This contributes to parameters that affect viability of cryopreserved frozen/thawed cells.9 DMSO is homogeneously distributed in solution (practically no clusters) and has a long-range effect on bulk water dynamics. DMSO molecules are able to enter both extra and intracellular space,28 effectively change the condition for freezing and strongly improve frozen/thaw cells viability. AFP even at low concentration inhibits standard crystallization process from ice nuclei. Consequently, specific gradient composition with a pure ice core and increasing concentration of defects in the outer parts is developed. All these aspects support the fact that AFP molecules, even practically without entering the cells have cryoprotective effect. The best viability results were obtained when combination of DMSO strongly changing freezing process also in cells and trehalose stabilizing phospholipid membranes and the tertiary structure of proteins were applied.
Acknowledgements
This work was supported by the Ministry of Education, Youth and Sports of the Czech Republic (FUNBIO CZ.2.16/3.1.00/21568 and MEYS: LO1409); by the Czech Science Foundation (14-10279S, 15-05095S, 16-12454S and P302/12/G157); by the Ministry of Health of the Czech Republic (16-29835A); by Czech contribution to JINR Dubna (Project of Czech Plenipotentiary and Project 3-Plus-3, 2015/16); by the National Science Foundation (CHE-1413696 and DGE-0948027); and by the National Institute of General Medical Sciences at the National Institutes of Health (P20GM103432).References
- B. J. Fuller, CryoLetters, 2004, 25, 375 CAS.
- Y. Yeh and R. E. Feeney, Chem. Rev., 1996, 96, 601 CrossRef CAS PubMed.
- G. M. Wang and A. D. J. Haymet, J. Phys. Chem. B, 1998, 102, 5341 CrossRef CAS.
- J. B. Mandumpal, C. A. Kreck and R. L. Mancera, Phys. Chem. Chem. Phys., 2011, 13, 3839 RSC.
- B. Kirchner and M. Reiher, J. Am. Chem. Soc., 2002, 124, 6206 CrossRef CAS PubMed.
- D. R. Nutt and J. C. Smith, J. Am. Chem. Soc., 2008, 130, 13066 CrossRef CAS PubMed.
- B. Han and J. C. Bischof, J. Biomech. Eng., 2004, 126, 196 CrossRef PubMed.
- S. Venketesh and C. Dayananda, Crit. Rev. Biotechnol., 2008, 28, 57 CrossRef CAS PubMed.
- R. C. Deller, M. Vatish, D. A. Mitchell and M. I. Gibson, Nat. Commun., 2014, 5, 3244 Search PubMed.
- X. Mao, Z. Liu, J. Ma, H. Pang and F. Zhang, Cryobiology, 2011, 62, 91 CrossRef CAS PubMed.
- J. J. Towey, A. K. Soper and L. Dougan, Faraday Discuss., 2013, 167, 159 RSC.
- J. Sebera, S. Nespurek, I. Kratochvilova, S. Zalis, G. Chaidogiannos and N. Glezos, Eur. Phys. J. B, 2009, 72, 385 CrossRef CAS.
- H. J. C. Berendsen, D. van der Spoel and R. van Drunen, Comput. Phys. Commun., 1995, 91, 43 CrossRef CAS.
- K. Lindorff-Larsen, S. Piana, K. Palmo, P. Maragakis, J. L. Klepeis, R. O. Dror and D. E. Shaw, Proteins, 2010, 78, 1950 CAS.
- T. Darden, D. York and L. Pedersen, J. Chem. Phys., 1993, 98, 10089 CrossRef CAS.
- M. J. Frisch, G. W. Trucks, H. B. Schlegel, G. E. Scuseria, M. A. Robb, J. R. Cheeseman and J. A. Pople, GAUSSIAN 09 (Revision B.01), Gaussian, Wallingford, 2010 Search PubMed.
- P. A. Bates and M. J. E. Sternberg, Proteins: Struct., Funct., Genet., 1999,(3), 47 CrossRef CAS.
- Y. C. Liou, A. Tocilj, P. L. Davies and Z. Jia, Nature, 2000, 406, 322 CrossRef CAS PubMed.
- E. Krieger and G. Vriend, Bioinformatics, 2014, 30, 2981 CrossRef CAS PubMed.
- H. Nagase, N. Ogawa, T. Endo, M. Shiro, H. Ueda and M. Sakurai, J. Phys. Chem. B, 2008, 112, 9105 CrossRef CAS PubMed.
- J. Smiatek, R. K. Harishchandra, H.-J. Galla and A. Heuer, Biophys. Chem., 2013, 180–181, 102 CrossRef CAS PubMed.
- A. Narayanan Krishnamoorthy, C. Holm and J. Smiatek, J. Phys. Chem. B, 2014, 118, 11613 CrossRef CAS PubMed.
- B. Contreras-Moreira and P. A. Bates, Bioinformatics, 2002, 18, 1141 CrossRef CAS PubMed.
- S. Záliš, I. Kratochvílová, A. Zambová, J. Mbindyo, T. E. Mallouk and T. S. Mayer, Eur. Phys. J. E, 2005, 18, 201 CrossRef PubMed.
- M. Hofer, M. Falk, D. Komůrková, I. Falková, A. Bačíková, B. Klejdus, E. Pagáčová, L. Štefančíková, L. Weiterová, K. J. Angelis, S. Kozubek, L. Dušek and Š. Galbavý, J. Med. Chem., 2016, 59, 3003 CrossRef CAS PubMed.
- A. Luzar and D. Chandler, J. Chem. Phys., 1993, 98, 8160 CrossRef CAS.
- A. Kreiner-Møller, F. Stracke and H. Zimmermann, CryoLetters, 2013, 34, 248 Search PubMed.
- J. Dong, J. Malsam, J. C. Bischof, A. Hubel and A. Aksan, Biophys. J., 2010, 99, 2453 CrossRef CAS PubMed.
- C. Branca, S. Magazu, G. Maisano and P. Migliardoa, J. Chem. Phys., 1999, 111, 281 CrossRef CAS.
- R. L. Suttont, J. Chem. Soc., Faraday Trans., 1991, 87, 3747 RSC.
- D. Simek, D. Rafaja, M. Motylenko, V. Klemm, G. Schreiber, A. Brethfeld and G. Lehmann, Steel Res. Int., 2008, 79, 800 CrossRef CAS.
- Z. Matej, L. Matejova and R. Kuzel, Powder Diffr., 2013, 28, S161 CrossRef CAS.
- L. Weng and G. D. Elliott, Phys. Chem. Chem. Phys., 2014, 16, 11555 RSC.
- P. Mazur, Cryobiology, 1977, 14, 251 CrossRef CAS PubMed.
- P. Mazur and C. Koshimoto, Biol. Reprod., 2002, 66, 1485 CrossRef CAS PubMed.
- N. Krasteva, D. Vollhardt, G. Brezesinski and H. Möhwald, Langmuir, 2001, 17, 1209 CrossRef CAS.
- W. B. Yu, T. Jiang, D. M. Lan, J. H. Lu, Z. Y. Yue, J. Wang and P. Zhou, Arch. Biochem. Biophys., 2012, 523, 144 CrossRef CAS PubMed.
Footnote |
| † Electronic supplementary information (ESI) available. See DOI: 10.1039/c6ra25095e |
| This journal is © The Royal Society of Chemistry 2017 |