
 Open Access Article
 This Open Access Article is licensed under a
 Creative Commons Attribution 3.0 Unported Licence
Carrier type change induced by fluorine doping in spin-chain compound Ca3Co2O6
Jiyue Songab,
Bangchuan Zhao*a,
Yanan Huanga,
Yanfeng Qinab,
Jiafeng Zhouab,
Wenhai Songa and
Yuping Sunacd
aKey Laboratory of Materials Physics, Institute of Solid State Physics, Chinese Academy of Sciences, Hefei 230031, People's Republic of China. E-mail: bchzhao@issp.ac.cn; Tel: +86-551-6559-2757
bUniversity of Science and Technology of China, Hefei 230026, People's Republic of China
cHigh Magnetic Field Laboratory, Chinese Academy of Sciences, Hefei 230031, People's Republic of China
dCollaborative Innovation Center of Advanced Microstructures, Nanjing University, Nanjing 210093, People's Republic of China
First published on 12th January 2017
Abstract
The structural, magnetic, electrical, and thermoelectric properties of fluorine (F)-doped Ca3Co2O6 were investigated systematically. Based on the use of X-ray diffraction, X-ray photoelectron spectroscopy spectra, and magnetic data, it was concluded that part of the Co3+ ions at octahedral sites would transfer into Co2+ because of the substitution of F− for O2−. The induced Co2+ ions are antiferromagnetically coupled with the nearest neighboring Co3+. The room-temperature resistivity decreases monotonously with the increase of fluorine (F)-doping content, x, and it is suggested that this is related to the increased carrier mobility. The resistivity curves of the samples with x ≥ 0.4 show an anomaly at T* ∼ 320 K, which is considered to be related to the change of activation energy (Ea). The room temperature thermopower S300 K changed from a positive value of 686.6 μV K−1 to a negative value of −333.1 μV K−1 as x increases from 0 to 0.4 and considering this with the Hall coefficient result, it is concluded that suitable F-doping in Ca3Co2O6 can change the type of the majority of carriers from p to n with a decreased resistivity. The thermal conductivity, κ of the n-type samples is much larger than that of the p-type, and the κ of both the p-type and n-type samples decreases monotonously with increasing x. The anomaly of κ near x = 0.4 is suggested to originate from the decreased grain boundary scattering and the sudden decrease of Ea at the critical point of the carrier type change.
Introduction
Thermoelectric (TE) materials can be used to interconvert thermal energy and electric energy directly through the Seebeck effect or the Peltier effect in a single device.1 In general, the ideal TE materials need high thermopower (S), low resistivity (ρ) and thermal conductivity (κ) to reach a high figure of merit (ZT = TS2/ρκ). Since the discovery of good TE performance in the layered structure cobaltites: NaxCo2O4,2 Bi2Sr2Co2Oy,3 and Ca3Co4O9,4 the oxide TE materials have attracted much attention in recent years. Compared with these layered cobalt oxides (S ∼ 100–125 μV K−1 at 300 K), the quasi-one-dimensional cobalt oxide, Ca3Co2O6, has an extremely large thermopower (S ∼ 680 μV K−1 at 300 K) and excellent thermal stability5 (up to 1300 K) in air.Crystallization in a K4CdCl6 type structure with a space group R![[3 with combining macron]](https://www.rsc.org/images/entities/char_0033_0304.gif) c, Ca3Co2O6 consists of infinite chains with alternating face sharing CoO6 trigonal prisms and CoO6 octahedra along the c axis.6 The chains form a triangular lattice in the ab plane, separated by Ca2+ ions. The cobalt ions located at both the trigonal prism (CoI; S = 2) and octahedral sites (CoII; S = 0) are trivalent,7 while they are in different spin states because of the different crystalline electric field. Except for the interesting magnetic phenomena, such as magnetization steps,8 magnetoresistance9 and magnetodielectric coupling behavior10,11 observed in Ca3Co2O6 and its derivative compounds, its TE properties have also attracted much attention in recent years. Since the high TE performance was reported by Mikami5 and Takahashi12 for a single crystal Ca3Co2O6, much research has been undertaken to improve its TE performance using element substitution or by optimizing the preparation method. The substitution of Fe for Co can lead to the enhancement of S because of the change of spin and valence states of the Co ions.13 The S at 800 K can be improved more than 400% using Bi/Cu14 or Na/Mn15 co-doping. In general, although Ca3Co2O6 is considered to be a p-type TE material, its carrier type can be changed to n-type using 5% Ti doping at the Co site.16 However, there is an undesirable effect of an increase of resistivity, which is not beneficial for a TE material. From the perspective of future applications, searching for an n-type Ca3Co2O6 with a low resistivity is imperative. Furthermore, the investigations on the effect of substitution in the Ca3Co2O6 system are mainly focused on the Co10,17 or Ca sites,18,19 and studies on the substitution effect at the O site have not been reported so far. To fully understand the element substitution effect on the physical properties of Ca3Co2O6, in this work the structural, magnetic and TE properties of F-doped Ca3Co2O6 were systematically studied over a large F composition range (0 ≤ x ≤ 0.8). The results show that an expected Ca3Co2O6-based n-type TE material was obtained using suitable F-doping. The carrier type changed from p-type to n-type as the F-doping level reached x = 0.4 and the resistivity decreased monotonously with increasing F content. Although the ZT value of the series materials does not meet the standard of application (ZT > 1), this work may give guidance for the study of other TE materials.
c, Ca3Co2O6 consists of infinite chains with alternating face sharing CoO6 trigonal prisms and CoO6 octahedra along the c axis.6 The chains form a triangular lattice in the ab plane, separated by Ca2+ ions. The cobalt ions located at both the trigonal prism (CoI; S = 2) and octahedral sites (CoII; S = 0) are trivalent,7 while they are in different spin states because of the different crystalline electric field. Except for the interesting magnetic phenomena, such as magnetization steps,8 magnetoresistance9 and magnetodielectric coupling behavior10,11 observed in Ca3Co2O6 and its derivative compounds, its TE properties have also attracted much attention in recent years. Since the high TE performance was reported by Mikami5 and Takahashi12 for a single crystal Ca3Co2O6, much research has been undertaken to improve its TE performance using element substitution or by optimizing the preparation method. The substitution of Fe for Co can lead to the enhancement of S because of the change of spin and valence states of the Co ions.13 The S at 800 K can be improved more than 400% using Bi/Cu14 or Na/Mn15 co-doping. In general, although Ca3Co2O6 is considered to be a p-type TE material, its carrier type can be changed to n-type using 5% Ti doping at the Co site.16 However, there is an undesirable effect of an increase of resistivity, which is not beneficial for a TE material. From the perspective of future applications, searching for an n-type Ca3Co2O6 with a low resistivity is imperative. Furthermore, the investigations on the effect of substitution in the Ca3Co2O6 system are mainly focused on the Co10,17 or Ca sites,18,19 and studies on the substitution effect at the O site have not been reported so far. To fully understand the element substitution effect on the physical properties of Ca3Co2O6, in this work the structural, magnetic and TE properties of F-doped Ca3Co2O6 were systematically studied over a large F composition range (0 ≤ x ≤ 0.8). The results show that an expected Ca3Co2O6-based n-type TE material was obtained using suitable F-doping. The carrier type changed from p-type to n-type as the F-doping level reached x = 0.4 and the resistivity decreased monotonously with increasing F content. Although the ZT value of the series materials does not meet the standard of application (ZT > 1), this work may give guidance for the study of other TE materials.
Experimental details
Polycrystalline samples of Ca3Co2O6−xFx (x = 0–0.8) were prepared using a conventional solid-state reaction method.20 High purity powders of calcium carbonate (CaCO3) cobalt(II,III) oxide (Co3O4) and calcium fluoride (CaF2) in a stoichiometric ratio were mixed thoroughly and preheated at 1223 K for 24 h twice with an intermediate grinding step. Then the mixtures obtained were reground, pressed into circular pellets, and sintered at 1223 K for another 48 h in air. The structure and phase purity of the samples were checked using powder X-ray diffraction (XRD) using a Philips X'pert PRO X-ray diffractometer with Cu Kα radiation (20° ≤ 2θ ≤ 80°) at room temperature. The X-ray photoelectron spectra (XPS) were obtained using a Thermo Scientific ESCALAB 250 spectrometer using Al Kα X-rays at 1486.6 eV as the excitation source. The microstructures were investigated using a scanning electron microscope (SEM). The chemical composition was determined on an energy dispersive spectroscope (EDS) attached to the SEM equipment. The magnetic measurements were carried out with a superconducting quantum interference device (SQUID) magnetic property measurement system (MPMS) system. The Hall coefficient (RH) at room temperature and the temperature dependence of resistivity, thermopower, and thermal conductivity were all measured using a Quantum Design physical property measurement system (PPMS). The RH data were obtained under a magnetic field range from −4 T to 4 T. The carrier concentration (n*) and carrier mobility (μ) were calculated according to n* = 1/(eRH) and σxx = n*eμ, respectively.Results and discussion
Structure
The room temperature powder XRD patterns of Ca3Co2O6−xFx (x = 0–0.8) samples are shown in Fig. 1(a). The results show that F-doping did not change the lattice structure of this system. All samples were found to have the rhombohedral structure with space group Rc. To clearly show the effect of F-doping on the lattice, the enlarged (300) peaks are shown in Fig. 1(b). As the F-doping content increases, the (300) peak moves to a higher angle position first and then moves in the opposite direction. The XRD patterns were refined using the standard Rietveld technique and the lattice parameters obtained were plotted as a function of the doping level (x) in the inset of Fig. 1(a). It was found that both the parameters a and c decrease first and then increase with the increase of x, which is consistent with the shift of the (300) peaks as shown in Fig. 1(b).
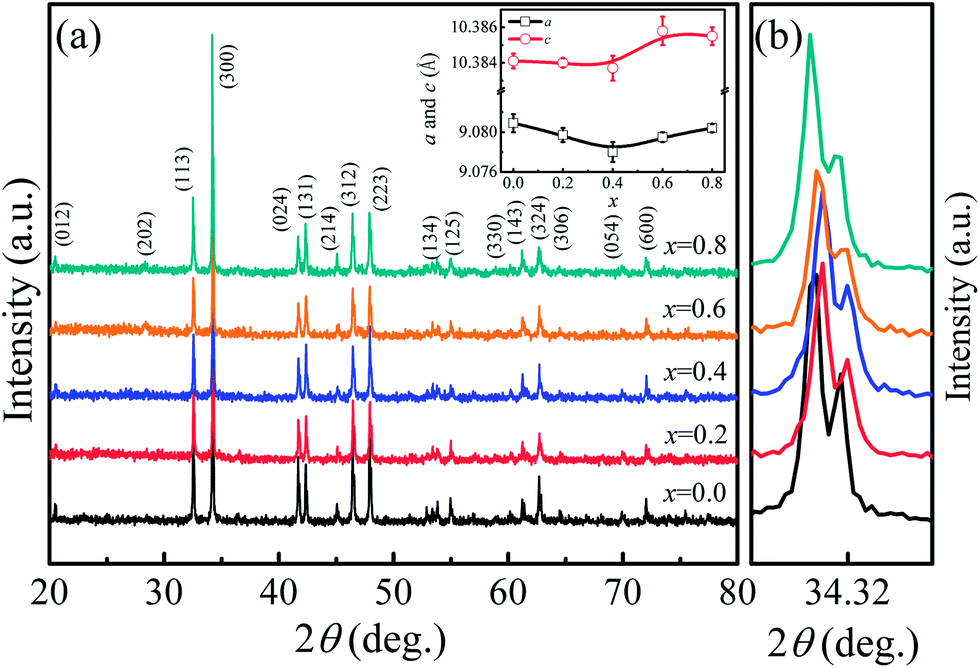 | ||
| Fig. 1 (a) XRD patterns of Ca3Co2O6−xFx (x = 0, 0.2, 0.4, 0.6, 0.8). The inset presents the lattice parameters as functions of the doping content (x). (b) The enlarged (300) peaks for all samples. | ||
In general, F− doping at the O2− site should give rise to the decrease of lattice parameters because of the slightly smaller ionic radius of F− (1.33 Å) compared to that of O2− (1.4 Å), but this is inconsistent with the results observed in this work. In fact, as O2− ions are substituted by F−, some of the Co3+ ions should change into Co2+ to keep the charge neutrality. The radius of Co2+ [0.65 Å for low spin (LS) Co2+ and 0.745 Å for high spin (HS) Co2+] is larger than that of Co3+ (0.545 Å for HS Co3+ and 0.61 Å for LS Co3+), and the ion transfer induced by F-doping will lead to the expansion of lattice. The variation of the lattice parameters found in the present work was affected by the two competing factors discussed previously. The role of the two factors was different as the F-doping level changed. As the F-doping is slight, the substituted F− ions with smaller ionic radius lead to the decreased lattice parameters shown in the inset of Fig. 1(a). In the heavily F-doped samples, the increased lattice parameter should be dominated by the ionic radius difference between Co3+ and the induced Co2+ ions.
In order to show the valence transition of Co ions clearly, XPS measurements were performed on two typical samples with x = 0 and 0.8, and the results are shown in Fig. 2(a) and (b), respectively. As Fig. 2(a) shows, two distinct peaks located at ∼780 eV and ∼796 eV correspond to the Co 2p core-level spectrum of Ca3Co2O6,21 and the weak peaks situated at ∼789.1 eV and ∼804.3 eV are the satellite peaks of Co ions.22 The peak located at ∼780 eV can be deconvoluted into two peaks. The two peaks corresponding to the higher binding energy (BE) and the lower BE are attributed to Co2+ and Co3+ ions, respectively. The BE of the Co3+ 2p3/2 peak located at 780.4 eV is close to that of Co3+ 2p3/2 in ZnCo2O4 (780.6 eV),23 and the BE of the Co2+ 2p3/2 peak located at 782.2 eV is close to that of Co2+ 2p3/2 in Co(OH)2 (782 eV).24 Similarly, the deconvoluted peaks located at 795.5 eV and 798 eV correspond to Co3+ 2p1/2 and Co2+ 2p1/2.22 As can be seen from the figure, a small amount of Co2+ ions existed in the un-doped sample of Ca3Co2O6 and the ratio of Co2+ is estimated at 12%. In general, the Co ions of Ca3Co2O6 at both trigonal prismatic and octahedral sites are in the trivalent state.25 The presence of a small amount of Co2+ in the un-doped sample should be related to the oxygen non-stoichiometry induced during the sample preparation process. Compared with Fig. 2(a) and (b), the area of the deconvoluted Co2+ 2p3/2 and Co2+ 2p1/2 peaks increases obviously as the F− ions go into the system. The calculated content of Co2+ ions is about 35% in the sample with x = 0.8, implying that part of the Co3+ ions transfer into Co2+ via the F-doping. The increased content of Co2+ gives rise to the increase of lattice parameters because of its much larger ionic radius than that of Co3+ as previously mentioned.
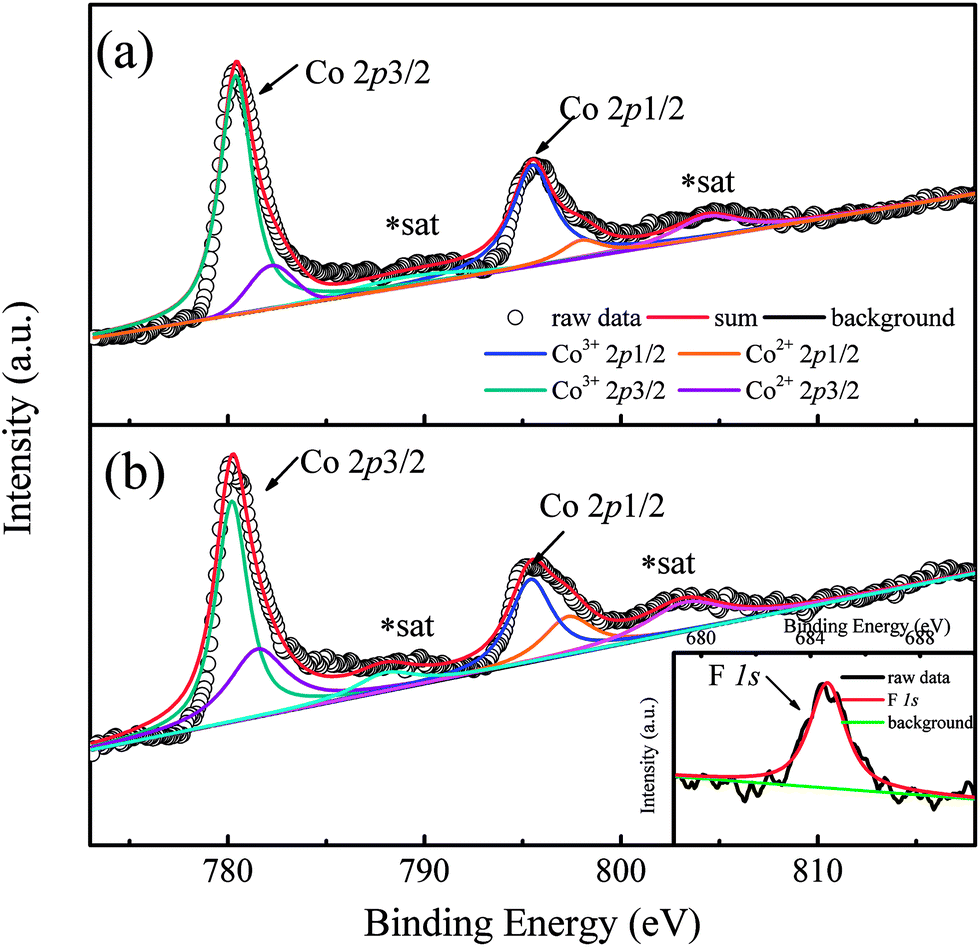 | ||
| Fig. 2 (a) Co 2p photoelectron spectrum of Ca3Co2O6. (b) Co 2p photoelectron spectrum of x = 0.8 sample. Inset shows the F 1s peak. | ||
Magnetic properties
The temperature dependence of magnetization M(T) for Ca3Co2O6−xFx was measured in the temperature range of 3–150 K and the data below 50 K are shown in Fig. 3(a)–(e). The temperature dependence of inverse dc susceptibility fitted using the Curie–Weiss law are shown in the insets of Fig. 3(a)–(e). The M(T) data were collected in zero-field-cooling (ZFC), field-cooling (FC), and field-cooling-warming (FCW) modes at an applied field of 100 Oe. Only the ZFC and FCW curves are shown in this figure because the FCC and FCW curves almost overlap. From Fig. 3(a)–(e), it can be seen that all samples undergo a long-range spin density wave transition26–28 at Tc1 and a spin-glass like transition29 at Tc2 with the decrease of temperature. F-doping does not obviously change the two magnetic transitions, but the value of the low temperature magnetization decreases with the increase of F-doping content.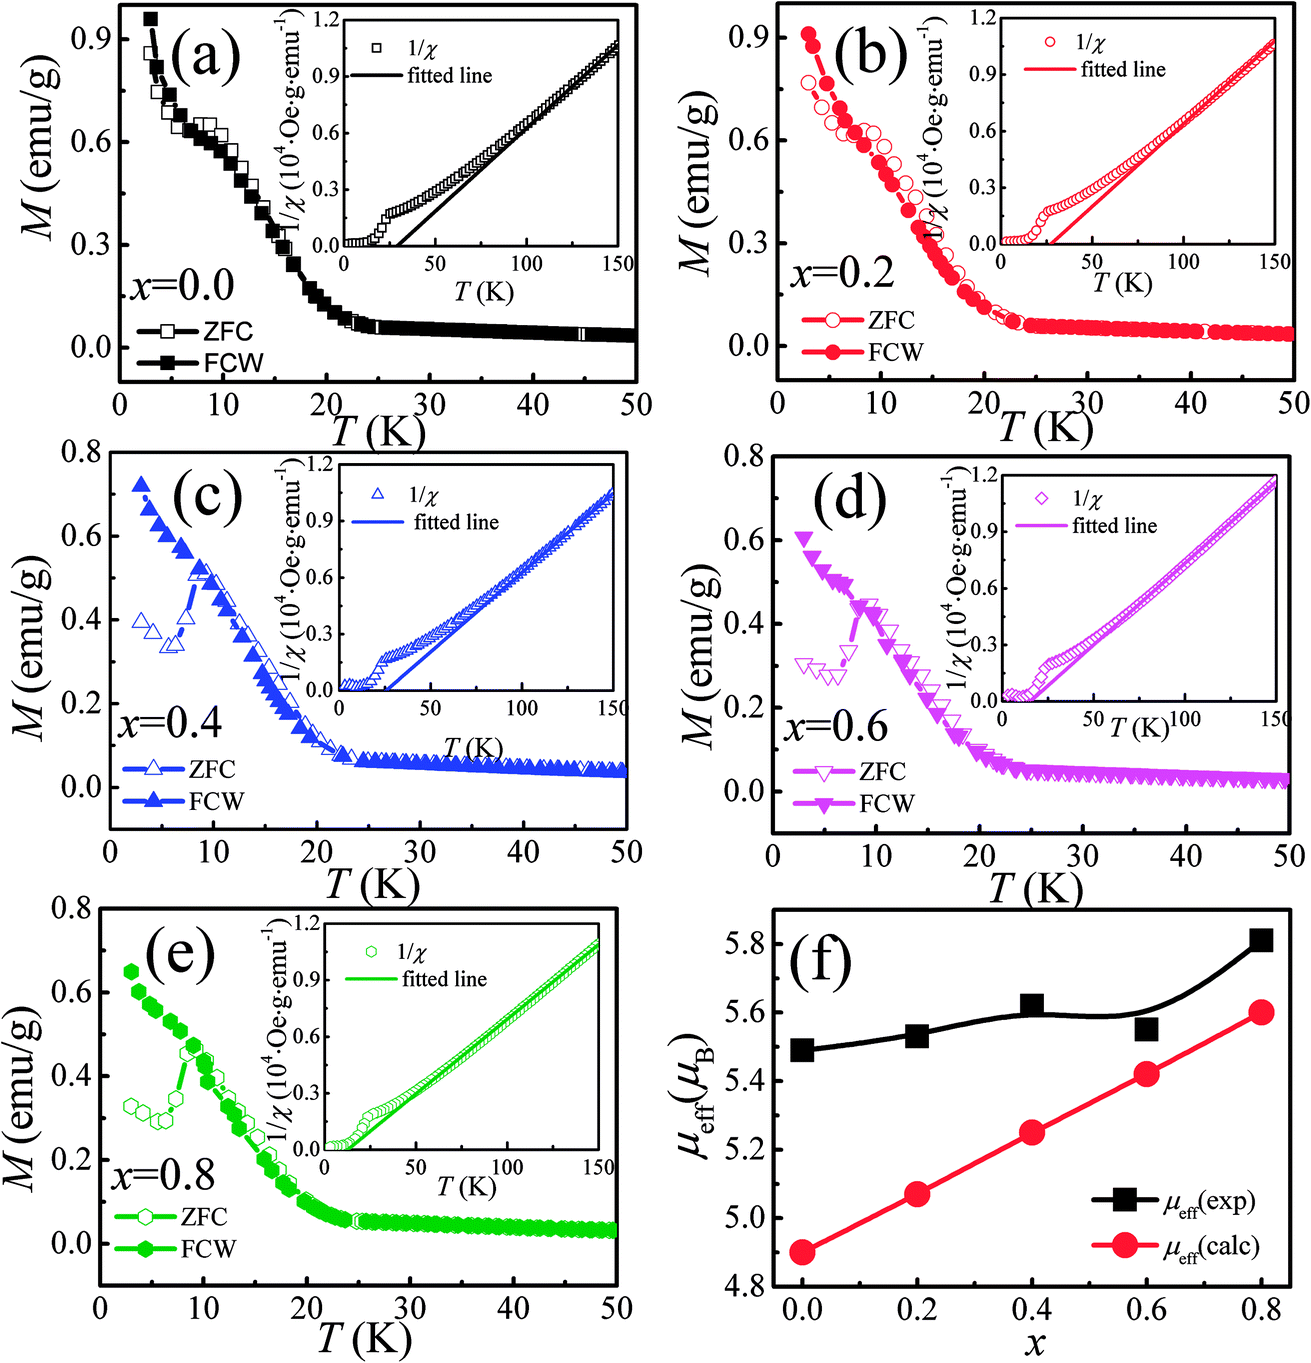 | ||
| Fig. 3 (a)–(e) Temperature dependence of dc magnetization under 100 Oe for Ca3Co2O6−xFx. The open and solid symbols correspond to ZFC and FC curves, respectively. The inset shows the temperature dependence of the inverse dc susceptibility, and the solid lines are the fitting curves obtained using the Curie–Weiss law. (f) The theoretical and experimental μeff versus F-doping content x. | ||
The effective magnetic moment (μeff) obtained as a function of F-doping level x was plotted and is shown in Fig. 3(f). As Fig. 3(f) shows, μeff increases monotonously with the increasing x. As discussed previously, the substitution of F− for O2− should lead to part of the Co3+ ions to transfer into Co2+. In general,7 the Co ions in the Ca3Co2O6 system prefer to be in the HS state at trigonal prism sites (CoI), whereas the Co ions located at the octahedral sites (CoII) are in the LS state because of the different crystalline field. If F-doping leads to Co3+ ions at CoI sites (HS; S = 2) transferring into Co2+ ions (HS; S = 3/2), the value of μeff should decrease with the increase of x, which is contrary to the experimental data obtained. So it was concluded that the ionic transfer induced by F-doping occurred at CoII sites, leading to the increase of μeff. The theoretically expected (spin only) values of the μeff in Ca3Co2O6 system can be expressed as:
 | (1) |
 | (2) |
To thoroughly understand the F-doping effect on the magnetic properties, the magnetic field dependent magnetization (M–H) was measured at 3 K and the results are shown in Fig. 4. As shown in Fig. 4(a)–(e), all the samples show a large hysteresis in the M–H curve, and the magnetization does not become saturated as the magnetic field reaches 4.5 T. There are three magnetization steps which occurred at 1.2, 2.4, and 3.6 T in the initial magnetization curve of Ca3Co2O6, which is related to the quantum tunneling of the magnetization behavior.8 Furthermore, the magnetization step at 3.6 T can be considered further as the formation of a ferrimagnetic state consisting of two-thirds of spin-up ferromagnetic chains and one-third of spin-down chains. To show the evolution of these magnetization steps with F-doping clearly, three dashed lines near these steps are plotted in the figure. Different to the doping effect on Ca-18 or Co-sites,30 F-doping at the O-site does not obviously change the magnetization steps, and the position of the magnetization steps were almost the same for all the samples studied. Although F-doping has little influence on the position of these magnetization steps, the magnetization value of each step decreases with the increase of F-doping content, as shown in Fig. 4(f). As is known, the magnetization existing in this spin-chain compound is a spin and lattice sensitive phenomenon. In the present work, the F-doping does not induce additional spins and the lattice distortion caused by the substitution of F for O is small because of the small ionic radius difference between F− (1.33 Å) and O2− ions (1.4 Å). So the F-doping has a weak influence on these magnetization steps.
 | ||
| Fig. 4 (a)–(e) Field dependence of magnetization at 3 K for Ca3Co2O6−xFx (x = 0, 0.2, 0.4, 0.6, 0.8). (f) The initial magnetization curves for Ca3Co2O6−xFx. | ||
Electrical transport properties
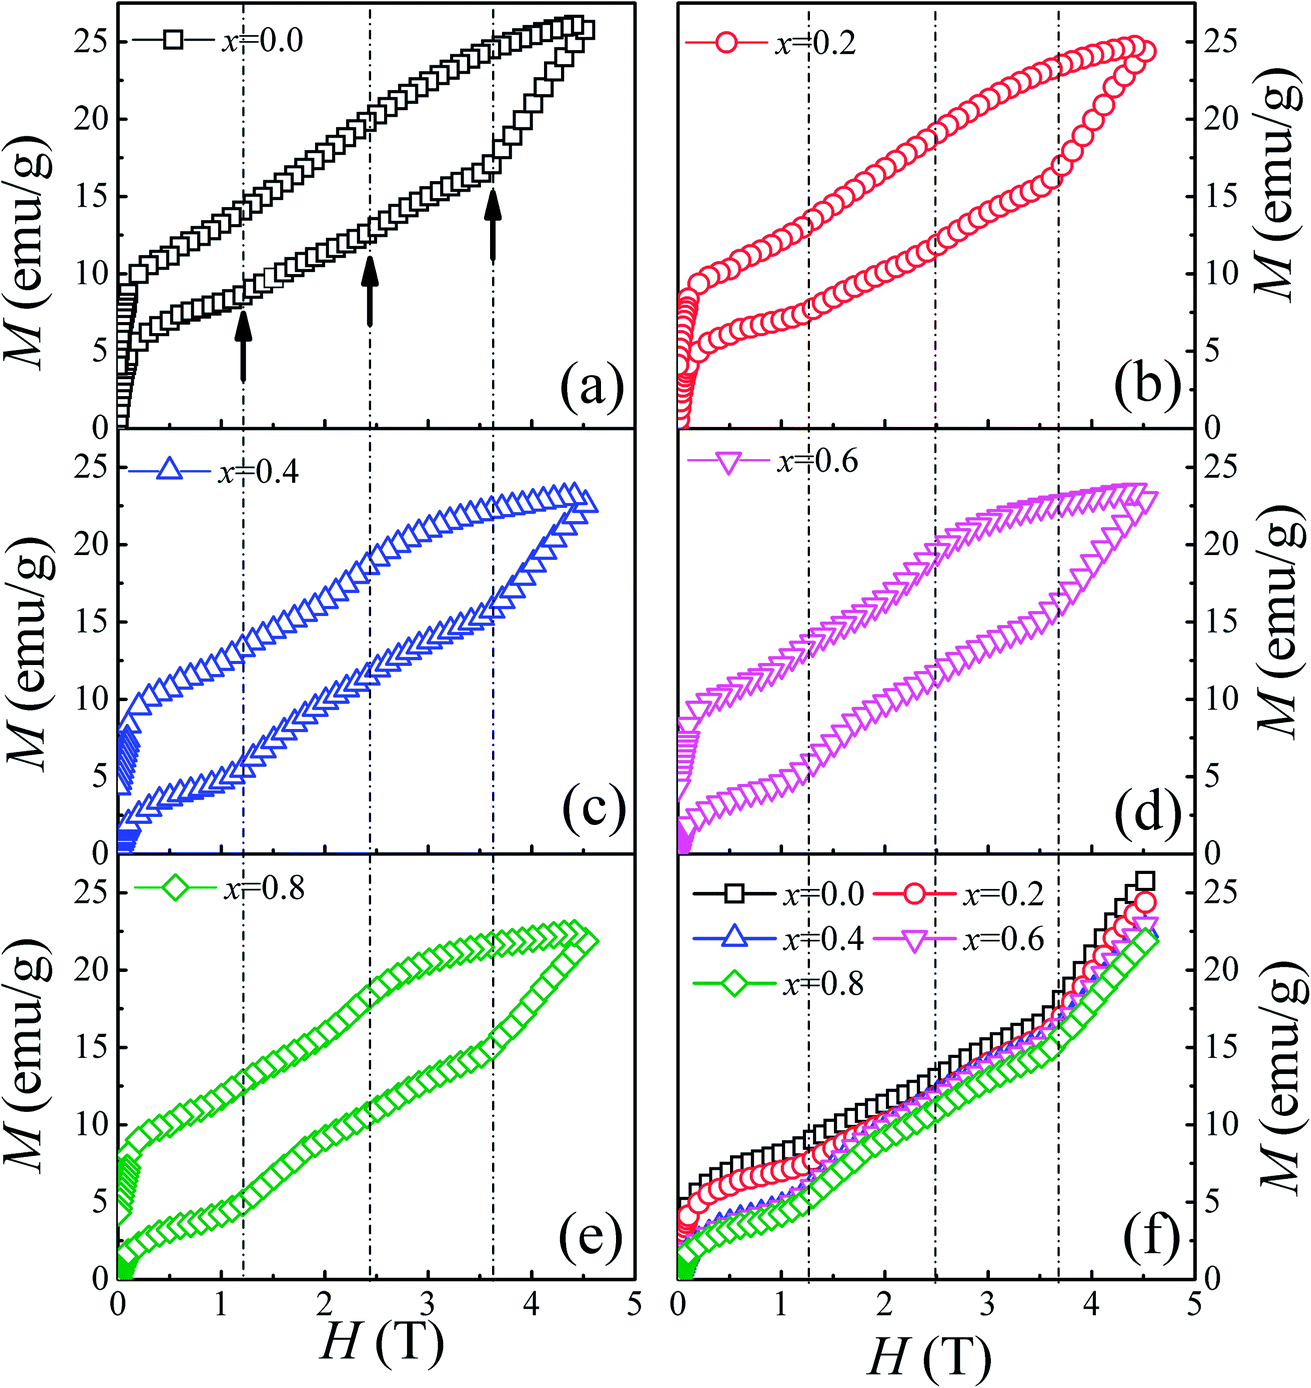
The temperature dependence of the resistivity for Ca3Co2O6−xFx in the temperature range of 170–380 K is shown in Fig. 5(a). All the samples show a similar transport behavior in the temperature range measured. To show the resistivity variation with F-doping clearly, the room temperature resistivity ρ300 K values are listed in Table 1. The room temperature resistivity decreases monotonously with increasing x. In general, the substitution of F− for O2− is considered to be n-type doping, and the carrier concentration should decrease with increasing x for a typical p-type semiconductor, Ca3Co2O6, which is contrary to the experimental results discussed here. To study the origin of the variation of ρ300 K, the Hall measurement was performed for all samples at 300 K. The room temperature Hall coefficient (RH) as a function of x is shown in the inset of Fig. 5(a), and the calculated values of carrier concentration (n*) and carrier mobility (μ) are listed in Table 1. It was found that RH is changed from positive to negative when x increased to 0.4, indicating that the carrier type has changed from a p-type to a n-type. The calculated carrier concentration n* first decreases with increasing x up to 0.2, and then has an increasing trend as x increases further. Unlike the carrier concentration, the mobility of the carrier has an increasing trend with increasing x in the whole range of F-doping levels.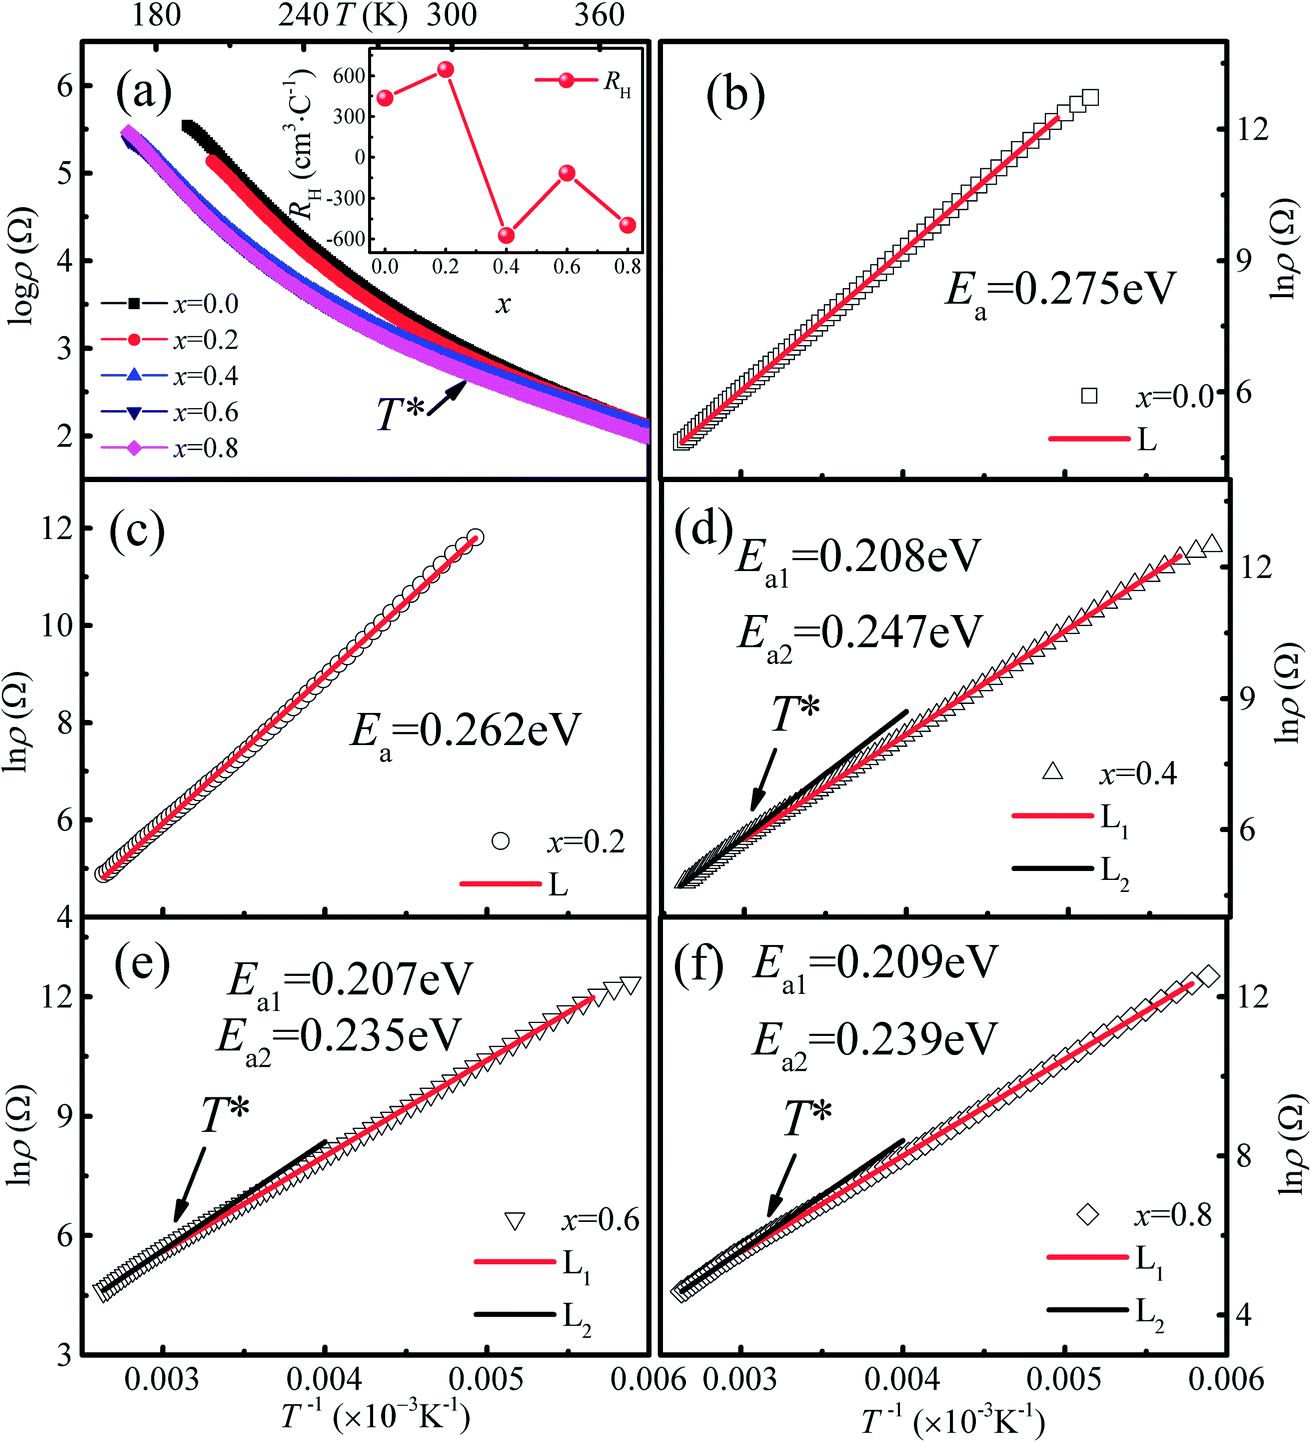 | ||
| Fig. 5 (a) Temperature dependence of resistivity for Ca3Co2O6−xFx. Inset shows the room temperature Hall coefficient (RH) as a function of x. (b–f) The TAC fitting results for the samples with x = 0–0.8. | ||
| x = 0.0 | x = 0.2 | x = 0.4 | x = 0.6 | x = 0.8 | |
|---|---|---|---|---|---|
| ρ300 K (Ω cm) | 1160.7 | 969.3 | 740.1 | 627.8 | 616.5 |
| Ea (eV) | 0.275 | 0.262 | 0.208 | 0.207 | 0.209 |
| RH (102 cm3 C−1) | 4.34 | 6.44 | −5.73 | −1.17 | −5.00 |
| n* (1016 cm−3) | 1.44 | 0.94 | −1.09 | −5.33 | −1.25 |
| μ (10−1 cm2 V−1 s−1) | 3.75 | 6.89 | 7.78 | 1.87 | 8.09 |
| d (μm) | 2.26 | 2.46 | 2.65 | 3.30 | 3.90 |
| S300 K (μV−1 K−1) | 686.6 | 752.7 | −333.1 | −289.3 | −224.7 |
| ΘD (K) | 600.1 | 413.8 | 420.6 | 389.8 | 296.5 |
In order to clarify the transport mechanism of F-doped Ca3Co2O6, fitting of the resistivity data was attempted using the thermal activated (TAC) law:33 ρ = ρ∞![[thin space (1/6-em)]](https://www.rsc.org/images/entities/char_2009.gif) exp(E0/kBT), the adiabatic small polaron hopping model:34 ρ = ATexp(Eρ/kBT), and the Mott variable range hopping model:35 ρ = ρ0exp[(T0/T)1/(1+n)], respectively. For the samples with x ≤ 0.2 (p type), the electrical transport behaviors were described well by the TAC model over the whole of the measured temperature range. Whereas for the samples with x = 0.4, 0.6 and 0.8 (n type), the ρ(T) curves were fitted well using the TAC models with different activation energies (Ea) in two different temperature ranges divided by T* ∼ 320 K. The fitting results are shown in Fig. 5(b)–(f) and the results for the parameter Ea are listed in Table 1.
exp(E0/kBT), the adiabatic small polaron hopping model:34 ρ = ATexp(Eρ/kBT), and the Mott variable range hopping model:35 ρ = ρ0exp[(T0/T)1/(1+n)], respectively. For the samples with x ≤ 0.2 (p type), the electrical transport behaviors were described well by the TAC model over the whole of the measured temperature range. Whereas for the samples with x = 0.4, 0.6 and 0.8 (n type), the ρ(T) curves were fitted well using the TAC models with different activation energies (Ea) in two different temperature ranges divided by T* ∼ 320 K. The fitting results are shown in Fig. 5(b)–(f) and the results for the parameter Ea are listed in Table 1.
Fig. 6(a)–(e) show the SEM images of the cross-section of the samples with x = 0, 0.2, 0.4, 0.6, and 0.8. It can be seen that the surface morphologies for all the samples studied are similar, whereas the particle size increases with increasing x. The mean particle size is estimated from 10 randomly selected particles in the SEM images for each sample. It was found that the values of mean particle size (d) were 2.26, 2.46, 2.65, 3.30, and 3.90 μm for the samples with x = 0, 0.2, 0.4, 0.6, and 0.8, respectively. In addition, the particles become more homogenous and denser with the increase of x. The much larger particle size and denser microstructure in the F-doped samples will promote carrier transport because of the decreased grain boundary scattering and thus the carrier mobility will be enhanced, which was also confirmed by the Hall measurements as mentioned previously. The enhanced carrier mobility may be a key factor for the decrease of resistivity in the F-doped samples. Fig. 6(f) shows the EDS results for a typical sample with x = 0.8. This confirms the presence of Ca, Co, O, F elements and the average atomic ratios are Ca:Co:O:F = 3:1.97:4.95:0.72 when setting the content of Ca as 3. This is roughly consistent with the chemical formula of Ca3Co2O5.2F0.8.
 | ||
| Fig. 6 (a–e) The SEM images for the samples with x = 0, 0.2, 0.4, 0.6, and 0.8, respectively. (f) The EDS results for a typical sample with x = 0.8. | ||
Thermoelectric properties
Fig. 7 shows the temperature dependence of thermopower [S(T)] for Ca3Co2O6Fx samples. The x = 0 and x = 0.2 samples have a positive value of S in the whole of the temperature range studied and the sign of S changed to negative as the F-doping content reached 0.4. The results show that the carrier type can be changed from p-type to n-type using a suitable amount of F-doping. The absolute values of S for all samples show a similar trend in variation: S increases first and then decreases with increasing temperature. The room temperature thermopower S300 K for the un-doped sample is 686.6 μV K−1, which is consistent with a previous report.36 With increasing x, S300 K increases from 686.6 μV K−1 (x = 0) to 752.7 μV K−1 (x = 0.2) and then changes from −333.1 μV K−1 (x = 0.4) to −224.7 μV K−1 (x = 0.8).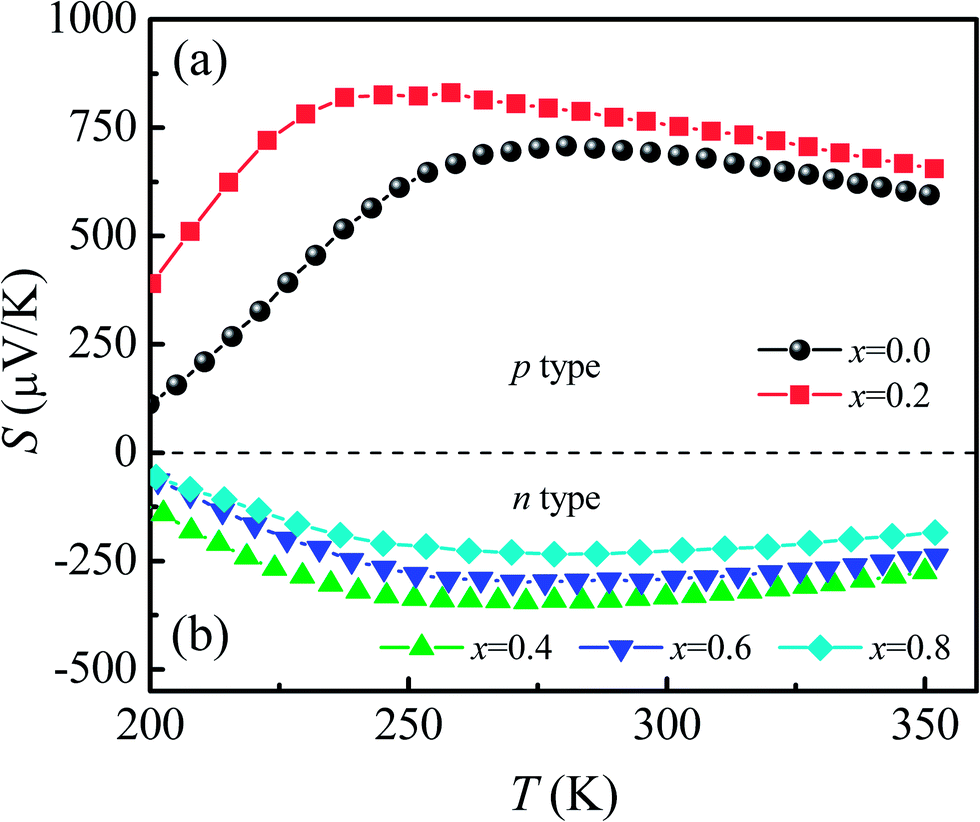 | ||
| Fig. 7 (a) and (b) Temperature dependence of thermopower for Ca3Co2O6−xFx (x = 0, 0.2, 0.4, 0.6, 0.8). | ||
For a general semiconducting material, S can be expressed using the Mott formula:37
 | (3) |
By substituting σ = n*eμ(ε) in eqn (3), one can obtain:
 | (4) |
The temperature dependence of thermal conductivity κ(T) is shown in Fig. 8. All the samples show a similar thermal transport behavior, but the value of κ changed considerably as F was doped into the samples. κ increases with the decrease of T in the temperature range of T > Tp, whereas κ decreases sharply with decreasing T when T < Tp. As shown in the inset of Fig. 8(b), the values of κ at Tp for both n-type and p-type samples decrease monotonously with increasing x, but there exists a sudden increase of thermal conductivity at the critical point where the carrier type changes from p- to n-type, which may be related to decreased grain boundary scattering and the sudden decrease of Ea when x reaches 0.4. Generally, thermal conductivity can be expressed by the sum of phonon thermal conductivity κph and carrier thermal conductivity κcar as: κ = κph + κcar. The value of κcar can be calculated from the Wiedemann–Franz (WF) law: κcar = LT/ρ, where L is the Lorentz number. The calculated κcar in the present system is less than 0.1%. Therefore, the phonon contribution is the main source of total κ in this system. The phonon conductivity can be described as κp ∝ Cvλv0, where Cv, λ, and v0 are the specific heat, mean free path, and mean velocity of phonon, respectively. When T > Tp, the phonon–phonon Umklapp scattering mechanism is dominant in determining the thermal transport behavior and λ can be described as λ ∝ eΘD/αT, where ΘD and α are the Debye temperature and coefficient, respectively. The fitting result shows that κ is mainly determined by λ in the Umklapp scattering process for this system. The values of ΘD obtained for the samples with x = 0.0, 0.2, 0.4, 0.6, and 0.8 are 600.1, 413.8, 420.6, 389.8, and 296.5 K, respectively. In the temperature range below Tp, the phonon–phonon scattering is weak, and λ is determined by the lattice imperfection or the sample dimensions, and the variation of κ is mainly determined by the specific heat, i.e., κ ∝ T3. So κ decreases sharply in the low temperature range.
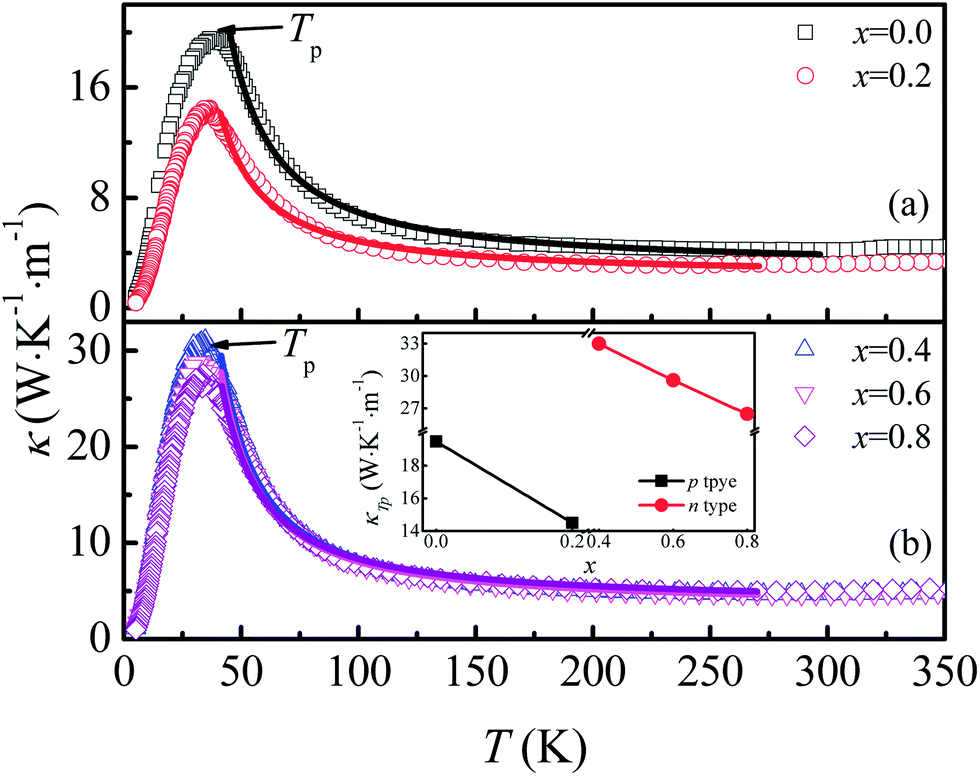 | ||
| Fig. 8 (a) and (b) Temperature dependence of thermal conductivity for Ca3Co2O6−xFx. Inset: thermal conductivity at Tp as a function of x. | ||
Conclusions
In summary, the structural, electrical, magnetic, and TE properties of F-doped Ca3Co2O6 were studied. The magnetic results indicate that some of the Co3+ ions at octahedral sites will change into Co2+ because of the substitution of F− for O2−, and the induced Co2+ ions are antiferromagnetically coupled with the nearest neighbor Co3+. The thermopower and Hall coefficient results show that the carrier type of the series samples can be changed from p- to n-type using a suitable amount of F-doping. The room temperature thermopower changed from a positive value of 752.7 μV K−1 to a negative value of S300 K = −333.1 μV K−1 as x reaches 0.4. The resistivity of both the p-type and n-type samples decreases with increasing F-doping content. The thermal conductivity of both the n-type and p-type samples decrease monotonously with increasing x with a sudden increase at x = 0.4. The sudden increase of the thermal conductivity may be related to the decreased scattering at the grain boundary and the decrease of Ea at the critical point of carrier type change.Acknowledgements
This work is supported by the National Key Basic Research under Contract No. 2011CBA00111, and the National Nature Science Foundation of China under Contract No. U1232140, 11504380 and 11174293.Notes and references
- L. D. Zhao, S. H. Lo, Y. S. Zhang, H. Sun, G. J. Tan, C. Uher, C. Wolverton, V. P. Dravid and M. G. Kanatzidis, Nature, 2014, 508, 373–378 CrossRef CAS PubMed.
- I. Terasaki, Y. Sasago and K. Uchinokura, Phys. Rev. B: Condens. Matter Mater. Phys., 1997, 56, R12685–R12687 CrossRef CAS.
- R. Funahashi and M. Shikano, Appl. Phys. Lett., 2002, 81, 1459–1461 CrossRef CAS.
- A. C. Masset, C. Michel, A. Maignan, M. Hervieu, O. Toulemonde, F. Studer, B. Raveau and J. Hejtmanek, Phys. Rev. B: Condens. Matter Mater. Phys., 2000, 62, 166–175 CrossRef CAS.
- M. Mikami, R. Funahashi, M. Yoshimura, Y. Mori and T. Sasaki, J. Appl. Phys., 2003, 94, 6579–6582 CrossRef CAS.
- H. Fjellvag, E. Gulbrandsen, S. Aasland, A. Olsen and B. C. Hauback, J. Solid State Chem., 1996, 124, 190–194 CrossRef CAS.
- E. V. Sampathkumaran, N. Fujiwara, S. Rayaprol, P. K. Madhu and Y. Uwatoko, Phys. Rev. B: Condens. Matter Mater. Phys., 2004, 70, 014437 CrossRef.
- A. Maignan, V. Hardy, S. Hebert, M. Drillon, M. R. Lees, O. Petrenko, D. Mc, K. Paul and D. Khomskii, J. Mater. Chem., 2004, 14, 1231–1234 RSC.
- K. Yamada, Z. Honda, J. Luo and H. Katori, J. Alloys Compd., 2006, 423, 188–190 CrossRef CAS.
- T. Basu, K. K. lyer, K. Singh, K. Mukherjee, P. L. Paulose and E. V. Sampathkumaran, Appl. Phys. Lett., 2014, 105, 102912 CrossRef.
- S. D. Kaushik, S. Rayaprol, J. Saha, N. Mohapatra, V. Siruguri, P. D. Babu, S. Patnaik and E. V. Sampathkumaran, J. Appl. Phys., 2010, 108, 084106 CrossRef.
- J. Takahashi, H. Yamane and M. Shimada, Jpn. J. Appl. Phys., 2004, 43, L331–L333 CrossRef CAS.
- J. Takahashi, M. Shimada and H. Yamane, Phys. Status Solidi A, 2006, 203, 2836–2840 CrossRef CAS.
- J. Takahashi, M. Shimada, K. Iwasaki and H. Yaname, J. Electroceram., 2006, 17, 95–98 CrossRef CAS.
- M. Senthilkumar and R. Vijayaraghavan, Sci. Technol. Adv. Mater., 2009, 10, 015007 CrossRef PubMed.
- S. Hebert, D. Flahaut, C. Martin, S. Lemonnier, J. Noudem, C. Goupil, A. Maignan and J. Hejtmanek, Prog. Solid State Chem., 2007, 35, 457–467 CrossRef CAS.
- S. Rayaprol, S. D. Kaushik, K. K. lyer and E. V. Sampathkumaran, Solid State Commun., 2015, 223, 67–73 CrossRef CAS.
- S. Rayaprol and E. V. Sampathkumaran, Pramana, 2005, 65, 491–500 CrossRef CAS.
- P. L. Paulose, N. Mohapatra and E. V. Sampathkumaran, Phys. Rev. B: Condens. Matter Mater. Phys., 2008, 77, 172403 CrossRef.
- H. Kageyama, K. Yoshimura, K. Kosuge, M. Azuma, M. Takano, H. Mitamura and T. Goto, J. Phys. Soc. Jpn., 1997, 66, 3996–4000 CrossRef CAS.
- R. Moubah, S. Colis, G. Schmerber, J. Petersen and A. Dinia, Appl. Phys. Lett., 2009, 94, 141907 CrossRef.
- B. J. Tan, K. J. Klabunde and P. M. A. Sherwood, J. Am. Chem. Soc., 1991, 113, 855–861 CrossRef CAS.
- M. Oku and K. Hirokawa, J. Electron Spectrosc. Relat. Phenom., 1976, 8, 457–481 CrossRef.
- G. Mattogno, C. Ferragina, M. A. Massucci, P. Patrono and A. La Ginestra, J. Electron Spectrosc. Relat. Phenom., 1988, 46, 285–295 CrossRef CAS.
- K. Takubo, T. Mizokawa, S. Hirata, J. Y. Son, A. Fujimori, D. Topwal, D. D. Sarma, S. Rayaprol and E. V. Sampathkumaran, Phys. Rev. B: Condens. Matter Mater. Phys., 2005, 71, 073406 CrossRef.
- S. Agrestini, C. L. Fleck, L. C. Chapon, C. Mazzoli, A. Bombardi, M. R. Lees and O. A. Petrenko, Phys. Rev. Lett., 2011, 106, 197204 CrossRef CAS PubMed.
- P. Lampen, N. S. Bingham, M. H. Phan, H. Srikanth, H. T. Yi and S. W. Cheong, Phys. Rev. B: Condens. Matter Mater. Phys., 2014, 89, 144414 CrossRef.
- J. Paddison, S. Agrestini, M. R. Lees, C. L. Fleck, P. P. Deen, A. L. Goodwin, J. R. Stewart and O. A. Petrenko, Phys. Rev. B: Condens. Matter Mater. Phys., 2014, 90, 014411 CrossRef.
- S. Takeshita, T. Goko, J. Arai and K. Nishiyama, J. Phys. Chem. Solids, 2007, 68, 2174–2177 CrossRef CAS.
- A. Jain, S. Singh and S. M. Yusuf, Phys. Rev. B: Condens. Matter Mater. Phys., 2006, 74, 174419 CrossRef.
- S. Aasland, H. Fjellvag and B. Hauback, Solid State Commun., 1997, 101, 187–192 CrossRef CAS.
- H. Wu, M. W. Haverkort, Z. Hu, D. I. Khomskii and L. H. Tjeng, Phys. Rev. Lett., 2005, 95, 186401 CrossRef PubMed.
- Y. N. Huang, B. C. Zhao, S. Lin, W. H. Song and Y. P. Sun, J. Appl. Phys., 2013, 114, 093709 CrossRef.
- M. Lubini, E. Chinarro, B. Moreno, V. C. de Sousa, A. K. Alves and C. P. Bergmann, J. Phys. Chem. C, 2016, 120, 64–69 CAS.
- Y. Wang, Y. Sui, P. Ren, L. Wang, X. J. Wang, W. H. Su and H. J. Fan, Chem. Mater., 2010, 22, 1155–1163 CrossRef CAS.
- K. Iwasaki, H. Yamane, S. Kubota, J. Takahashi and M. Shimada, J. Alloys Compd., 2003, 358, 210–215 CrossRef CAS.
- B. Fisher, L. Patlagan, G. M. Reisner and A. Knizhnik, Phys. Rev. B: Condens. Matter Mater. Phys., 2000, 61, 470–475 CrossRef CAS.
| This journal is © The Royal Society of Chemistry 2017 |