 Open Access Article
Creative Commons Attribution 3.0 Unported Licence
Ark shell protein hydrolysates inhibit adipogenesis in mouse mesenchymal stem cells through the down-regulation of transcriptional factors
Jun-Ho Hyung†
a,
Chang-Bum Ahn†b and
Jae-Young Je *a
*a
aDepartment of Marine-Bio Convergence Science, Pukyong National University, Busan 48547, Republic of Korea. E-mail: jjy1915@pknu.ac.kr; Fax: +82-51-629-6865; Tel: +82-51-629-6871
bDivision of Food and Nutrition, Chonnam National University, Gwangju 61186, Republic of Korea
First published on 18th January 2017
Abstract
Bioactive peptides have positive effects on human health, including antioxidant, antihypertensive, and antimicrobial. The aim of this study is to produce anti-adipogenic bioactive peptides from ark shell protein and to evaluate the mechanisms that inhibit adipogenesis in mesenchymal stem cells (MSCs). Exposure of ark shell protein hydrolysates (ASPH) produced at a pepsin/substrate ratio of 1![[thin space (1/6-em)]](https://www.rsc.org/images/entities/char_2009.gif) :
:![[thin space (1/6-em)]](https://www.rsc.org/images/entities/char_2009.gif) 500 to 240 min hydrolysis led to a decrease in the intracellular lipid accumulation and increase in lipolysis. Molecular weight fractionation revealed that ASPH III exerts the highest inhibitory effect on the intracellular lipid accumulation and increases lipolysis. At the molecular level, ASPH III significantly inhibits adipogenesis by down-regulating the adipocyte-specific protein expression including peroxisome proliferator-activated receptor γ (PPAR γ), CCAAT/enhancer-binding protein α (C/EBP α), and sterol regulatory element-binding protein 1c (SREBP 1c), as well as downstream lipoprotein lipase (LPL) and fatty acid synthase (FAS) expression. Moreover, treatment with ASPH III increases hormone-sensitive lipase (HSL) and leptin expression in the differentiated adipocytes from MSCs.
500 to 240 min hydrolysis led to a decrease in the intracellular lipid accumulation and increase in lipolysis. Molecular weight fractionation revealed that ASPH III exerts the highest inhibitory effect on the intracellular lipid accumulation and increases lipolysis. At the molecular level, ASPH III significantly inhibits adipogenesis by down-regulating the adipocyte-specific protein expression including peroxisome proliferator-activated receptor γ (PPAR γ), CCAAT/enhancer-binding protein α (C/EBP α), and sterol regulatory element-binding protein 1c (SREBP 1c), as well as downstream lipoprotein lipase (LPL) and fatty acid synthase (FAS) expression. Moreover, treatment with ASPH III increases hormone-sensitive lipase (HSL) and leptin expression in the differentiated adipocytes from MSCs.
1 Introduction
Obesity is considered a global health problem and is characterized by excessive white adipose tissue (WAT) accumulation due to excessive nutrient intake and less energy expenditure.1 Obesity is strongly associated with metabolic syndrome, including insulin resistance, type 2 diabetes, hypertension, hyperlipidaemia, and atherosclerosis.2 It is often caused by both an increased cell size (hypertrophy) and increased number of adipocytes (hyperplasia), which in turn depends on the differentiation of preadipocytes.3 Adipogenesis is the differentiation process of preadipocytes into mature adipocytes and plays a key role in fat metabolism.4 Several stages, including mesenchymal precursor, committed preadipocyte, growth-arrested preadipocyte, mitotic clonal expansion, terminal differentiation, and mature adipocyte, are involved in adipogenesis. These stages require sequential activation of many transcriptional factors including peroxisome proliferator-activated receptor γ (PPAR γ) and CCAAT/enhancer-binding proteins (C/EBPs).5,6 Therefore, regulation of adipocyte differentiation by suitable substances could be an effective strategy for the preventive and/or therapeutic treatment of obesity and related diseases.The health benefits of seafood consumption have been established in the reports, and some of these benefits include antioxidant, antihypertensive, anticancer, and anti-inflammatory.7–10 During the past decade, numerous bioactive compounds, such as peptides, polysaccharides, and pigments, were isolated from marine organisms and utilized in food and pharmaceutical industries.10 Among these, bioactive peptides have received significant attention due to their multifunctional bioactivities. Numerous bioactive peptides from fish and shellfish proteins were isolated and purified, and the most well-characterized bioactivities were antioxidant and antihypertensive.11 In our previous study, we produced ark shell (Scapharca subcrenata) protein hydrolysate (APSH) and demonstrated that ASPH with a low molecular weight exerted osteogenic activity in the mesenchymal stem cells (MSCs).12 MSCs can differentiate into adipocytes or osteoblasts and the differentiation is competitively balanced. Mechanisms that promote osteogenesis actively suppress the mechanisms that induce adipogenesis.13 Therefore, we hypothesize that ASPH might inhibit adipogenesis. In this study, we examined the anti-adipogenic effects of ASPH and further uncovered their underlying mechanisms using MSCs.
2 Materials and methods
2.1. Materials
Ark shell was purchased from a local market (Sunchen, Korea) and the protein content of the ark shell was 68.24% (dry basis), as determined by the Kjeldahl method. Primary and secondary antibodies were obtained from Santa Cruz Biotechnology (Santa Cruz, CA, USA). Murine mesenchymal stem cells (MSCs, CRL-12424) were purchased from the American Type Culture Collection (ATCC, Manassas, VA, USA). Pepsin (1![[thin space (1/6-em)]](https://www.rsc.org/images/entities/char_2009.gif) :
:![[thin space (1/6-em)]](https://www.rsc.org/images/entities/char_2009.gif) 10
10![[thin space (1/6-em)]](https://www.rsc.org/images/entities/char_2009.gif) 000) was obtained from Junsei Chemical Co. Ltd. (Tokyo, Japan). Free glycerol reagent was purchased from Sigma Chemical Co. (St. Louis, MO, USA).
000) was obtained from Junsei Chemical Co. Ltd. (Tokyo, Japan). Free glycerol reagent was purchased from Sigma Chemical Co. (St. Louis, MO, USA).
2.2. Enzymatic hydrolysis of the ark shell protein
Before enzymatic hydrolysis, the ark shell was washed using tap water and boiled at 100 °C for 10 min followed by freeze drying and pulverization. Using different pepsin/substrate ratios (1![[thin space (1/6-em)]](https://www.rsc.org/images/entities/char_2009.gif) :
:![[thin space (1/6-em)]](https://www.rsc.org/images/entities/char_2009.gif) 100, 1
100, 1![[thin space (1/6-em)]](https://www.rsc.org/images/entities/char_2009.gif) :
:![[thin space (1/6-em)]](https://www.rsc.org/images/entities/char_2009.gif) 500, and 1
500, and 1![[thin space (1/6-em)]](https://www.rsc.org/images/entities/char_2009.gif) :
:![[thin space (1/6-em)]](https://www.rsc.org/images/entities/char_2009.gif) 1000), ark shell protein was hydrolyzed for 2 h at 37 °C and pH 2, and then the reaction was stopped by boiling at 100 °C for 10 min. The produced ark shell protein hydrolysate (ASPH) was evaluated for its anti-obesity effect in MSCs by Oil red O staining. Subsequently, another hydrolysis was conducted for 0.5, 1, 2, 4, and 6 h to select the optimal hydrolysis time. Finally, ASPH produced at the optimal pepsin/substrate ratio and hydrolysis time was separated into ASPH I (passed through a 10 kDa membrane but not 3 kDa), ASPH II (passed through a 3 kDa membrane but not 1 kDa), and ASPH III (passed through a 1 kDa membrane) fractions using molecular weight cut-off membranes.
1000), ark shell protein was hydrolyzed for 2 h at 37 °C and pH 2, and then the reaction was stopped by boiling at 100 °C for 10 min. The produced ark shell protein hydrolysate (ASPH) was evaluated for its anti-obesity effect in MSCs by Oil red O staining. Subsequently, another hydrolysis was conducted for 0.5, 1, 2, 4, and 6 h to select the optimal hydrolysis time. Finally, ASPH produced at the optimal pepsin/substrate ratio and hydrolysis time was separated into ASPH I (passed through a 10 kDa membrane but not 3 kDa), ASPH II (passed through a 3 kDa membrane but not 1 kDa), and ASPH III (passed through a 1 kDa membrane) fractions using molecular weight cut-off membranes.
2.3. Cell culture and differentiation
Murine MSCs were cultured in Dulbecco's Modified Eagle's Medium (DMEM) supplemented with 10% fetal bovine serum (FBS) and 1% penicillin/streptomycin at 37 °C under a 5% CO2 atmosphere. Confluent MSCs were exposed to differentiation medium (DMEM supplemented with 0.5 mM 3-isobutyl-1-methylxanthine, 5 μM dexamethasone, 5 μg mL−1 insulin, and 10% FBS) for 2 days. The medium was then changed with DMEM containing 10% FBS and 5 μg mL−1 insulin every 2 days.2.4. Oil red O staining
Murine MSCs were differentiated as described above in the presence or absence of ASPH III. After 7 or 21 days, cells were washed twice with phosphate buffered saline (PBS, pH 7.4) and fixed with 10% formalin in PBS for 1 h at room temperature. The cells were then washed with 60% isopropanol. Finally, the cells were stained with a filtered Oil red O working solution (3 parts 0.5% Oil red O in isopropanol + 2 parts H2O) for at least 1 h. The cells were washed twice with distilled water, and then the images were obtained using a digital camera. The stained Oil red O was dissolved in isopropanol and the absorbance was measured at 510 nm.2.5. Cell viability
Murine MSCs were seeded at 4 × 10³ cells per well in a 96-well plate and incubated in DMEM supplemented with 10% FBS until confluence. The MSCs were then incubated with ASPH for 48 h. MTT solution was added, and the cells were incubated for 4 h. The formazan crystals were dissolved in dimethyl sulfoxide and the absorbance was measured at 540 nm.2.6. Lipolysis measurement
Lipolysis was evaluated by measuring free glycerol release into the cultured medium. Murine MSCs were differentiated as described above. Cells were then treated with the sample for 24 h. The free glycerol concentration in the medium was determined using free glycerol reagent according to the manufacturer's instructions.2.7. Protein extraction and Western blot analysis
Murine MSCs were differentiated in the presence or absence of ASPH III. After 7 days, cells were washed three times with PBS, and then lysed with RIPA lysis buffer (Sigma Chemical Co.) supplemented with protease and phosphatase inhibitor (Roche Applied Science, IN, USA). Proteins were loaded on SDS-PAGE and transferred to PVDF membranes. The membranes were blocked with 5% skim milk and incubated with specific primary antibodies (overnight at 4 °C) followed by horseradish peroxidase-conjugated secondary antibodies. The bands were visualized using the ECL™ Western blotting detection kit (Pierce Biotechnology, IL, USA).2.8. Characterization of the ASPH III fraction
The amino acid composition was analyzed by an amino acid autoanalyzer (S430-H, Sykam GmbH, Germany) using a cation separation column (LCA K06/Na, 4.6 × 150 mm). Peptide concentration was determined using the Pierce™ Quantitative Colorimetric Peptide assay kit (Thermo Fisher Scientific, IL, USA). Molecular weight distribution was scanned using an Ultra-High Resolution Q-TOF Mass Spectrometer (Bruker Daltonics, Germany).2.9. Statistical analysis
All experiments were conducted in triplicate and the results are expressed as mean ± standard deviation. The statistical difference was analyzed by one-way analysis of variance followed by Duncan's test using the PASW Statistics 19.0 software (SPSS, Chicago, IL, USA). A P-value <0.05 is considered statistically significant.3 Results
3.1. Ark shell protein hydrolysate (ASPH) inhibits adipogenesis and enhances lipolysis in MSCs
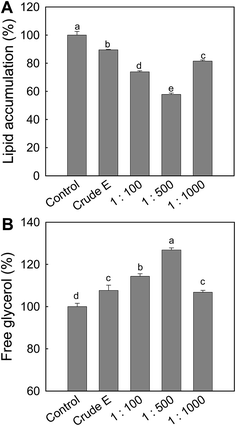
To obtain ASPH with an anti-adipogenesis effect, ark shell protein was hydrolyzed at various pepsin/substrate ratios for 120 min, followed by measuring the effect of the resulting ASPHs on the intracellular lipid accumulation and lipolysis in the differentiated adipocytes from MSCs. As shown in Fig. 1A, the effect of the resulting ASPHs on the intracellular lipid accumulation varied and the ASPH obtained at the pepsin/substrate ratio of 1![[thin space (1/6-em)]](https://www.rsc.org/images/entities/char_2009.gif) :
:![[thin space (1/6-em)]](https://www.rsc.org/images/entities/char_2009.gif) 500 exerted a higher inhibitory effect on the intracellular lipid accumulation than the ASPHs produced at the pepsin/substrate ratios of 1
500 exerted a higher inhibitory effect on the intracellular lipid accumulation than the ASPHs produced at the pepsin/substrate ratios of 1![[thin space (1/6-em)]](https://www.rsc.org/images/entities/char_2009.gif) :
:![[thin space (1/6-em)]](https://www.rsc.org/images/entities/char_2009.gif) 100 and 1
100 and 1![[thin space (1/6-em)]](https://www.rsc.org/images/entities/char_2009.gif) :
:![[thin space (1/6-em)]](https://www.rsc.org/images/entities/char_2009.gif) 1000. In addition, the free glycerol content in the media was determined and the release of free glycerol was significantly increased by treatment with ASPH obtained using the pepsin/substrate ratio of 1
1000. In addition, the free glycerol content in the media was determined and the release of free glycerol was significantly increased by treatment with ASPH obtained using the pepsin/substrate ratio of 1![[thin space (1/6-em)]](https://www.rsc.org/images/entities/char_2009.gif) :
:![[thin space (1/6-em)]](https://www.rsc.org/images/entities/char_2009.gif) 500 (Fig. 1B).
500 (Fig. 1B).
Next, another hydrolysis with the fixed pepsin/substrate ratio (1![[thin space (1/6-em)]](https://www.rsc.org/images/entities/char_2009.gif) :
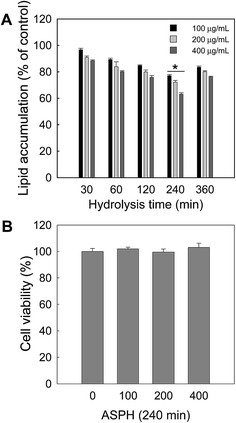
:![[thin space (1/6-em)]](https://www.rsc.org/images/entities/char_2009.gif) 500) but varying hydrolysis time (30, 60, 120, 240, and 360 min) was conducted to determine the optimal hydrolysis time. After hydrolysis, the resulting ASPHs were subjected to the anti-adipogenesis assay. As shown in Fig. 2A, intracellular lipid accumulation was decreased by an exposure to the ASPH produced after hydrolysis for 240 min. The cytotoxicity of the ASPH obtained at 1
500) but varying hydrolysis time (30, 60, 120, 240, and 360 min) was conducted to determine the optimal hydrolysis time. After hydrolysis, the resulting ASPHs were subjected to the anti-adipogenesis assay. As shown in Fig. 2A, intracellular lipid accumulation was decreased by an exposure to the ASPH produced after hydrolysis for 240 min. The cytotoxicity of the ASPH obtained at 1![[thin space (1/6-em)]](https://www.rsc.org/images/entities/char_2009.gif) :
:![[thin space (1/6-em)]](https://www.rsc.org/images/entities/char_2009.gif) 500 (pepsin/substrate) after 240 min hydrolysis was evaluated by the MTT assay and no cytotoxicity was observed (Fig. 2B). Therefore, we selected the optimal hydrolysis conditions as the pepsin/substrate ratio of 1
500 (pepsin/substrate) after 240 min hydrolysis was evaluated by the MTT assay and no cytotoxicity was observed (Fig. 2B). Therefore, we selected the optimal hydrolysis conditions as the pepsin/substrate ratio of 1![[thin space (1/6-em)]](https://www.rsc.org/images/entities/char_2009.gif) :
:![[thin space (1/6-em)]](https://www.rsc.org/images/entities/char_2009.gif) 500 and hydrolysis time of 240 min.
500 and hydrolysis time of 240 min.
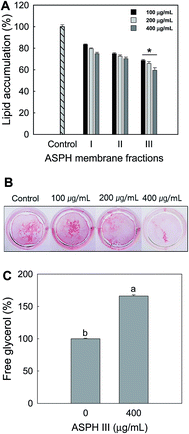
To investigate the effect of molecular weight of ASPH on the adipogenesis, the ASPH produced under the selected conditions was further fractionated into ASPH I, II, and III fractions using molecular weight cut-off. After incubation for 7 days, Oil red O staining was conducted and quantified. The ASPH membrane fractions dose-dependently inhibited the intracellular lipid accumulation in the differentiated adipocyte from MSCs and ASPH III exerted the highest inhibitory activity (Fig. 3A). The Oil red O staining (Fig. 3B) further confirmed that ASPH III significantly suppressed the intracellular lipid accumulation on day 21. We also measured the release of free glycerol after treatment with ASPH III (400 μg mL−1) and the free glycerol content in the differentiated adipocyte from MSCs was increased to 166.09% than that of the non-treated cells (Fig. 3C). Thus, we further investigated whether ASPH III could regulate adipocyte differentiation-related transcription factors and enzymes in the differentiated adipocytes from MSCs.
3.2. Effect of ASPH III on the expression of adipocyte differentiation-related transcription factors
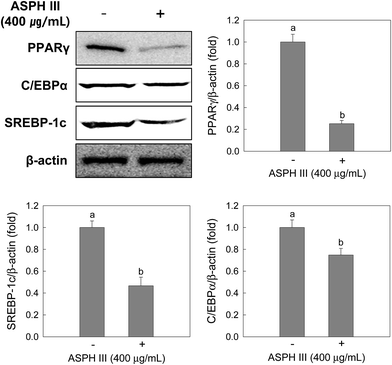
After incubation with ASPH III (400 μg mL−1) for 7 days, protein extracts were subjected to Western blot analysis and three transcription factors, including PPAR γ, C/EBPs, and SREBP-1, were analyzed. As depicted in Fig. 4, the expression of PPAR γ, C/EBPs, and SREBP-1 was dramatically reduced by treatment with ASPH III compared to that of those in the non-treated cells and the reductions were 0.25-fold (PPAR γ), 0.75-fold (C/EBPs), and 0.47-fold (SREBP-1).3.3. Effect of ASPH III on the expression of LPL, FAS, HSL, and leptin
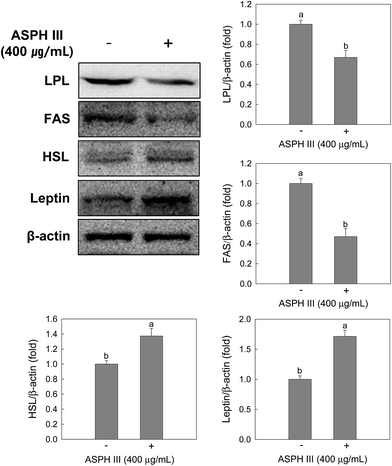
Since intracellular lipid accumulation was significantly reduced by treatment with ASPH III, we next determined whether ASPH III suppresses lipid metabolic proteins, such as LPL, FAS, and HSL, and adipokines, such as leptin, during adipocyte differentiation. As expected, treatment with ASPH III down-regulated LPL and FAS expression, whereas increased the expression of HSL (Fig. 5). This is consistent with the expression of transcription factors and lipolysis results, as shown in Fig. 3C and 4. In addition, treatment with ASPH III increased the expression of leptin in the differentiated MSCs (Fig. 5).3.4. Amino acid profile, peptide concentration, and molecular weight distribution of ASPH III
As shown in Table 1, ASPH III produced at the pepsin/substrate ratio of 1![[thin space (1/6-em)]](https://www.rsc.org/images/entities/char_2009.gif) :
:![[thin space (1/6-em)]](https://www.rsc.org/images/entities/char_2009.gif) 500 after 240 min hydrolysis contained higher amounts of glutamic acid, aspartic acid, arginine, and glycine. The amino acid profile of ASPH III is similar to that reported in our previous study and shows that ark shell is rich in glutamic acid, aspartic acid, and arginine.12
500 after 240 min hydrolysis contained higher amounts of glutamic acid, aspartic acid, arginine, and glycine. The amino acid profile of ASPH III is similar to that reported in our previous study and shows that ark shell is rich in glutamic acid, aspartic acid, and arginine.12
![[thin space (1/6-em)]](https://www.rsc.org/images/entities/char_2009.gif) :
:![[thin space (1/6-em)]](https://www.rsc.org/images/entities/char_2009.gif) 500 after 240 min hydrolysis
500 after 240 min hydrolysis
| ASPH III | |
|---|---|
| Aspartic acid | 3.34 ± 0.09 |
| Threonine | 1.12 ± 0.08 |
| Serine | 1.05 ± 0.07 |
| Glutamic acid | 3.57 ± 0.13 |
| Proline | 0.70 ± 0.10 |
| Glycine | 1.92 ± 0.11 |
| Alanine | 1.79 ± 0.15 |
| Valine | 1.10 ± 0.09 |
| Methionine | 0.72 ± 0.05 |
| Isoleucine | 0.67 ± 0.10 |
| Leucine | 1.42 ± 0.16 |
| Tyrosine | 0.92 ± 0.13 |
| Phenylalanine | 0.99 ± 0.10 |
| Histidine | 0.47 ± 0.11 |
| Lysine | 1.11 ± 0.08 |
| Arginine | 1.94 ± 0.11 |
We also determined the peptide concentration in ASPH III using a modified bicinchoninic acid assay since other molecules could affect the observed effect. The result showed that ASPH III contained over 96% peptides, which indicates that small peptides exert an anti-adipogenic effect.
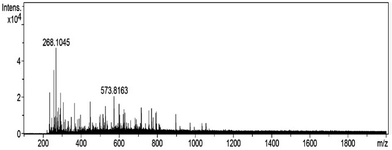
The molecular weight distribution of ASPH III was also determined using Q-TOF mass spectrometry (Fig. 6). The result shows that ASPH III possesses major peptides in the range of 235.17–897.52 Da and there are no single amino acids in ASPH III.
4 Discussion
Proteins from marine organisms are valuable sources of bioactive peptides that can be used as ingredients in functional foods and/or nutraceuticals. The development of functional foods/nutraceuticals containing bioactive peptides with potential health benefits has received considerable attention in recent years.14 Our previous study has shown that ASPH III produced at the pepsin/substrate ratio of 1![[thin space (1/6-em)]](https://www.rsc.org/images/entities/char_2009.gif) :
:![[thin space (1/6-em)]](https://www.rsc.org/images/entities/char_2009.gif) 500 after 120 min hydrolysis exerts osteoblastogenic activity in MSCs.12 MSCs can differentiate into not only osteoblasts but also adipocytes. Factors that promote osteoblastogenesis inhibit adipocyte formation in the bone-marrow derived MSCs.15 Therefore, in this study, we produced bioactive peptides with an anti-adipogenic effect from ark shell by enzymatic hydrolysis since ASPHs promote osteoblastogenesis in MSCs. According to our previously described method,12 enzymatic hydrolysis was conducted to produce bioactive peptides from ark shell and we found that ASPH III produced at the pepsin/substrate ratio of 1
500 after 120 min hydrolysis exerts osteoblastogenic activity in MSCs.12 MSCs can differentiate into not only osteoblasts but also adipocytes. Factors that promote osteoblastogenesis inhibit adipocyte formation in the bone-marrow derived MSCs.15 Therefore, in this study, we produced bioactive peptides with an anti-adipogenic effect from ark shell by enzymatic hydrolysis since ASPHs promote osteoblastogenesis in MSCs. According to our previously described method,12 enzymatic hydrolysis was conducted to produce bioactive peptides from ark shell and we found that ASPH III produced at the pepsin/substrate ratio of 1![[thin space (1/6-em)]](https://www.rsc.org/images/entities/char_2009.gif) :
:![[thin space (1/6-em)]](https://www.rsc.org/images/entities/char_2009.gif) 500 after 240 min hydrolysis largely inhibited the intracellular lipid accumulation during the differentiation of MSCs into adipocytes for 7 days (Fig. 1–3).
500 after 240 min hydrolysis largely inhibited the intracellular lipid accumulation during the differentiation of MSCs into adipocytes for 7 days (Fig. 1–3).
A number of enzymes are involved in adipocyte lipogenesis. Lipid accumulation in adipose tissue occurs by the re-esterification of free fatty acid with glycerol to form triglycerides or de novo lipogenesis.16 Free fatty acid is derived from the hydrolysis of very low density lipoproteins by LPL, which is the master regulator of fatty acid uptake, and FAS synthesizes palmitate (C 16:0) from acetyl- and malonyl-CoA through a multi-step reaction.16,17 It is reported that LPL and FAS expression by adipocyte is necessary for intracellular lipid accumulation.17 As demonstrated in Fig. 1–3, we assume that the inhibition of intracellular lipid accumulation by ASPH III might be linked to the expression of lipogenesis-related enzymes, including LPL and FAS. As expected, treatment with ASPH III significantly reduced the expression of LPL and FAS. We further investigated the effect of ASPH III on lipolysis, which is defined as the breakdown of triacylglycerol into free glycerol and fatty acids.18 It is reported that increasing lipolysis in mice directly promotes fatty acid oxidation within the adipocytes, which suggests that the activation of lipolysis becomes a potential therapeutic target for obesity.19,20 Similar to lipogenesis, lipolysis is also required for several lipases, including adipose triglyceride lipase, HSL, and monoglyceride lipase, that are implicated in the hydrolysis of triacylglycerol, diacylglycerol, and monoacylglycerol into free glycerol in the cellular lipid stores, respectively.21 Among these, HSL is considered to be the rate-limiting enzyme.22 In this study, we found that ASPH III stimulates the release of free glycerol and up-regulates HSL expression in the differentiated adipocyte from MSCs. Moreover, we observed an elevated level of leptin by treatment with ASPH III during the differentiation of MSCs into adipocytes. Leptin is an adipokine that is secreted from adipocyte and acts as a regulator of food intake and systemic fuel metabolism.23 Leptin stimulates lipolysis in adipocytes as well as triacylglycerol-storing tissues through autocrine or paracrine actions.24 Taken together, the up-regulation of HSL and leptin, and down-regulation of LPL and FAS by ASPH III may directly affect the intracellular lipid accumulation in the differentiation of MSCs into adipocytes.
Adipogenesis is sequentially regulated by transcription factors, including PPAR γ, C/EBPs, and SREBP-1c. C/EBPβ and C/EBPδ are transiently induced by cAMP and glucocorticoids and act as activators of PPAR γ and C/EBP α, which cooperatively stimulate each other's expression and are master regulators of adipogenesis.25 PPAR γ and C/EBP α regulate lipogenesis via activating LPL, FAS, and fatty acid transporter.26 Moreover, dramatic elevation of PPAR γ expression in the bone marrow MSCs differentiation into adipocytes is evidenced and it directly activates the expression of genes related to the adipocyte phenotype.13 SREBP-1c influences adipogenesis by activating PPAR γ expression and stimulates lipogenesis-related genes, including FAS.26 Thus, potent inhibitors that modulate adipocyte differentiation by down-regulating transcription factors may be helpful for the treatment of obesity. In this study, treatment with ASPH III exerts anti-adipogenesis by inhibiting lipogenesis and stimulating lipolysis in the differentiation of MSCs into adipocytes. Therefore, we investigated the effect of ASPH III on the expression of transcription factors and found that ASPH III dramatically decreased the expression of PPAR γ, C/EBP α, and SREBP-1c. These results suggest that the anti-adipogenic effect of ASPHs is closely related to the suppression of adipogenic factors during the differentiation of MSCs into adipocytes.
5 Conclusion
In this study, we demonstrate that protein hydrolysates derived from marine shellfish inhibit adipogenesis during adipocyte differentiation from MSCs. Particularly, low molecular weight ASPH shows a more potent effect than high molecular weight ASPH. The underlying mechanism of action shows that ASPH modulates adipogenic factors, including PPAR γ, C/EBP α, and SREBP-1c, and leptin, thus decreasing the intracellular lipid level in adipocyte differentiation. These findings provide insights for the potential use of marine organism-derived proteins in obesity. However, the active peptides that are responsible for the observed effect should be identified and/or their in vivo effect should be evaluated.Conflict of interest
The authors declare that there is no conflict of interest.Acknowledgements
This study was supported by the Basic Science Research Program through the National Research Foundation of Korea (NRF) funded by the Ministry of Education (NRF-2016R1A2B4016004).References
- C. Christodoulides, C. Lagathu, J. K. Sethi and A. Vidal-Puig, Trends Endocrinol. Metab., 2009, 20, 16–24 CrossRef CAS PubMed.
- B. B. Kahn and J. S. Flier, J. Clin. Invest., 2000, 106, 473–481 CrossRef CAS PubMed.
- B. Schmid, J. F. Rippmann, M. Tadayyon and B. S. Hamilton, Biochem. Biophys. Res. Commun., 2005, 328, 1073–1082 CrossRef CAS PubMed.
- J. J. Cao, J. Orthop. Surg. Res., 2011, 6, 30 CrossRef PubMed.
- M. I. Lefterova and M. A. Lazar, Trends Endocrinol. Metab., 2009, 20, 107–114 CrossRef CAS PubMed.
- A. T. Ali, W. E. Hochfeld, R. Myburgh and M. S. Pepper, Eur. J. Cell Biol., 2013, 92, 229–236 CrossRef CAS PubMed.
- S. Y. Park, Y. S. Kim, C. B. Ahn and J. Y. Je, J. Funct. Foods, 2016, 20, 88–95 CrossRef CAS.
- J. Wilson, M. Hayes and B. Carney, Food Chem., 2011, 129, 235–244 CrossRef CAS.
- A. Alemán, E. Pérez-Santín, S. Bordenave-Juchereau, I. Arnaudin, M. C. Gómez-Guillén and P. Montero, Food Res. Int., 2011, 44, 1044–1051 CrossRef.
- H. A. R. Suleria, G. Gobe, P. Masci and S. A. Osborne, Trends Food Sci. Technol., 2016, 50, 44–55 CrossRef CAS.
- P. A. Harnedy and R. J. FitzGerald, J. Funct. Foods, 2012, 4, 6–24 CrossRef CAS.
- J. H. Hyung, C. B. Ahn and J. Y. Je, RSC Adv., 2016, 6, 29365–29370 RSC.
- S. Muruganandan, A. A. Roman and C. J. Sinal, Cell. Mol. Life Sci., 2009, 66, 236–253 CrossRef CAS PubMed.
- N. Parris, R. A. Moreau, D. B. Johnston, L. C. Dickey and R. E. Aluko, J. Agric. Food Chem., 2008, 56, 2620–2623 CrossRef CAS PubMed.
- J. M. Gimble, C. Morgan, K. Kelly, X. Wu, V. Dandapani, C. S. Wang and V. Rosen, J. Cell. Biochem., 1995, 58, 393–402 CrossRef CAS PubMed.
- L. L. Gathercole, S. A. Morgan, I. J. Bujalska, D. Hauton, P. M. Stewart and J. W. Tomlinson, PLoS One, 2011, 6, e26223 CAS.
- A. M. Gonzales and R. A. Orlando, Nutr. Metab., 2007, 4, 22 Search PubMed.
- S. K. Choi, S. Park, S. Jang, H. H. Cho, S. Lee, S. You, S. H. Kim and H. S. Moon, Metabolism, 2016, 65, 646–654 CrossRef CAS PubMed.
- S. Wang, K. G. Soni, M. Semache, S. Casavant, M. Fortier, L. Pan and G. A. Mitchell, Mol. Genet. Metab., 2008, 95, 117–126 CrossRef CAS PubMed.
- K. Jaworski, M. Ahmadian, R. E. Duncan, E. Sarkadi-Nagy, K. A. Varady, M. K. Hellerstein, H. Y. Lee, V. T. Samuel, G. I. Shulman, K. H. Kim, S. de Val, C. Kang and H. S. Sul, Nat. Med., 2009, 15, 159–168 CrossRef CAS PubMed.
- M. Ahmadian, Y. Wang and H. S. Sul, Int. J. Biochem. Cell Biol., 2010, 42, 555–559 CrossRef CAS PubMed.
- R. E. Duncan, M. Ahmadian, K. Jaworski, E. Sarkadi-Nagy and H. S. Sul, Annu. Rev. Nutr., 2007, 27, 79–101 CrossRef CAS PubMed.
- D. M. Muoio and G. Lynis Dohm, Best Pract. Res., Clin. Endocrinol. Metab., 2002, 16, 653–666 CrossRef CAS.
- F. Lago, R. Gómez, J. J. Gómez-Reino, C. Dieguez and O. Gualillo, Trends Biochem. Sci., 2009, 34, 500–510 CrossRef CAS PubMed.
- S. Dave, N. J. Kaur, R. Nanduri, H. K. Dkhar, A. Kumar and P. Gupta, PLoS One, 2012, 7, e30831 CAS.
- E. D. Rosen, C. J. Walkey, P. Puigserver and B. M. Spiegelman, Genes Dev., 2000, 14, 1293–1307 CAS.
Footnote |
| † These authors contributed equally to this work. |
| This journal is © The Royal Society of Chemistry 2017 |

