 Open Access Article
Creative Commons Attribution 3.0 Unported Licence
Packing-induced solid-state fluorescence and thermochromic behavior of peptidic luminophores†
Apurba Pramanik and
Debasish Haldar*
Department of Chemical Sciences, Indian Institute of Science Education and Research Kolkata, Mohanpur, West Bengal 741246, India. E-mail: deba_h76@yahoo.com; deba_h76@iiserkol.ac.in; Fax: +91 3325873020; Tel: +91 3325873119
First published on 23rd December 2016
Abstract
The effect of packing on the solid state fluorescent propensities of peptidic luminophores has been investigated. A series of peptides containing 6-nitro-coumarin-3-carboxylic acid and α-aminoisobutyric acid (Aib) has been synthesized to study the structure–property relationship and stimuli responsive emission properties of the luminophores. In spite of the presence of a coumarin chromophore, peptide 2 exhibits no solid state fluorescence. The alkyl chains of Aib affect the solid state molecular packing modes and optoelectronic properties significantly. However, the fluorescence microscopy confirmed the change of blue fluorescence of peptide 3 in crystal and in amorphous states. The X-ray crystallography sheds some light on the molecular orientation, packing and the diverse degree of π–π stacking orbital overlap of adjacent coumarin chromophores of the peptide 3. Irrespective of coumarin chromophore, the peptides exhibit different packing-induced solid state emission properties varying from one peptide to another, which highlights the effect of Aib side chains.
Introduction
Molecular packing directed luminescence is highly important in crystal engineering, where a solid material exhibits change in photoluminescence colour in response to external stimuli.1 In a recent review, Yang et al. summarized the effect of alkyl length on the solid-state fluorescence and mechanochromic behaviour of organic days.2 The organic materials with packing directed luminescence are of great interest due to practical applications such as lasers, OLEDs, optical data storage,3 two-photon photoluminescence (PL) microscopy,4 optical switching5 and limiting.6 Various external stimuli and strategies such as chemical modification,7–10 mechanical control of the packing modes,11–16 co-crystals,17,18 have been used to alter the fluorescence properties. Several reports have shown the influences of packing on the fluorescent colors of various synthetic organic dyes.19,20 For example, Mei and co-workers have shown the mechanochromism triggered fluorescent colour switching among polymorphs of emodin.21 Wang et al. explained the polymorphism and pseudo-polymorphism directed fluorescence switching of N,N-di(n-butyl)-quinacridone.22 Hariharan et al. have engineered the solid state packing and colour of pyrene by acetylation.23 Fraser and co-workers have reported the polymorphism induced reversible mechanochromic luminescence for difluoroboronavobenzone.24 But, controlling molecular orientation and diverse degree of orbital overlap of adjacent chromophores is still challenging.25 However, the influences of packing on the fluorescent colors of peptides/foldamers are relatively rare.26Coumarin a natural product has been used as gain medium in blue-green dye lasers and sensitizer for photovoltaic cell.27 Coumarin derivative also have been used to develop array for protein sensing.28 Ting and co-workers have used coumarin fluorophore ligation for imaging protein–protein interaction inside living cell.29 Herein, we have synthesized a series of nitropeptides containing 6-nitro-coumarin-3-carboxylic acid methyl ester, α-aminoisobutyric acid (Aib) and investigated their structures and optical properties. Aib is conformationally rigid and helicogenic. So, introduction of Aib will be interesting not only for molecular conformation, but also for controlling molecular orientation (to adjust the steric hindrance) and crystal packing. Interestingly, the 6-nitro-coumarin-3-carboxylic acid methyl ester 1 exhibits red-green birefringence under cross-polarized light, before and after heating. However, the nitropeptide 2 exhibits no birefringence. The nitropeptide 3 exhibits green-gold birefringence which disappeared on heating. The fluorescence microscopy confirmed the change of blue fluorescence of nitropeptide 3 in crystal and in amorphous state. Finally X-ray crystallography sheds some light on the molecular orientation, packing and the diverse degree of π–π stacking orbital overlap of adjacent coumarin chromophores of the nitropeptide 3.
Results and discussion
For nitropeptides 2 and 3 (Fig. 1), the design principle explored was how to use a chromophore containing aromatic amino acid with helicogenic Aib to develop rigid foldamers and use as fluorescence probe. The introduction of Aib-moiety will increase crystallinity. Moreover, to adjust the steric hindrance Aib is suitable for controlling molecular orientation and crystal packing. Nitropeptide 3 contains two coumarin chromophores connected by a peptide bond. The target compound 6-nitro-coumarin-3-carboxylic acid methyl ester 1 (Fig. 1) was synthesized by following a standard coumarin synthesis protocol (reflux salicyldehyde, dimethyl malonate and piperidine at 80 °C for 10 h) followed by nitration using mixed acid. Nitropeptides 2 and 3 were synthesized by conventional solution-phase peptide synthesis methodology using DCC as coupling reagent. The synthesized compounds were purified and characterized by 1H-NMR, 13C-NMR, FT-IR and mass spectrometry (MS) analysis.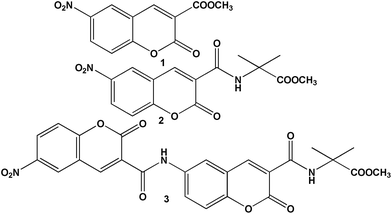 | ||
| Fig. 1 The schematic presentation of 6-nitro-coumarin-3-carboxylic acid methyl ester 1 and peptides 2 and 3. | ||
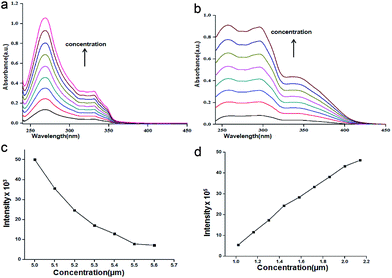
First we have investigated the assembly of compound 1 and nitropeptides 2 and 3 in solution phase by different spectroscopic techniques. The solution state UV/vis spectra shows that there is no change of coumarin spectral positions (275 and 335 nm for π to π* transition) or intensity of compound 1 in chloroform (ESI Fig. 1†). Also the nitropeptide 2 shows two peaks at 275 and 335 nm responsible for π to π* transition (Fig. 2a) The nitropeptide 3 exhibits three peaks at 260, 300 and 335 nm and intensity of the bands increases with increasing concentration (Fig. 2b). The typical emission band of coumarin in chloroform solution at 400 nm also increases (ESI Fig. 2†) with addition of compound 1. However, the concentration dependence studies show that the emission band responsible for coumarin unit at 400 nm has quenched with increasing concentration of nitropeptide 2 (Fig. 2c). But for the nitropeptide 3, the characteristic emission bands at 450 nm increases with increasing concentration (Fig. 2d). The results suggest irrespective of coumarin chromophore, the intermolecular interactions play an important part for the luminophore peptides.
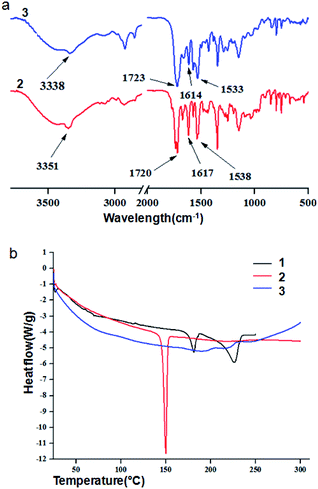
Solid state FT-IR spectroscopy is an excellent method to investigate the structure and assembly pattern of the nitropeptides. The FT-IR region 3500–3200 cm−1 is important for the N–H stretching vibrations, however the range 1800–1500 cm−1 is assigned for the stretching band of amide I and the bending peak of amide II.30 The peptides 2 and 3 exhibit N–H stretching vibrations at 3351 and 3338 cm−1 and amide I and amide II peaks at 1617, 1538 and 1614, 1533 cm−1 respectively.30 Peaks at 1720 and 1723 cm−1 are responsible for ester functional group (Fig. 3a).
DSC scans were carried out with a second generation high-sensitivity METTLER differential scanning calorimeter. For the reproducibility of the results, the experiments were repeated thrice with three different samples. Cooling scans yielded curves are different to the heating scans. This is expected due to change of packing pattern by thermal stimuli. Therefore, only heating scans are discussed in this work. The first DSC heating scan of 6-nitro-coumarin-3-carboxylic acid methyl ester 1 exhibits two peaks at 181.08 and 226.68 °C. The first heating scan DSC experiment (Fig. 3b) clearly shows that the nitropeptide 2 has sharp melting temperature at 149.65 °C. A closure inspection of the first heating scan reveals a weak endothermic transition at 192.58 °C (Fig. 3b). There is another weak endothermic transition at 218.40 °C. This transition is assigned as melting temperature for nitropeptide 3.31 However, the first DSC cooling scans for nitropeptides 2 and 3 (ESI Fig. 3†) are void of any crystallization peak which indicates the amorphous nature of melted and cooled samples.31
The morphology of the peptides was studied by field-emission scanning electron microscopic (FE-SEM) measurements. For FE-SEM experiments, dilute solutions (0.5 mM) of above reported peptides in chloroform were placed on a microscopic glass slide and then dried under a vacuum for two days. Fig. 4 depicts the FE-SEM images of the aliphatic–aromatic backbone hybrid peptides. From Fig. 4a the micrographs show the flake like morphology for 6-nitro-coumarin-3-carboxylic acid methyl ester 1 in the self-assembled state. Peptides 2 exhibits microsphere morphology (Fig. 4b) with a diameter ca. 400 nm. Peptide 3 exhibits fused microsphere like morphology (Fig. 4, panel c and d respectively).
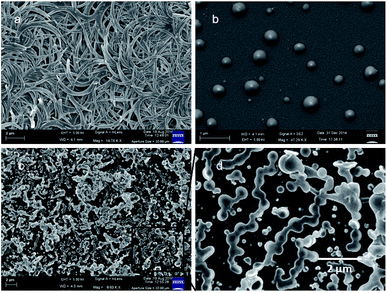 | ||
| Fig. 4 The FE-SEM images (a) flake like morphology of compound 1, (b) microsphere morphology of peptide 2 and (c) and (d) fused microsphere like morphology of peptide 3. | ||
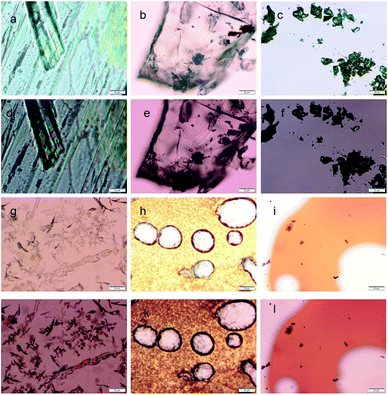
The thermal effect and change of optical properties of the nitropeptides were studied by polarized optical microscopy (POM). The 6-nitro-coumarin-3-carboxylic acid methyl ester 1 crystals exhibit red-green birefringence under polarized light (Fig. 5a and d). The crystals of nitropeptide 2 do not show any birefringence by POM (Fig. 5b and e). However, the nitropeptide 3 exhibits green-gold birefringence under polarized light (Fig. 5c and f). Fig. 5g and j show images of samples of 1 that were cooled from the melt. The Fig. 5j shows clearly that the 6-nitro-coumarin-3-carboxylic acid methyl ester from crystal from melt and the red-green birefringence under polarized light has persisted. The samples of nitropeptide 2 that were cooled from the melt show amorphous nature and do not show any birefringence by POM (Fig. 5h and k). The same effect was observed when nitropeptide 3 was cooled from the melt. This indicates that the stability of the amorphous state under ambient conditions is high and the amorphous compound does not exhibit birefringence under polarized light (Fig. 5i and l).
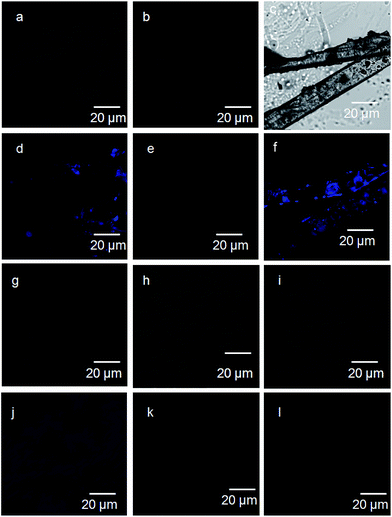
To explore the relationship between the emission of the crystals and their amorphous state, fluorescence microscopy were performed.32,33 The 6-nitro-coumarin-3-carboxylic acid methyl ester 1 crystals show blue emission on excitation at 330 nm (Fig. 6a and d). Irrespective of presence of 6-nitro-coumarin-3-carboxylic acid chromophore, the crystals of nitropeptide 2 do not show any emission on excitation at 330 nm (Fig. 6b and e). However, the nitropeptide 3 containing two coumarin chromophores connected by a peptide bond exhibits blue emission on excitation at 330 nm (Fig. 6c and f). The Fig. 6j clearly shows that the crystal of 6-nitro-coumarin-3-carboxylic acid methyl ester 1 obtained from melt shows blue emission. But the samples of nitropeptide 2 (Fig. 6h and k) and 3 (Fig. 6i and l) that were cooled from the melt do not show blue emission on excitation at 330 nm. Sample decomposition is not an issue and confirmed by NMR, FT-IR and UV/Vis spectroscopy. This indicates that irrespective of the presence of coumarin chromophore, the fluorescence properties of the nitro peptides depend on the packing of the molecules in crystal and amorphous state.
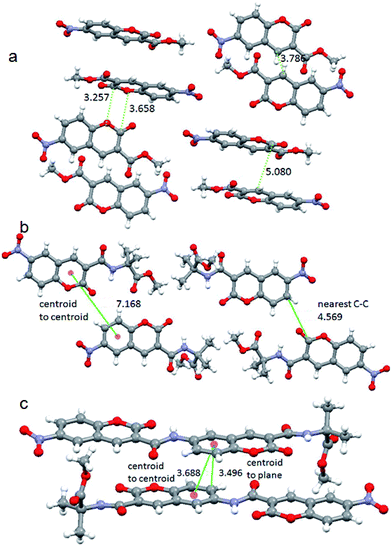
To explore the relationship between the emission of the solid systems and crystal structure, single crystal X-ray diffraction analysis were performed. The monoclinic light yellow crystals of 6-nitro-coumarin-3-carboxylic acid methyl ester 1 were obtained from methanol solution by slow evaporation (ESI Fig. 4†). There is only one molecule in the asymmetric unit (ESI Fig. 5†).34 In higher order packing the molecules are in anti parallel arrangements and stabilized by multiple face to face, face to edge and edge to edge π–π stacking interactions (Fig. 7a). We observed a π–π stacking distance of 3.25 Å. The closest C–C distance between two coumarin units is 3.78 Å. But the centroid to centroid distance is 5.08 Å. Hence, the week π–π interactions between the coumarin units are responsible for the blue emission in solid state. Wang et al. have reported that the crystal phases with stronger π–π interactions will exhibit maximum emission at a longer wavelength region, however the crystal phases with relatively weaker π–π interactions will show emission at a shorter wavelength region.22 The triclinic yellowish green crystals of nitropeptide 2 were obtained by slow evaporation of methanol solution (ESI Fig. 4†). There are two molecules in the asymmetric unit (ESI Fig. 6†).34 There is an intra molecular hydrogen bond between coumarin ring C![[double bond, length as m-dash]](https://www.rsc.org/images/entities/char_e001.gif) O and Aib NH that impose an overall planarity and stability of the molecule. In higher order packing the molecules are in parallel arrangements (Fig. 7b). There is no inter molecular hydrogen bond or π–π stacking interaction. The centroid to centroid distance is 7.16 Å. Though the nitropeptide 2 contains coumarin chromophore, due to non communication between the coumarin units, the compound does not show fluorescence in solid state. The structure of the crystals used for measuring fluorescence is identical with that used for X-ray crystallographic analysis. The triclinic light yellow crystals of nitropeptide 3 were obtained from methanol solution by slow evaporation (ESI Fig. 4†). There is only one molecule in the asymmetric unit (ESI Fig. 7†).34 There are two intra molecular hydrogen bonds between coumarin(2) ring C
O and Aib NH that impose an overall planarity and stability of the molecule. In higher order packing the molecules are in parallel arrangements (Fig. 7b). There is no inter molecular hydrogen bond or π–π stacking interaction. The centroid to centroid distance is 7.16 Å. Though the nitropeptide 2 contains coumarin chromophore, due to non communication between the coumarin units, the compound does not show fluorescence in solid state. The structure of the crystals used for measuring fluorescence is identical with that used for X-ray crystallographic analysis. The triclinic light yellow crystals of nitropeptide 3 were obtained from methanol solution by slow evaporation (ESI Fig. 4†). There is only one molecule in the asymmetric unit (ESI Fig. 7†).34 There are two intra molecular hydrogen bonds between coumarin(2) ring C![[double bond, length as m-dash]](https://www.rsc.org/images/entities/char_e001.gif) O and Aib NH and coumarin(1) ring C
O and Aib NH and coumarin(1) ring C![[double bond, length as m-dash]](https://www.rsc.org/images/entities/char_e001.gif) O and coumarin(1) NH. Moreover the 179° torsion angle between two coumarin units and placement of two lactone units in opposite direction make the molecule almost planer. In higher order packing the nitropeptide 3 molecules are in anti parallel arrangements (Fig. 7c) and stabilized by face to face π–π stacking interactions. The centroid to centroid distance is 3.68 Å and centroid to plane distance is 3.49 Å. There is no inter molecular hydrogen bond. Hence, the π–π interactions between the coumarin units are responsible for the blue emission of nitropeptide 3 in solid state. The crystals used for X-ray analysis is identical with that used for measuring fluorescence. However, on melting and cooling the packing pattern changed, the nitropeptide 3 became amorphous in nature and lost its blue fluorescence. The backbone torsion angles around Aib residue are listed in Table 1. The lauric acid appended 6-amino-coumarin-3-carboxylic acid methyl ester shows no crystallinity and change of fluorescence on heating (ESI Fig. 8†). Hence, Aib is suitable for making fluorescent crystals.
O and coumarin(1) NH. Moreover the 179° torsion angle between two coumarin units and placement of two lactone units in opposite direction make the molecule almost planer. In higher order packing the nitropeptide 3 molecules are in anti parallel arrangements (Fig. 7c) and stabilized by face to face π–π stacking interactions. The centroid to centroid distance is 3.68 Å and centroid to plane distance is 3.49 Å. There is no inter molecular hydrogen bond. Hence, the π–π interactions between the coumarin units are responsible for the blue emission of nitropeptide 3 in solid state. The crystals used for X-ray analysis is identical with that used for measuring fluorescence. However, on melting and cooling the packing pattern changed, the nitropeptide 3 became amorphous in nature and lost its blue fluorescence. The backbone torsion angles around Aib residue are listed in Table 1. The lauric acid appended 6-amino-coumarin-3-carboxylic acid methyl ester shows no crystallinity and change of fluorescence on heating (ESI Fig. 8†). Hence, Aib is suitable for making fluorescent crystals.
| ω1 | ϕ1 | ψ1 | |
|---|---|---|---|
| Peptide 2 | |||
| Molecule A | −167.56 | −178.50 | −156.83 |
| Molecule B | 172.38 | −51.77 | −44.39 |
| Peptide 3 | −179.78 | 55.02 | 43.83 |
Conclusions
In conclusion, the packing-induced solid-state emission propensities and thermoresponsive behaviour of peptides containing 6-nitro-coumarin-3-carboxylic acid and α-aminoisobutyric acid has been reported. The alkyl chains of Aib affect significantly the solid state molecular packing modes of peptide 2 and modulated the extent of π–π interactions between the coumarin units. Fluorescence spectroscopy and microscopy confirmed the fluorescence switch of peptide 3 in crystal and in amorphous state. The X-ray crystallography reveals the molecular orientation, packing and the diverse degree of π–π stacking orbital overlap of adjacent coumarin chromophores of the peptide 3. The results indicate that apart from the conjugated backbone of the coumarin chromophore, the adjacent alkyl side chain of Aib and linking position have major impact on the solid-state molecular packing as well as the solid-state optical properties. The information obtained here may be helpful to tune the fluorescence probe for biological and diagnostic imaging.Experimental
General
The Aib was purchased from Sigma chemicals. HOBt (1-hydroxybenzotriazole) and DCC (dicyclohexylcarbodiimide) were purchased from SRL.Peptide synthesis
The peptides were synthesized by conventional solution-phase methods using racemisation free fragment condensation strategy. The C-terminus was protected as a methyl ester. Coupling was mediated by dicyclohexylcarbodiimide/1-hydroxyl benzotriazole (DCC/HOBt). The products were purified by column chromatography using silica (100–200 mesh size) gel as a stationary phase and an n-hexane–ethyl acetate mixture as an eluent. The intermediates and final compounds were fully characterized by 500 MHz and 400 MHz 1H NMR spectroscopy, 125 MHz 13C NMR spectroscopy, FTIR spectroscopy and mass spectrometry. The peptides were characterized by X-ray crystallography.![[thin space (1/6-em)]](https://www.rsc.org/images/entities/char_2009.gif) :
:![[thin space (1/6-em)]](https://www.rsc.org/images/entities/char_2009.gif) n-hexane (1
n-hexane (1![[thin space (1/6-em)]](https://www.rsc.org/images/entities/char_2009.gif) :
:![[thin space (1/6-em)]](https://www.rsc.org/images/entities/char_2009.gif) 3) as an eluent. Yield: 3.12 gm (15.20 mmol, 88.25%).
3) as an eluent. Yield: 3.12 gm (15.20 mmol, 88.25%).1H NMR (CDCl3, 400 MHz, δ in ppm): 8.47–8.44 (s, 1H, Ar-H), 7.53–7.50 (m, 2H, Ar-H), 7.20–7.24 (m, 2H, Ar-H), 3.81 (s, 3H, –OCH3). 13C NMR (100 MHz, DMSO-d6) 162.66, 158.13, 155.08, 147.99, 143.59, 128.67, 126.13, 119.23, 118.12, 117.78, 52.73. HR-ESI-MS (m/z): [M + H]+ calculated for C11H9O4 = 204.17, found 205.19.
![[thin space (1/6-em)]](https://www.rsc.org/images/entities/char_2009.gif) :
:![[thin space (1/6-em)]](https://www.rsc.org/images/entities/char_2009.gif) hexane (1
hexane (1![[thin space (1/6-em)]](https://www.rsc.org/images/entities/char_2009.gif) :
:![[thin space (1/6-em)]](https://www.rsc.org/images/entities/char_2009.gif) 2) as an eluent. Yield: 3.65 gm (14.58 mmol, 92.82%).
2) as an eluent. Yield: 3.65 gm (14.58 mmol, 92.82%).1H NMR (CDCl3, 400 MHz, δ in ppm): 8.94–8.91 (s, 2H, Ar-H), 8.54–8.53 (m, 1H, Ar-H), 7.66–7.64 (m, 1H, Ar-H), 3.86–3.83 (s, 3H, –OCH3). 13C NMR (100 MHz, CDCl3) 162.83, 158.10, 148.95, 145.94, 128.62, 126.09, 121.65, 118.19, 117.64, 111.03, 52.31. HR-ESI-MS (m/z): [M + H]+ calculated for C11H8NO6 = 249.17, found 250.18.
1H NMR (DMSO-d6, 400 MHz, δ in ppm): 13.90–12.54 (br, 1H, –COOH), 8.93–8.78 (m, 2H, Ar-H), 8.50–8.37 (m, 1H, Ar-H), 7.66–7.51 (m, 1H, Ar-H). 13C NMR (DMSO-d6, 125 MHz, δ in ppm): 164.71, 158.20, 147.60, 143.82, 128.94, 126.53, 124.96, 120.68, 118.35, 117.56.
1H NMR (CDCl3, 400 MHz, δ in ppm): 9.08–9.04 (s, 1H, Ar-H), 8.98–8.9 (s, 1H, Ar-H), 8.57–8.46 (m, 1H, Ar-H), 7.62–7.53 (m, 1H, Ar-H), 7.49–7.46 (s, 1H, –NH), 3.79–3.71 (s, 3H, –OMe), 1.69–1.60 (s, 6H, Aib-H).
1H NMR (CDCl3, 400 MHz, δ in ppm): 9.32–9.28 (s, 1H, Ar-H), 8.76–8.72 (s, 1H, Ar-H), 7.24–7.20 (m, 1H, Ar-H), 7.05–6.97 (m, 1H, Ar-H), 6.89–6.82 (s, 1H, –NH), 5.33–5.28 (s, 2H, –NH2), 3.79–3.71 (s, 3H, –OMe), 1.69–1.51 (s, 6H, Aib-H).
![[thin space (1/6-em)]](https://www.rsc.org/images/entities/char_2009.gif) :
:![[thin space (1/6-em)]](https://www.rsc.org/images/entities/char_2009.gif) 4 as the eluent. Yield: 868 mg (1.66 mmol, 39.05%).
4 as the eluent. Yield: 868 mg (1.66 mmol, 39.05%).1H NMR (CDCl3, 400 MHz, δ in ppm): 9.38–9.34 (s, 1H, –NH), 9.07–9.01 (s, 1H, Ar-H), 8.89–8.86 (s, 1H, Ar-H), 8.73–8.70 (m, 1H, Ar-H), 8.68–8.59 (m, 1H, Ar-H), 8.27–8.23 (s, 1H, –NH), 8.19–8.10 (m, 1H, Ar-H), 7.95–7.84 (m, 1H, Ar-H), 7.64–7.62 (m, 1H, Ar-H), 7.48–7.43 (m, 1H, Ar-H), 3.81–3.72 (s, 3H, –OCH3), 3.69–3.58 (s, 6H, Aib-H). 13C NMR (DMSO-d6, 125 MHz, δ in ppm): 170.12, 165.51, 161.10, 161.00, 155.79, 147.01, 145.26, 141.25, 137.24, 136.21, 132.64, 131.49, 131.00, 126.27, 121.01, 120.00, 118.13, 116.16, 56.41, 53.52, 26.14.
NMR experiments
All NMR studies were carried out on a Brüker AVANCE 500 MHz and Jeol 400 MHz spectrometer at 278 K. Compound concentrations were in the range 1–10 mM in CDCl3 and (CD3)2SO.FTIR spectroscopy
All reported solid-state FTIR spectra were obtained with a Perkin Elmer Spectrum RX1 spectrophotometer with the KBr disk technique.Mass spectrometry
Mass spectra were recorded on a Q-Tof Micro YA263 high-resolution (Waters Corporation) mass spectrometer by positive-mode electrospray ionization.Field emission scanning electron microscopy
Morphologies of the reported peptides were investigated using field emission-scanning electron microscopy (FE-SEM). A small amount of solution of the peptide was placed on a clean silicon wafer and then dried by slow evaporation. The material was then allowed to dry under vacuum at 30 °C for two days. The materials were gold-coated, and the micrographs were taken in an FE-SEM apparatus (Jeol Scanning Microscope-JSM-6700F).Single crystal X-ray diffraction study
Intensity data of peptides were collected with MoKα radiation using Bruker APEX-2 CCD diffractometer. Data were processed using the Bruker SAINT package and the structure solution and refinement procedures were performed using SHELX97. CCDC 1505407, 1505411 and 1505412 contains the crystallographic data for the compound 1, peptide 2 and peptide 3 respectively.Acknowledgements
We thank the IISER-Kolkata, India, for financial assistance. A. Pramanik acknowledges the C.S.I.R, India for research fellowship.Notes and references
- (a) X. Wang, O. S. Wolfbeis and R. J. Meier, Chem. Soc. Rev., 2013, 42, 7834–7869 RSC; (b) M. D. Allendorf, C. A. Bauer, R. K. Bhakta and R. J. T. Houk, Chem. Soc. Rev., 2009, 38, 1330–1352 RSC.
- S. Xue, X. Qiu, Q. Sun and W. Yang, J. Mater. Chem. C, 2016, 4, 1568–1578 RSC.
- B. H. Cumpston, S. P. Ananthavel, S. Barlow, D. L. Dyer, J. E. Ehrlich, L. L. Erskine, A. A. Heikal, S. M. Kuebler, I.-Y. S. Lee, D. McCord-Maughon, J. Qin, H. Röckel, M. Rumi, X.-L. Wu, S. R. Marder and J. W. Perry, Nature, 1999, 398, 51–54 CrossRef CAS.
- (a) L. A. Bagatolli and E. Gratton, Biophys. J., 2000, 78, 290–305 CrossRef CAS PubMed; (b) M. Ipuy, Y. Y. Liao, E. Jeanneau, P. L. Baldeck, Y. Bretonnie and C. Andraud, J. Mater. Chem. C, 2016, 4, 766–779 RSC.
- R. Petermann, M. Tian, S. Tatsuura and M. Furuki, Dyes Pigm., 2003, 57, 43 CrossRef CAS.
- J. E. Ehrlich, X. L. Wu, L. Y. Lee, Z. Y. Hu, H. Rockel, S. R. Marder and J. W. Perry, Opt. Lett., 1997, 22, 1843 CrossRef CAS PubMed.
- J. Chan, S. C. Dodani and C. J. Chang, Nat. Chem., 2012, 4, 973–984 CrossRef CAS PubMed.
- X. Zhang, Z. Chi, B. Xu, L. Jiang, X. Zhou, Y. Zhang, S. Liu and J. Xu, Chem. Commun., 2012, 48, 10895–10897 RSC.
- S. Yamaguchi, I. Yoshikawa, T. Mutai and K. Araki, J. Mater. Chem., 2012, 22, 20065–20070 RSC.
- T. Sarma, P. K. Panda and J. Setsune, Chem. Commun., 2013, 49, 9806–9808 RSC.
- Y. Dong, B. Xu, J. Zhang, X. Tan, L. Wang, J. Chen, H. Lv, S. Wen, B. Li, L. Ye, B. Zou and W. Tian, Angew. Chem., Int. Ed., 2012, 51, 10782–10785 CrossRef CAS PubMed.
- L. Wang, K. Wang, B. Zou, K. Ye, H. Zhang and Y. Wang, Adv. Mater., 2015, 27, 2918–2922 CrossRef CAS PubMed.
- M. Teng, X. Jia, S. Yang, X. Chen and Y. Wei, Adv. Mater., 2012, 24, 1255–1261 CrossRef CAS PubMed.
- R. Misra, T. Jadhav, B. Dhokale and S. M. Mobin, Chem. Commun., 2014, 50, 9076–9078 RSC.
- T. Liu, A. D. Chien, J. Lu, G. Zhang and C. L. Fraser, J. Mater. Chem., 2011, 21, 8401–8408 RSC.
- T. Han, Y. Zhang, X. Feng, Z. Lin, B. Tong, J. Shi, J. Zhi and Y. Dong, Chem. Commun., 2013, 49, 7049–7051 RSC.
- D. Yan, A. Delori, G. O. Lloyd, T. Friscic, G. M. Day, W. Jones, J. Lu, M. Wei, D. G. Evans and X. Duan, Angew. Chem., Int. Ed., 2011, 50, 12483–12486 CrossRef CAS PubMed.
- Q. Feng, M. Wang, B. Dong, J. He and C. Xu, Cryst. Growth Des., 2013, 13, 4418–4427 CAS.
- T. Bullard, K. L. Wustholz, E. D. Bott, M. Robertson, P. J. Reid and B. Kahr, Cryst. Growth Des., 2009, 9, 982–990 CAS.
- T. Zhou, T. Jia, S. Zhao, J. Guo, H. Zhang and Y. Wang, Cryst. Growth Des., 2012, 12, 179–184 CAS.
- M. Li, Q. Zhang, J.-R. Wanga and X. Mei, Chem. Commun., 2016, 52, 11288–11291 RSC.
- Y. Fan, Y. Zhao, L. Ye, B. Li, G. Yang and Y. Wang, Cryst. Growth Des., 2009, 9, 1421–1430 CAS.
- S. K. Rajagopal, A. M. Philip, K. Nagarajan and M. Hariharan, Chem. Commun., 2014, 50, 8644–8647 RSC.
- G. Zhang, J. Lu, M. Sabat and C. L. Fraser, J. Am. Chem. Soc., 2010, 132, 2160–2162 CrossRef CAS PubMed.
- S. C. Rasmussen, S. J. Evenson and C. B. McCausland, Chem. Commun., 2015, 51, 4528–4543 RSC.
- G. Liang, F. Ren, H. Gao, Q. Wu, F. Zhua and B. Z. Tang, Polym. Chem., 2016, 7, 5181–5187 RSC.
- (a) R. J. Nedumpara, K. J. Thomas, V. K. Jayasree, C. P. Girijavallabhan, V. P. N. Nampoori and P. Radhakrishnan, Appl. Opt., 2007, 46, 1159–1168 CrossRef; (b) K. Hara, Z. S. Wang, T. Sato, A. Furube, R. Katoh, H. Sugihara, Y. Danoh, C. Kasada, A. Shinpo and S. Suga, J. Phys. Chem. B, 2005, 109, 15476–15482 CrossRef CAS PubMed.
- M. Ikeda, R. Ochiaand and I. Hamachi, Lab Chip, 2010, 10, 3325–3334 RSC.
- S. A. Slavoff, D. S. Liu, J. D. Cohen and A. Y. Ting, J. Am. Chem. Soc., 2011, 133, 19769–19776 CrossRef CAS PubMed.
- (a) V. Moretto, M. Crisma, G. M. Bonora, C. Toniolo, H. Balaram and P. Balaram, Macromolecules, 1989, 22, 2939–2944 CrossRef CAS; (b) P. I. Haris and D. Chapman, Biopolymers, 1995, 37, 251–263 CrossRef CAS PubMed.
- B. T. Makowski, B. Valle, K. D. Singer and C. Weder, J. Mater. Chem., 2012, 22, 2848–2850 RSC.
- A. Adawy, W. J. P. van Enckevort, E. S. Pierson, W. J. de Grip and E. Vlieg, CrystEngComm, 2014, 16, 9800–9809 RSC.
- J. Ahn, S. Park, J. H. Lee, S. H. Jung, S.-J. Moon and J. H. Jung, Chem. Commun., 2013, 49, 2109–2111 RSC.
- Single-crystal X-ray analysis of peptides 1 and 2 were recorded on a Bruker high resolution X-ray diffractometer instrument. The structures were solved by a direct method and refined by least-squares calculations on F2 for all independent reflections (SHELXL-2013).35 Crystal data of compound 1: C11H7N1O6, Mw = 249.18, I2/a, a = 20.178(2) Å, b = 4.0966(4) Å, c = 25.538(2) Å, α = 90°, β = 99.66(9)°, γ = 90°, V = 2081.1(3) Å3, Z = 8, dm = 1.591 Mg m−3, K = 293, R1 = 0.0641 and wR2 = 0.1721 for 2014 data with I > 2σ(I). Crystal data of nitropeptide 2: C15H14N2O7, Mw = 334.28, P
![[1 with combining macron]](https://www.rsc.org/images/entities/char_0031_0304.gif) , a = 7.8470(3) Å, b = 14.2490(8) Å, c = 15.0925(8) Å, V = 1488.03(15) Å3, Z = 4, dm = 1.492 Mg m−3, K = 153, R1 = 0.0373 and wR2 = 0.0967 for 5228 data with I > 2σ(I). Crystal data of nitropeptide 3: C25H19N3O10, Mw = 521.43, P
, a = 7.8470(3) Å, b = 14.2490(8) Å, c = 15.0925(8) Å, V = 1488.03(15) Å3, Z = 4, dm = 1.492 Mg m−3, K = 153, R1 = 0.0373 and wR2 = 0.0967 for 5228 data with I > 2σ(I). Crystal data of nitropeptide 3: C25H19N3O10, Mw = 521.43, P![[1 with combining macron]](https://www.rsc.org/images/entities/char_0031_0304.gif) , a = 7.8580(8) Å, b = 11.5608(12) Å, c = 13.8689(11) Å, V = 1188.1(2) Å3, Z = 2, dm = 1.458 Mg m−3, K = 293, R1 = 0.0726 and wR2 = 0.1887 for 4050 data with I > 2σ(I). CCDC 1505407, 1505411 and 1505412 contains the crystallographic data for the crystals respectively.
, a = 7.8580(8) Å, b = 11.5608(12) Å, c = 13.8689(11) Å, V = 1188.1(2) Å3, Z = 2, dm = 1.458 Mg m−3, K = 293, R1 = 0.0726 and wR2 = 0.1887 for 4050 data with I > 2σ(I). CCDC 1505407, 1505411 and 1505412 contains the crystallographic data for the crystals respectively. - G. M. Sheldrick, Acta Crystallogr., Sect. C: Struct. Chem., 2015, 71, 3–8 CrossRef PubMed.
Footnote |
| † Electronic supplementary information (ESI) available: Synthesis and characterization of trisamides, 1H NMR, 13C NMR, Fig. ESI S1–S8, Fig. S1–S12. CCDC 1505407, 1505411 and 1505412. For ESI and crystallographic data in CIF or other electronic format see DOI: 10.1039/c6ra24799g |
| This journal is © The Royal Society of Chemistry 2017 |

