 Open Access Article
Fabrication of core–shell, yolk–shell and hollow Fe3O4@carbon microboxes for high-performance lithium-ion batteries†
Hao
Tian
a,
Hao
Liu
*bc,
Tianyu
Yang
d,
Jean-Pierre
Veder
e,
Guoxiu
Wang
 c,
Ming
Hu
 f,
Shaobin
Wang
a,
Mietek
Jaroniec
 *g and
Jian
Liu
 *ah
*ah
aDepartment of Chemical Engineering, Curtin University, Perth, WA 6845, Australia. E-mail: jian.liu@curtin.edu.au
bSchool of Environmental and Chemical Engineering, Shanghai University, Shanghai, 200444, China
cCentre for Clean Energy Technology, School of Mathematical and Physical Sciences, Faculty of Science, University of Technology Sydney, Broadway, Sydney, NSW 2007, Australia. E-mail: hao.liu@uts.edu.au
dInstitute for Frontier Materials, Deakin University, Geelong, VIC 3216, Australia
eDepartment of Imaging and Applied Physics, Curtin University, Perth, WA 6845, Australia
fSchool of Physics and Materials Science, East China Normal University, Shanghai, 200241, China
gDepartment of Chemistry and Biochemistry, Kent State University, Kent, Ohio 44242, USA. E-mail: jaroniec@kent.edu
hDepartment of Chemical and Process Engineering, University of Surrey, Guildford, Surrey, GU2 7XH, UK
First published on 6th March 2017
Abstract
Metal oxide–carbon composites with core–shell, yolk–shell and hollow structures have attracted enormous interest because of their applications in lithium-ion batteries. However, the relationship between structure and battery performance is still unclear. Herein, we report the designed synthesis of unique core–shell, yolk–shell and hollow Fe3O4@carbon microboxes through a one-step Stöber coating method, followed by a carbonization process. Different calcination temperatures were investigated to manipulate the various structures, and the impact of layer thickness on the battery performance was also assessed. Our results showed that the core–shell structured Fe3O4@carbon microboxes with nitrogen-doped carbon shells having a thickness of 15 nm exhibited an excellent performance in lithium-ion batteries with a high reversible capacity of 857 mA h g−1 that could be retained after 100 cycles at a current density of 0.1 A g−1.
Introduction
As one of the typical energy storage and supplemental devices, rechargeable lithium ion batteries (LIBs) are promising candidates toward sustainable energy.1–3 In the past decade, enormous efforts have been undertaken toward advanced electrode materials. Fe3O4-based nanomaterials with special morphologies and structures have been used as anode materials with superior performance because of their high theoretical capacity (924 mA h g−1), low cost, low toxicity and the natural abundance of iron.4,5 However, large volume expansion during lithiation, poor electronic conductivity and ion diffusion ability are major problems that restrict the practical applications of these anode materials.6,7 Design and fabrication of particles with special morphologies and tailored properties have been reported to enhance the cycle performance and rate capability.8–28 For example, in the case of hollow Fe3O4-based structures, a sufficiently large space can be provided to facilitate the drastic volume expansion and short diffusion paths to promote lithium-ion transport.29,30 In particular, the design of special core–shell and yolk–shell structures is an alternative efficient strategy to improve the cycling performance.31–35 An adequately designed interior space has been proven to be crucial for accommodating the large volume change of the Fe3O4 active materials, and the particle aggregation can also be hindered using protective shells. However, synthesis of the abovementioned structured materials involves multiple steps; thus, there is still a challenge to fabricate particles with different compositional and morphological cores and shells at the same scale. In addition, a deep understanding of the relationship between the structure of particles including core–shell, yolk–shell and hollow structures and electrochemical performance is rarely discussed.Hollow and yolk–shell structured materials with tailored physical and chemical properties have shown great potential for a variety of applications including catalysis, drug delivery, energy storage and conversion.36–40 Recently, we have successfully prepared nitrogen-doped carbon capsules with mesoporous carbon shells41 and macroporous voids. In addition, hierarchical mesoporous yolk–shell carbon spheres (YSCSs) with ordered mesoporous carbon cores and microporous carbon shells42 have also been synthesized via an extended Stöber method. The versatile coating techniques used for fabrication of various carbon spheres along with our well-established carbon spheres library37,43–45 allowed us to design and synthesise core–shell and yolk–shell metal oxide carbon composites with unique core@void@shell structures. This approach can also be further utilized for preparing other core–shell structures with various morphologies, such as polymer@polymer,42 Ag@polymer44 and α-Fe2O3 nano-spindle@polymer.46 In addition, the microbox-type structures have been shown to exhibit excellent energy storage performance; however, the available literature on their synthesis is very limited.47–49
To create active sites and further enhance the conductivity, catalytic activity and the interaction between carbon composites and reactants, doping heteroatoms such as nitrogen is usually used.41 Two different routes are usually employed to prepare N-doped carbon nanocomposites: (a) direct pyrolysis of nitrogen-containing precursors such as melamine foam, carbon nitride and polymer framework;37,41 and (b) post-synthesis incorporation of nitrogen atoms into a carbon framework via chemical vapour deposition (CVD),50 or thermal treatment in ammonia or polyaniline.50,51
Herein, we report a one-step Stöber coating method to synthesize unique core–shell, yolk–shell structured Fe3O4@carbon microboxes using Fe2O3 cubes as cores. These particles were used to fabricate anodes and examine the lithium storage capability; electrochemical testing of these anodes showed excellent cycling performance, high rate capability, and high Coulombic efficiency. The particles studied combine the advantages of core–shell structures and conductive carbon shells acting as buffer layers. This study provides some guidelines for selecting proper polymer coatings and calcination conditions to achieve the desired structure and functionality of nanomaterials for fabricating lithium ion battery electrodes, and to investigate the relationship between the structure of particles and the performance of these electrodes.
Experimental
Materials
The following chemicals were used in this study: formaldehyde (37% solution), aqueous ammonia (25% solution), ethanol (95–100%), 3-aminophenol (99%), ferric chloride (FeCl3) and sodium hydroxide (NaOH), all were purchased from Sigma-Aldrich and used as received without any further purification. Washing was achieved with ultrapure water, and if needed the reagent grade ethanol was applied. Ultrapure water was used for solution preparation.Synthesis of Fe2O3 microcubes
The Fe2O3 microcubes were synthesized through a simple precipitation method. In a typical synthesis, 50 mL of 5.4 M NaOH solution was mixed with 50 mL of 2.0 M FeCl3 solution with continuous stirring at 75 °C. The resultant Fe(OH)3 gel was continually stirred at the same temperature for 10 min, and transferred to a hydrothermal reactor, which was then placed into an oven for 4 days at 100 °C. The red product was collected and washed with DI-water and ethanol three times before drying at 80 °C overnight.Synthesis of Fe2O3@polymer core@shell structures (FP)
In a typical synthesis, CTAB (0.1 g) was dissolved in a mixture of water (20 mL) and ethanol (8 mL). Then, an aqueous solution of ammonia (NH4OH, 0.2 mL, 25 wt%) was added and stirred at room temperature for 0.5 h, followed by addition of Fe2O3 cubes (0.1 g). After stirring for 0.5 h, 3-aminophenol (0.04 g) was added into the abovementioned suspension. After stirring for an additional 30 min, a solution of formaldehyde (0.056 mL) was added. The mixture was stirred for 24 h at room temperature and subsequently heated for 24 h at 100 °C under static conditions in a Teflon-lined autoclave. The solid product was recovered by centrifugation and dried at 100 °C for 24 h. Subsequent variations of the synthesis process involved altering 3-aminophenol and formaldehyde to adjust the thickness of polymer coating; the resulting materials are denoted by FP-X, where X = 10, 23, 43 and 233 is the thickness of polymer expressed in nanometers.Synthesis of Fe3O4@carbon core@shell structures (FC)
The obtained Fe2O3@polymer core@shell structures were carbonized under N2 flow in the tube furnace at a heating rate of 1 °C min−1 up to 350 °C, kept for 2 h at that temperature, heated again at the heating rate at 1 °C min−1 up to 700 °C and dwelled for 4 h to achieve Fe2O3@carbon core@shell structures. Subsequent variations of the synthesis process involved various calcination temperatures: 500, 700 and 900 °C; the resulting samples are denoted as FC-X–Y, where X and Y refer to the thickness of polymer coating and calcination temperature, respectively.Results and discussion
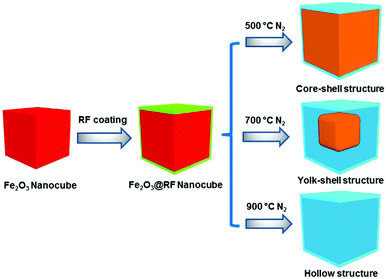
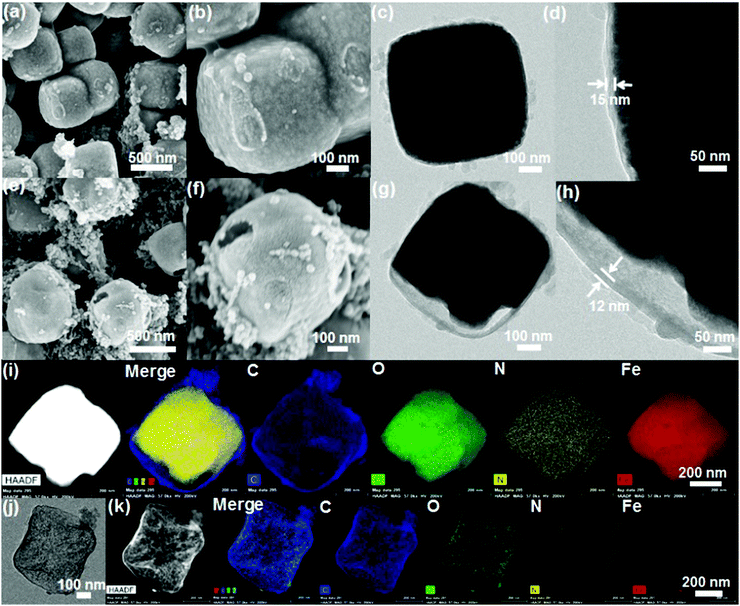
The proposed synthetic strategy for the preparation of core–shell and yolk–shell structured Fe3O4@carbon microboxes is illustrated in Scheme 1. First, uniform Fe2O3 microcubes were coated with aminophenol–formaldehyde (APF) resin polymer to obtain Fe2O3@APF polymer core–shell structures. In the subsequent step, these structures were converted into core–shell and yolk–shell structured Fe3O4@carbon and hollow carbon cages under a N2 atmosphere through varying the calcination temperature. A co-precipitation method was used to synthesize the uniform Fe2O3 microcubes with an average size of about 650 nm and a rough surface (Fig. 1a and b), which was also confirmed by TEM imaging (Fig. 1c and d). Then, the as-synthesized Fe2O3 microcubes were successfully coated with a uniform and smooth layer (Fig. 1e and f) of APF polymer with a thickness of around 23 nm as shown in Fig. 1g and h.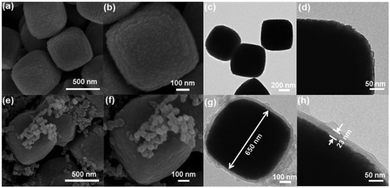 | ||
| Fig. 1 SEM images (a and b) and TEM images (c and d) of Fe2O3 cubes, SEM images (e and f) and TEM images (g and h) of FP-23. | ||
In the next step, these core–shell structured FP-23 particles were transformed into Fe3O4@carbon core–shell structures after carbonization in a N2 atmosphere at 500 °C, as shown in Fig. 2a–d. FC-23-500 particles presented a core–shell structure with a carbon shell thickness of about 15 nm. After elevating the temperature to 700 °C, hollow voids were created between the carbon shells and Fe3O4 cores (as shown in Fig. 2e and f). Note that the visible small impurities on the surface of FC-23-700 particles are carbon nanospheres derived from resin nanoparticles formed via self-polymerization side reactions during the Stöber coating process. The TEM images of FC-23-700 in Fig. 2g and h also confirm the formation of yolk–shell structures with shell thickness of about 12 nm. On increasing the temperature to 700 °C the core material was gradually released from the carbon shells to form large internal voids between the cores and carbon shells, which resulted in converting the core–shell structure of FC-23-500 to the yolk–shell structure of FC-23-700. The resulting yolk–shell structure of Fe3O4@carbon-23-700 was further examined by investigating the elemental distribution with a scanning transmission electron microscope (STEM) and the corresponding energy dispersive X-ray spectroscopy (EDS) mapping, as shown in Fig. 2i. As can be seen, elemental iron was well distributed in the core and the carbon element was uniformly distributed on the entire carbon box, further supporting the formation of yolk–shell structures. Hollow carbon boxes with shell thickness of about 8 nm (Fig. 2j) can be achieved after elevating the temperature to 900 °C, indicating that all the core material has escaped from the carbon shells.
This can be attributed to in situ reduction–carbonization of Fe2O3 cubes coated with nitrogen-doped carbon at high temperatures causing iron to escape from the carbon shells. Scanning transmission electron microscope (STEM) and the corresponding energy dispersive X-ray spectroscopy (EDS) mapping was used to investigate the distribution of each element. As can be seen from Fig. 2k for FC-23-900, the carbon, nitrogen and oxygen atoms were homogeneously distributed in the carbon box framework. Moreover, all the irons escaped from carbon boxes and only a small amount of iron could be found on the outer layers of the carbon boxes.
It is also worth mentioning that the structure parameters of the obtained Fe2O3@polymer core–shell structures were highly tuneable. As one of the advantages of the RF coating strategy, the thickness of aminophenol resin polymer could be adjusted from 10 to 233 nm by controlling the amount of aminophenol and formaldehyde while keeping other synthetic parameters unchanged. After calcination of FP-43 with a shell thick of 43 nm (Fig. S1a and b, ESI†) in a nitrogen atmosphere at 500 and 700 °C, the carbon shell of the obtained FC-43-500 shrank to 33 nm (Fig. S1c and d, ESI†) and 26 nm (Fig. S1e and f, ESI†), respectively. Elevating the calcination temperature to 900 °C resulted in the release of elemental iron from the core and damage to the core–shell structure, as shown in Fig. 1g and h. A similar phenomenon was also observed when the thickness of aminophenol polymer was increased to 233 nm, as shown in Fig. S2 (ESI†). Moreover, the thickness of carbon layer decreased to 152 nm and 110 nm when the temperature was increased to 500 °C and 700 °C, respectively. Higher calcination temperature at 900 °C resulted in the collapse of the core–shell structure. However, after coating a polymer layer of about 10 nm on the core surface (Fig. S3a and b, ESI†) and carbonizing it at 500 °C (Fig. S3c and d, ESI†) and 700 °C (Fig. S3e and f, ESI†), only bulk composite materials with carbon nanoparticles present on the surface were formed because the core Fe2O3 materials expanded and their confinement within thin carbon shell was extremely difficult.
The crystal structure and composition of FC particles was studied via XRD analysis, and the results are shown in Fig. 2 and Fig. S1 (ESI†). The complex XRD patterns at different calcination temperatures reflect the structural transformation from core–shell to yolk–shell and hollow carbon structures. Both XRD patterns of FC-23-500 and FC-43-500 (Fig. 3) exhibit the typical peaks of Fe3O4 (JCPD No. 65-3107) and no additional peaks are found, revealing that the Fe2O3 core materials were totally converted into Fe3O4. When the carbonization temperature reached 700 °C, new phase Fe3C (JCPDS No. 89-2867) appeared in FC-23-700 and FC-43-700. This indicates that Fe2O3 cubes were simultaneously reduced by a carbon precursor and finally converted to metallic iron, which could fuse and escape from the relatively thin carbon shell. Increasing the carbonization temperature to 900 °C resulted in the formation of metallic iron in FC-23-900. However, compared with FC-23-900, the XRD pattern of FC-43-900 showed additional peaks that could be ascribed to Fe3C and Fe3O4. This is probably due to the fact that the relatively thick polymer coating impeded heat transfer from the carbon shell to the core material and further restricted the reduction ability of the carbon layer.
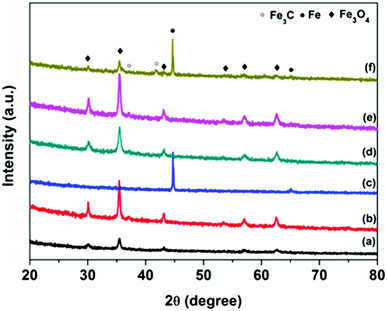 | ||
| Fig. 3 XRD patterns of FC-23-500 (a), FC-23-700 (b), FC-23-900 (c), FC-43-500 (d), FC-43-700 (e) and FC-43-900 (f). | ||
The surface areas of FC-23-500, FC-23-700, FC-23-900 and FC-43-700 were determined by nitrogen adsorption measurements, and the results are shown in Fig. 4 and Table S1 in the ESI.† As shown in Fig. 4a, the nitrogen adsorption isotherms of the four samples were type IV with a distinct hysteresis loop, indicating the presence of mesopores.52 Note that these isotherms showed a rapid increase in the adsorbed volume at relative pressures close to one, which is characteristic for type II isotherms observed for nonporous and macroporous materials. As presented in Table S1 (ESI†), the Brunauer–Emmett–Teller (BET) surface area and the pore volume obtained on the basis of the adsorption isotherm for FC-23-500 were 156 m2 g−1 and 0.3 cm3 g−1, respectively.
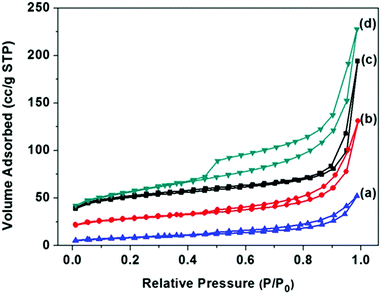 | ||
| Fig. 4 N2 adsorption–desorption isotherms and of (a) FC-23-900; (b) FC-23-700; (c) FC-23-500; (d) FC-43-700. | ||
As the calcination temperature increased to 700 and 900 °C, the BET surface area and pore volume decreased, respectively, to 90 m2 g−1 and 0.2 cm3 g−1 for FC-23-700 and 30 m2 g−1 and 0.08 cm3 g−1 for FC-23-900, which is probably due to the change of microstructure, increased crystallinity and iron particle sintering and agglomeration.53 After increasing the carbon layer thickness, the FC-43-500 particles showed a higher BET surface area and higher pore volume (184 m2 g−1 and 0.35 cm3 g−1) than FC-23-500 because of the larger amount of carbon in FC-43-500 particles and consequently larger amount of fine pores in the carbon shells.
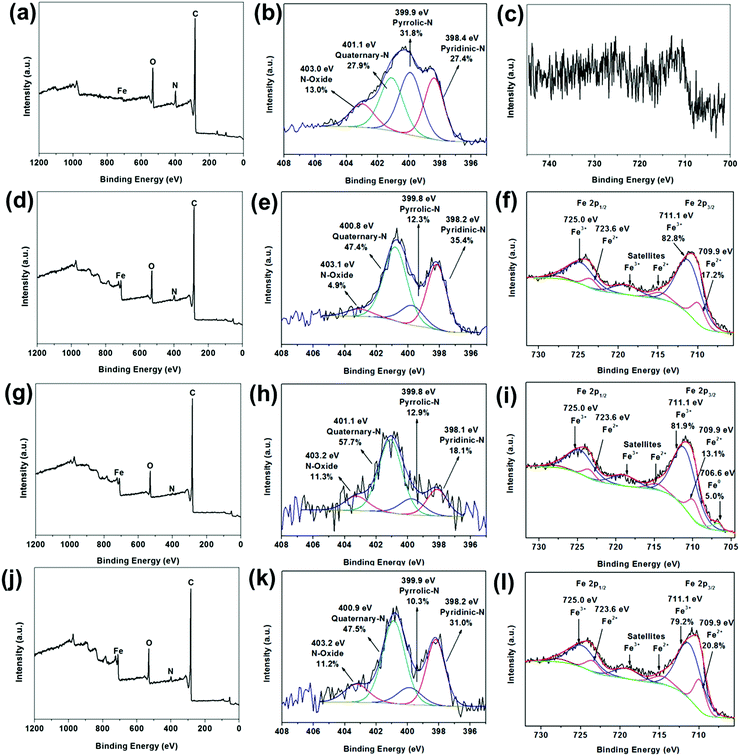
Fig. 5 illustrates the X-ray photoelectron spectroscopy (XPS) survey spectra of FC-23-500, FC-23-700, FC-23-900 and FC-43-700 with the corresponding high resolution spectra of N 1s and Fe 2p, respectively. As shown in Fig. 5a, only a trace amount of Fe can be detected (about 0.1 at%; Table S2, ESI†), indicating that nearly all Fe3O4 particles were successfully embedded in carbon boxes. The XPS high resolution narrow scan (Fig. 5b) shows four overlapping N1s peaks corresponding to pyridinic nitrogen (398.4 eV), pyrrolic nitrogen (399.9 eV), quaternary nitrogen (401.1 eV), and pyridine-oxide (403.0 eV)54 with relative concentration of about 27.4%, 31.8%, 27.9% and 13.0%, respectively. Similarly, the Fe 2p peak (Fig. 5c) is very weak after carbonization. The XPS survey spectra displayed in Fig. 5d, g and j also confirmed the presence of C, N, Fe, and O elements in the particles studied. The deconvoluted Fe 2p3/2 spectra are presented in Fig. 5f, i and l. As expected, a mixture of Fe2+ and Fe3+ could be observed across all the samples, which is consistent with the presence of Fe3O4.
However, the ratios of Fe2+![[thin space (1/6-em)]](https://www.rsc.org/images/entities/char_2009.gif) :
:![[thin space (1/6-em)]](https://www.rsc.org/images/entities/char_2009.gif) Fe3+ were somewhat lower than expected, which suggests the coexistence of Fe2O3. While the XRD analysis (Fig. 5d, g and j) show only the presence of Fe3O4, the XRD and XPS patterns are very different. The XRD technique probes the bulk, while XPS probes only the top few nanometers of the sample's surface (typically 2–5 nm). Hence, the discrepancy between the XRD and XPS results is not surprising as it is entirely possible that Fe2O3 is only present on the surface, while the bulk of particles contains predominantly Fe3O4. The surface sensitivity of XPS is also an important factor that indicates that iron particles can be leached out of the carbon boxes, as confirmed by the TEM images and XRD results, because photoelectrons emitted from any material within the box would be severely attenuated by the thickness of the carbon layer. In other words, XPS is incapable of probing any material within the carbon box. The deconvoluted Fe 2p spectrum of FC-23-900 (Fig. 5i), revealed also the presence of a small amount (about 5 at%) of metallic iron, which is consistent with the previously reported XRD data that suggests that iron migrates through the carbon box at higher temperatures.
Fe3+ were somewhat lower than expected, which suggests the coexistence of Fe2O3. While the XRD analysis (Fig. 5d, g and j) show only the presence of Fe3O4, the XRD and XPS patterns are very different. The XRD technique probes the bulk, while XPS probes only the top few nanometers of the sample's surface (typically 2–5 nm). Hence, the discrepancy between the XRD and XPS results is not surprising as it is entirely possible that Fe2O3 is only present on the surface, while the bulk of particles contains predominantly Fe3O4. The surface sensitivity of XPS is also an important factor that indicates that iron particles can be leached out of the carbon boxes, as confirmed by the TEM images and XRD results, because photoelectrons emitted from any material within the box would be severely attenuated by the thickness of the carbon layer. In other words, XPS is incapable of probing any material within the carbon box. The deconvoluted Fe 2p spectrum of FC-23-900 (Fig. 5i), revealed also the presence of a small amount (about 5 at%) of metallic iron, which is consistent with the previously reported XRD data that suggests that iron migrates through the carbon box at higher temperatures.
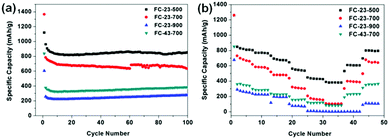
Fig. 6a shows the cycling performance of the as-prepared anode materials for lithium ion batteries at low current density of 0.1 A g−1. Noticeably, FC-23-500 exhibits the best electrochemical performance, regarding both the specific capacity and retention. The initial specific discharge capacity of FC-23-500 is 1120 mA h g−1, with a Coulombic efficiency of 86% (Fig. S4, ESI†). The excess of theoretical capacity in the initial cycle is attributed to the irreversible capacity related to the decomposition of electrolyte to form a solid electrolyte interface (SEI) layer. High capacities of 869 mA h g−1 and 857 mA h g−1 after 50 and 100 cycles could be achieved, respectively, indicating an excellent capacity retention of FC-23-500. In contrast, FC-23-700 exhibits an initial discharge capacity of 1366 mA h g−1 and a lower Coulombic efficiency of 58%. The discharge capacity of FC-23-700 after 100 cycles was 623 mA h g−1, which corresponds to 45.6% of its initial capacity. The FC-23-900 material had a low initial specific capacity of 605 mA h g−1 due to the low content of active material (iron oxide) in the composite. The discharge capacity of FC-23-900 after 100 cycles was only 280 mA h g−1, demonstrating its unsuitability for practical applications in lithium ion batteries at this stage. The electrochemical performance of FC-43-700 was also investigated to compare the effect of coating thickness. It was evident that the material with higher carbon content (FC-43-700) displayed lower specific capacity, retaining 351 mA h g−1 after 50 cycles and 380 mA h g−1 after 100 cycles.
Fig. 6b shows the rate capability of the FC-23-500, FC-23-700, FC-23-900 and FC-43-700 samples evaluated at the current densities in the range of 0.1–5 A g−1. The discharge capacity of the core–shell structured FC-23-500 remained at 804, 759, 674, 527, 420 and 384 mA h g−1 levels at the current densities of 0.1, 0.2, 0.5, 1, 2 and 5 A g−1, respectively. The FC-23-500 anode exhibited an excellent rate capability because it can deliver a high capacity of about 384 mA h g−1 at a high current of 5 A g−1. After decreasing the current density to 0.1 A g−1, the discharge capacity could recover to about 800 mA h g−1, implying an excellent reversibility of FC-23-500. In comparison, the FC-23-700, FC-23-900 and FC-43-700 samples deliver inferior capacities at all testing currents. They display lower discharge capacities at high rate, namely, 108, 3 and 88 mA h g−1, respectively, at the high current of 5 A g−1.
Fig. 7a shows the CV profile of FC-23-500 collected at a scan rate of 0.1 mV s−1 between 0.01 and 3.0 V. In the initial cathodic sweep, the broad peak appearing at about 0.5 V could be attributed to the reduction reaction of Fe ion to metallic Fe. In addition, this cathodic process was also associated with electrolyte decomposition to form the SEI layer and the reversible conversion reaction of lithium ion to form Li2O. An anodic peak was present at about 1.7 V, corresponding to the reversible oxidation of Fe. In the subsequent cycles, the cathodic peak potential shifted to 0.85 V. The CV curves of FC-23-500 are identical from the second cycle, indicating high reversibility and good capacity retention. In contrast, the CV curves of other samples show either lower reactivity or worse reversibility (in Fig. S5, ESI†). Fig. 7b shows the Nyquist plots of electrode materials measured at room temperature, which were collected by an electrochemical impedance spectroscopy (EIS) method. All profiles represent a combination of a straight line in the low frequency region and a semicircle in the moderate frequency region. The straight line in the low frequency region implies a typical Warburg behaviour, which is related to the diffusion of lithium ions in the solid electrodes. The depressed semicircle in the moderate frequency region is attributed to the charge transfer process. The numerical value of the diameter of the semicircle on the Zre axis gives an approximate indication of the charge transfer resistance (Rct). Therefore, as can be seen, the trend of charge transfer resistance was in the following order: FC-23-500 < FC-23-700 < FC-23-900.
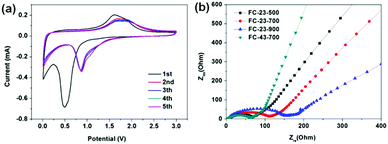 | ||
| Fig. 7 (a) Cyclic voltammograms of FC-23-500 at a 0.1 mV s−1 scan rate between 0.01 and 3.0 V, (b) Nyquist plots of the electrodes composed of FC-23-500, FC-23-700, FC-23-900 and FC-43-700. | ||
The abovementioned electrochemical data indicate that the core–shell structured FC-23-500 shows the best overall performance in terms of the specific capacity, long term retention and high rate performance. The significantly enhanced electrochemical performance of FC-23-500 can be attributed to the unique core–shell structure ensuring sufficient electrolyte/electrode contact area, strengthened structure over long term electrochemical processes, and high dynamics for lithium diffusion. The FC-23-700 sample showed lower specific capacity, larger irreversible capacity and worse retention due to the fragmentation of the outer carbon shells, causing inferior structural stability and additional side reaction during SEI formation. During the cycling, the broken outer carbon shells (Fig. 2f) were unable to protect the Fe3O4 particles, and leaching could take place from these shells after long term cycling. The FC-23-900 material showed the lowest capacity due to the low content of active material (iron oxide) in the composite. Analysis of CV and EIS data demonstrates the same trend in reactivity, reversibility and lithium ion diffusion kinetics, which is expressed in the following order: FC-23-500 > FC-23-700 > FC-23-900, and is consistent with the electrochemical behaviour of these materials.
Conclusions
In summary, the Fe3O4–carbon composites with core–shell, yolk–shell and hollow microboxes were facilely synthesized by a polymer coating of Fe3O4 microboxes, followed by carbonization at different temperatures. The core–shell structured Fe3O4–carbon composites (FC-23-500) possess a high specific surface area of 156 m2 g−1, large pore volume of 0.3 cm3 g−1, and a well-defined cube-like structure uniformly wrapped by N-doped carbon layer. The yolk–shell structures and hollow Fe3O4–carbon composites could only be achieved when the polymer thickness exceeded 23 nm. This study shows an excellent performance of these materials in lithium ion batteries. The core–shell structured FC-23-500 electrode delivered a highly reversible capacity of 857 mA h g−1 at a current density of 0.1 A g−1 after 100 cycles. Moreover, this electrode showed a superior high-rate capability and achieved a reversible capacity of 384 mA h g−1 at a current density of 5 A g−1. Due to an inadequate protective carbon shell and Fe3O4 leaching out of the carbon shells, inferior cycle performance and rate capability were observed when the yolk–shell and hollow particles were used as the electrodes. A great performance of the core–shell Fe3O4–carbon structures proves the importance of rational design and fabrication of core–shell particles with tunable structures, multi-chemical composition and improved functionalities.Acknowledgements
The authors acknowledge the facilities, scientific and technical assistance of the Curtin University Electron Microscope Laboratories, a facility partially funded by the University, State and Commonwealth Governments. The use of equipment, scientific and technical assistance of the WA X-ray Surface Analysis Facility, funded by the Australian Research Council LIEF grant LE120100026 is also acknowledged. The authors also wish to acknowledge the facilities, and the scientific and technical assistance of the Australian Microscopy & Microanalysis Research Facility at the Centre for Microscopy, Characterization & Analysis (CMCA), the University of Western Australia (UWA), a facility funded by the University, State and Commonwealth Governments. The authors would also like to thank Prof. Martin Saunders and Dr Aaron Dodd for TEM training from CMCA in UWA, Dr Chi Zhang for XRD test, Prof. Shaomin Liu for fruitful discussion. H. Liu thanks the support from Shanghai Easter Scholar Fellowship, ARC DECRA Fellowship, UTS CPD Fellowship and ATN Seed Fund.Notes and references
- J. M. Tarascon and M. Armand, Nature, 2001, 414, 359–367 CrossRef CAS PubMed.
- Y. Idota, T. Kubota, A. Matsufuji, Y. Maekawa and T. Miyasaka, Science, 1997, 276, 1395–1397 CrossRef CAS.
- K. T. Nam, D. W. Kim, P. J. Yoo, C. Y. Chiang, N. Meethong, P. T. Hammond, Y. M. Chiang and A. M. Belcher, Science, 2006, 312, 885–888 CrossRef CAS PubMed.
- G. Zhou, D. W. Wang, F. Li, L. Zhang, N. Li, Z. S. Wu, L. Wen, G. Q. Lu and H.-M. Cheng, Chem. Mater., 2010, 22, 5306–5313 CrossRef CAS.
- W. M. Zhang, X. L. Wu, J. S. Hu, Y. G. Guo and L. J. Wan, Adv. Funct. Mater., 2008, 18, 3941–3946 CrossRef CAS.
- S. H. Lee, S.-H. Yu, J. E. Lee, A. Jin, D. J. Lee, N. Lee, H. Jo, K. Shin, T. Y. Ahn, Y. W. Kim, H. Choe, Y. E. Sung and T. Hyeon, Nano Lett., 2013, 13, 4249–4256 CrossRef CAS PubMed.
- F.-X. Ma, H. Hu, H. B. Wu, C.-Y. Xu, Z. Xu, L. Zhen and X. W. Lou, Adv. Mater., 2015, 27, 4097–4101 CrossRef CAS PubMed.
- X. W. Lou, L. A. Archer and Z. C. Yang, Adv. Mater., 2008, 20, 3987–4019 CrossRef CAS.
- J. Liu, S. Z. Qiao, J. S. Chen, X. W. Lou, X. R. Xing and G. Q. Lu, Chem. Commun., 2011, 47, 12578–12591 RSC.
- J. Liu, N. P. Wickramaratne, S. Z. Qiao and M. Jaroniec, Nat. Mater., 2015, 14, 763–774 CrossRef CAS PubMed.
- S. Xu, C. M. Hessel, H. Ren, R. Yu, Q. Jin, M. Yang, H. Zhao and D. Wang, Energy Environ. Sci., 2014, 7, 632–637 CAS.
- J. Qi, X. Lai, J. Wang, H. Tang, H. Ren, Y. Yang, Q. Jin, L. Zhang, R. Yu, G. Ma, Z. Su, H. Zhao and D. Wang, Chem. Soc. Rev., 2015, 44, 6749–6773 RSC.
- X. Lai, J. E. Halpert and D. Wang, Energy Environ. Sci., 2012, 5, 5604–5618 CAS.
- J. Wang, N. Yang, H. Tang, Z. Dong, Q. Jin, M. Yang, D. Kisailus, H. Zhao, Z. Tang and D. Wang, Angew. Chem., Int. Ed., 2013, 52, 6417–6420 CrossRef CAS PubMed.
- H. Ren, R. Yu, J. Wang, Q. Jin, M. Yang, D. Mao, D. Kisailus, H. Zhao and D. Wang, Nano Lett., 2014, 14, 6679–6684 CrossRef CAS PubMed.
- J. Wang, H. Tang, L. Zhang, H. Ren, R. Yu, Q. Jin, J. Qi, D. Mao, M. Yang, Y. Wang, P. Liu, Y. Zhang, Y. Wen, L. Gu, G. Ma, Z. Su, Z. Tang, H. Zhao and D. Wang, Nat. Energy, 2016, 1, 16050–16058 CrossRef CAS.
- F. Wang, J. Wang, H. Ren, H. Tang, R. Yu and D. Wang, Inorg. Chem. Front., 2016, 3, 365–369 RSC.
- H. Ren, J. Sun, R. Yu, M. Yang, L. Gu, P. Liu, H. Zhao, D. Kisailus and D. Wang, Chem. Sci., 2016, 7, 793–798 RSC.
- J. Wang, H. Tang, H. Wang, R. Yu and D. Wang, Mater. Chem. Front., 2017, 1, 414–430 RSC.
- L. Yu, H. B. Wu and X. W. D. Lou, Acc. Chem. Res., 2017, 50, 293–301 CrossRef CAS PubMed.
- L. Yu, H. Hu, H. B. Wu and X. W. Lou, Adv. Mater., 2017, 1604563, DOI:10.1002/adma.201604563.
- Z. Li, H. B. Wu and X. W. Lou, Energy Environ. Sci., 2016, 9, 3061–3070 CAS.
- Y. Boyjoo, M. Wang, V. K. Pareek, J. Liu and M. Jaroniec, Chem. Soc. Rev., 2016, 45, 6013–6047 RSC.
- Y. Zhao, L. P. Wang, M. T. Sougrati, Z. Feng, Y. Leconte, A. Fisher, M. Srinivasan and Z. Xu, Adv. Energy Mater., 2017, 1601424, DOI:10.1002/aenm.201601424.
- J. Lian, X. Duan, J. Ma, P. Peng, T. Kim and W. Zheng, ACS Nano, 2009, 3, 3749–3761 CrossRef CAS PubMed.
- Y. Cai, X. Li, L. Wang, H. Gao, Y. Zhao and J. Ma, J. Mater. Chem. A, 2015, 3, 1396–1399 CAS.
- X. Li, J. Xu, Z. Zhang, L. Mei, C. Cui, H. K. Liu and J. Ma, J. Mater. Chem. A, 2015, 3, 3257–3260 CAS.
- L. Wang, S. Dou, J. Xu, H. K. Liu, S. Wang, J. Ma and S. X. Dou, Chem. Commun., 2015, 51, 11791–11794 RSC.
- L. Zhang, H. B. Wu and X. W. Lou, Adv. Energy Mater., 2014, 4, 1300958 CrossRef.
- J. Liu and D. Xue, Nanoscale Res. Lett., 2010, 5, 1525–1534 CrossRef CAS PubMed.
- N. Liu, H. Wu, M. T. McDowell, Y. Yao, C. Wang and Y. Cui, Nano Lett., 2012, 12, 3315–3321 CrossRef CAS PubMed.
- Y. Zhao, X. Li, J. Liu, C. Wang, Y. Zhao and G. Yue, ACS Appl. Mater. Interfaces, 2016, 8, 6472–6480 CAS.
- S. Li, J. Niu, Y. C. Zhao, K. P. So, C. Wang, C. A. Wang and J. Li, Nat. Commun., 2015, 6, 7872–7878 CrossRef CAS PubMed.
- Z. W. Seh, W. Li, J. J. Cha, G. Zheng, Y. Yang, M. T. McDowell, P.-C. Hsu and Y. Cui, Nat. Commun., 2013, 4, 1331–1336 CrossRef PubMed.
- A. H. Lu, X. Q. Zhang, Q. Sun, Y. Zhang, Q. W. Song, F. Schüth, C. Y. Chen and F. Cheng, Nano Res., 2016, 9, 1460–1469 CrossRef CAS.
- J. Liu, H. Q. Yang, F. Kleitz, Z. G. Chen, T. Y. Yang, E. Strounina, G. Q. Lu and S. Z. Qiao, Adv. Funct. Mater., 2012, 22, 591–599 CrossRef CAS.
- J. Liu, T. Y. Yang, D. W. Wang, G. Q. M. Lu, D. Y. Zhao and S. Z. Qiao, Nat. Commun., 2013, 4, 2798–2804 Search PubMed.
- H. Tian, M. Saunders, A. Dodd, K. O'Donnell, M. Jaroniec, S. Liu and J. Liu, J. Mater. Chem. A, 2016, 4, 3721–3727 CAS.
- J. Zhang, H. Hu, Z. Li and X. W. Lou, Angew. Chem., Int. Ed., 2016, 55, 3982–3986 CrossRef CAS PubMed.
- Z. G. Teng, X. D. So, Y. Y. Zheng, J. J. Zhang, Y. Liu, S. J. Wang, J. Wu, G. T. Chen, J. D. Wang, D. Y. Zhao and G. M. Lu, J. Am. Chem. Soc., 2015, 137, 7935–7944 CrossRef CAS PubMed.
- T. Yang, J. Liu, R. Zhou, Z. Chen, H. Xu, S. Z. Qiao and M. J. Monteiro, J. Mater. Chem. A, 2014, 2, 18139–18146 CAS.
- T. Yang, R. Zhou, D.-W. Wang, S. P. Jiang, Y. Yamauchi, S. Z. Qiao, M. J. Monteiro and J. Liu, Chem. Commun., 2015, 51, 2518–2521 RSC.
- J. Liu, S. Z. Qiao, S. B. Hartono and G. Q. Lu, Angew. Chem., Int. Ed., 2010, 49, 4981–4985 CrossRef CAS PubMed.
- T. Yang, J. Liu, Y. Zheng, M. J. Monteiro and S. Z. Qiao, Chem. – Eur. J., 2013, 19, 6942–6945 CrossRef CAS PubMed.
- J. Tang, J. Liu, C. Li, Y. Li, M. O. Tade, S. Dai and Y. Yamauchi, Angew. Chem., Int. Ed., 2015, 54, 588–593 CAS.
- 3. J. Zhang, K. Wang, Q. Xu, Y. Zhou, F. Cheng and S. Guo, ACS Nano, 2015, 9, 3369–3376 CrossRef PubMed.
- X.-Y. Yu, H. Hu, Y. Wang, H. Chen and X. W. Lou, Angew. Chem., Int. Ed., 2015, 54, 7395–7398 CrossRef CAS PubMed.
- Y. Dai, L. Chen, V. Babayan, Q. Cheng, P. Saha, H. Jiang and C. Li, J. Mater. Chem. A, 2015, 3, 21337–21342 CAS.
- Z. Liu, X.-Y. Yu and U. Paik, Adv. Energy Mater., 2016, 6, 1502318 CrossRef.
- R. L. Liu, D. Q. Wu, X. L. Feng and K. Mullen, Angew. Chem., Int. Ed., 2010, 49, 2565–2569 CrossRef CAS PubMed.
- R. Silva, D. Voiry, M. Chhowalla and T. Asefa, J. Am. Chem. Soc., 2013, 135, 7823–7826 CrossRef CAS PubMed.
- H. Jiang, L. Yang, C. Li, C. Yan, P. S. Lee and J. Ma, Energy Environ. Sci., 2011, 4, 1813–1819 CAS.
- K. Kiatkittipong, J. Scott and R. Amal, ACS Appl. Mater. Interfaces, 2011, 3, 3988–3996 CAS.
- X. Li, X. Pan, L. Yu, P. Ren, X. Wu, L. Sun, F. Jiao and X. Bao, Nat. Commun., 2013, 5, 3688–3695 Search PubMed.
Footnote |
| † Electronic supplementary information (ESI) available: Experimental details for cell assembly and electrochemical testing and materials characterization, TEM images of FP with different polymer thickness and calcination conditions, physical properties, Coulombic efficiency curves and cyclic voltammograms. See DOI: 10.1039/c7qm00059f |
| This journal is © the Partner Organisations 2017 |

