
Benzothiazoles-substituted tetraphenylethylenes: synthesis, structure, aggregation-induced emission and biological studies†
Karunesh
Keshav
a,
Mukesh Kumar
Kumawat
 b,
Rohit
Srivastava
b and
M.
Ravikanth
*a
b,
Rohit
Srivastava
b and
M.
Ravikanth
*a
aDepartment of Chemistry, Indian Institute of Technology Bombay, Powai, Mumbai 400 076, India. E-mail: ravikanth@chem.iitb.ac.in; Fax: +91-22-5723480; Tel: +91-22-5767176
bDepartment of Biosciences and Bioengineering, Indian Institute of Technology Bombay, Powai, Mumbai 400 076, India
First published on 18th January 2017
Abstract
New tetraphenylethylene (TPE) bearing benzothiazoles at the ortho-position to OH and OCH3 groups, 1a and 1b, respectively, were prepared. Benzothiazole tetraphenylethylenes 1a/1b were synthesized by the acid-catalysed condensation reaction of an appropriate di-aldehyde, such as 5,5′-(2,2-diphenylethylene-1,1-diyl)bis(2-hydroxybenzaldehyde) 2a or 5,5′-(2,2-diphenylethylene-1,1-diyl)bis(2-methoxybenzaldehyde) 2b, with 2-aminothiophenol. Compound 1a exhibited an excited state intramolecular proton transfer (ESIPT) phenomenon. The photophysical properties of compounds 1a/1b in solution and aggregated form, along with their structure–property relationships, were comparatively investigated. The study showed that the substituent groups on TPE at the ortho position to benzothiazole have a great influence on the electronic structure, molecular packing, and aggregation-induced emission properties. Moreover, the cell viability studies by MTT assay and fluorescence cell imaging experiments proved the low-toxicity of 1a and that it can be used as a potential contrasting agent in cell imaging studies.
Introduction
Excited state intramolecular proton transfer (ESIPT) has attracted significant attention because the ESIPT fluorophores have remarkable properties such as large Stoke's shifted fluorescence without self-absorption as well as easy population inversion in the proton transferred keto form, dual emission, an ultrafast process, and spectral sensitivity to the surrounding medium.1 The pre-requisite for ESIPT is the presence of an intramolecular hydrogen bond between the proton donor and proton acceptor groups near each other in the molecule.2 Most of the ESIPT chromophores show dual emission, a short wavelength emission due to the excited state enol form (E*) (normal emission) and a longer one due to excited state keto form (K*) (ESIPT emission), through a well-established four-level photocycle.3 ESIPT fluorophores have potential applications in numerous fields such as fluorescence imaging, new areas in biotechnology, radiation scintillators, photostabilizers, luminescent materials, molecular probes, laser dyes, UV-absorbers, and molecular logic gates.4–7 Interestingly, most of the reported ESIPT-based chromophores are highly emissive in solutions with high fluorescence quantum efficiencies but are weakly emissive in the solid state due to the aggregation-caused quenching (ACQ).8 Recently, solid-state emitters with high fluorescence quantum efficiencies have attracted extensive attention in the field of optoelectronic devices and laser applications.9 To achieve solid-state emission, it is necessary to suppress the other radiationless deactivation pathways that occur in the excited state.10 Different strategies, such as controlling the mode of molecular packing, dendrimer encapsulation, aggregation-induced emission (AIE), aggregation-induced enhanced emission (AIEE), the restriction of intramolecular rotation (RIR), polymer doping, and the restriction of twisted intramolecular charge transfer (RTICT), were exploited to obtain solid-state emissions for various types of ESIPT chromophores.11 A perusal of the literature reveals that although there is vast literature available on ESIPT molecules that show strong emissions with high fluorescence quantum yields in solution, the ESIPT inspired solid state emitters have not been explored to a large extent and are currently under active investigation.12 Among various strategies to obtain strong fluorescence in the solid-state from ESIPT fluorophores, an aggregation-induced emission strategy has attracted significant attention in recent years.13 This is because in the AIE effect, even if the individual molecules are non-fluorescent, their aggregates become fluorescent, resulting from the irradiative energy-loss reduction due to the restriction of the intramolecular rotation. An attractive strategy to obtain ESIPT based solid state chromophores is to attach an ESIPT chromophore to a well-known AIE luminogen such as the tetraphenylethylene molecule, which has not been, to the best of our knowledge, explored significantly.14 Herein, we report the synthesis of two covalently linked TPE-benzothiazole dyads 1a and 1b (Chart 1) in which the benzothiazole system in dyad 1a acts as an ESIPT chromophore due to the presence of an ortho-hydroxyl group, whereas the benzothiazole system in dyad 1b cannot act as an ESIPT chromophore due to the presence of a methoxy group at the ortho position. Both compounds showed AIE behavior, and compound 1a is an orange-red fluorescent solid, whereas compound 1b is a blue fluorescent solid. The origin of the difference in the fluorescent color and aggregation induced emission phenomenon is discussed on the basis of the structure–property relationship.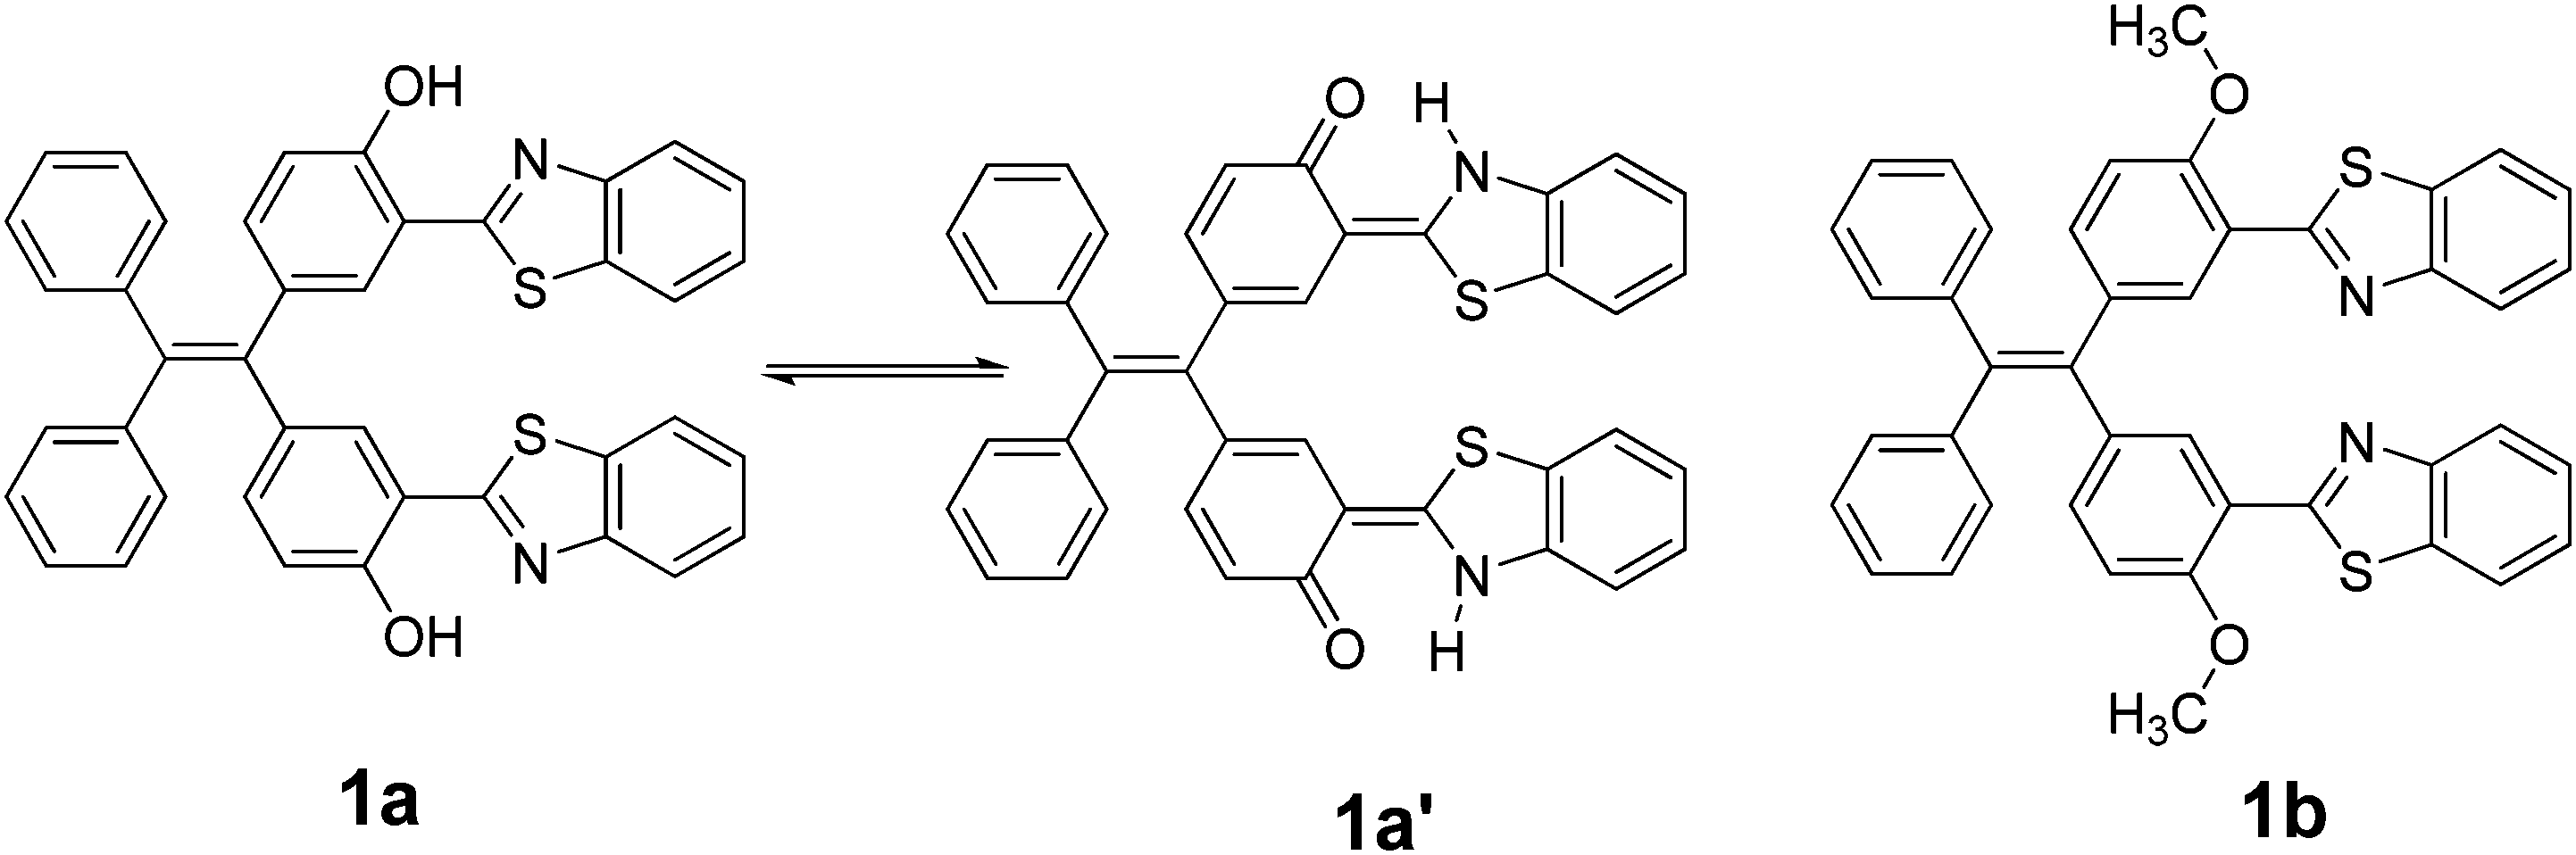 | ||
| Chart 1 Molecular structures of compounds 1a and 1b. | ||
Results and discussion
Synthesis and NMR characterization
The target compounds, covalently linked TPE-benzothiazole dyads 1a and 1b were synthesized as shown in Scheme 1. The required precursors, 5,5′-(2,2-diphenylethylene-1,1-diyl)bis(2-hydroxybenzaldehyde) 2a and 5,5′-(2,2-diphenylethylene-1,1-diyl)bis(2-methoxybenzaldehyde) 2b, were prepared by formylation of the appropriate compounds, dihydroxytetraphenylethylene or dimethoxytetraphenylethylene, under duff-formylation conditions by following the literature procedure.15 The covalently linked TPE-benzothiazole compounds 1a–1b were synthesized by an acid catalyzed condensation reaction of the corresponding bis-carboxaldehyde compound 2a/2b with 2-aminothiophenol. The appropriate bis-carboxaldehyde 2a/2b was reacted with two equivalents of 2-aminothiophenol in the presence of a catalytic amount of HCl/H2O2 in ethanol for 1 h followed by silica gel column chromatographic purification, which afforded the TPE-benzothiazole dyad 1a/1b as a white solid in 72–76% yields. The compounds 1a and 1b were characterized by HRMS, 1D, 2D NMR, and X-ray crystallographic techniques. The molecular ion peak in HRMS confirmed the identities of the compounds 1a/1b.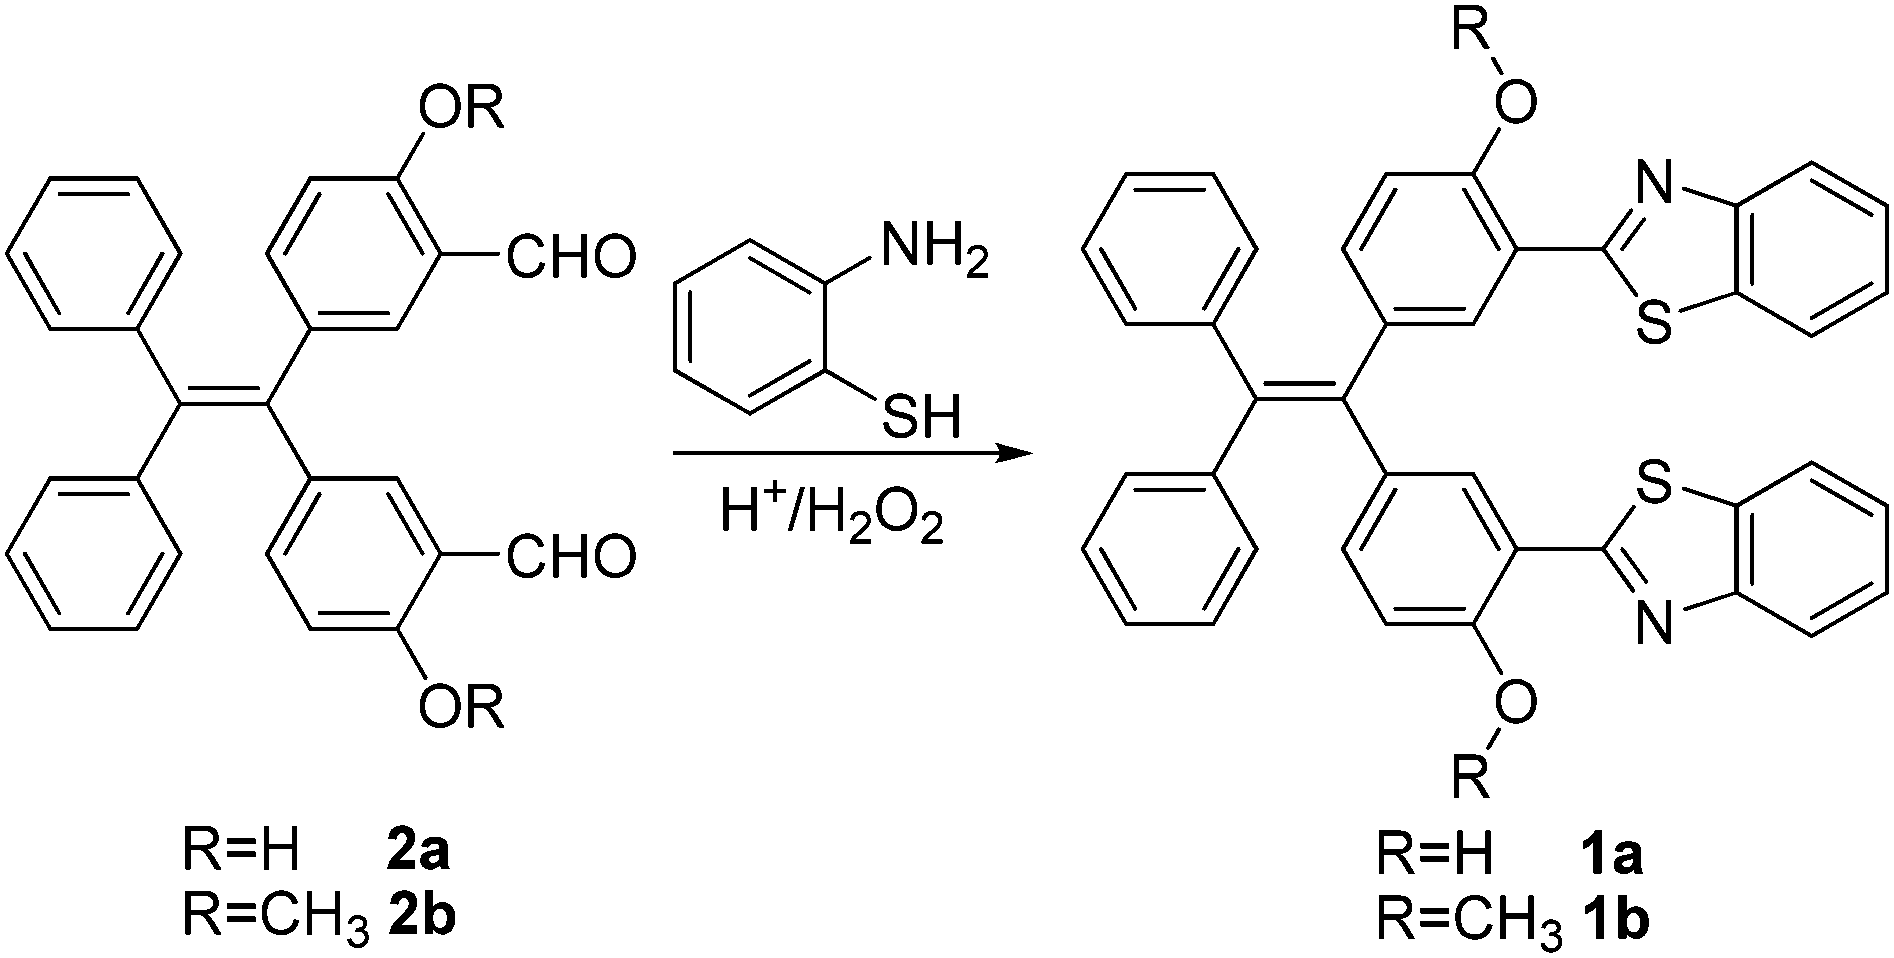 | ||
| Scheme 1 Synthesis of compounds 1a and 1b. | ||
The comparison of the 1H-NMR spectra of 1a and 1b is presented in Fig. 1(a), and the partial 1H–1H COSY NMR spectrum of 1a is presented in Fig. 1b. All resonances in the NMR spectra of compounds 1a and 1b were identified and assigned based on their position, integration, coupling constant and cross-peak correlations in the COSY spectra. In 1H NMR spectrum of compound 1a, the downfield resonance at 7.93 ppm was assigned to the proton that is adjacent to the benzothiazole nitrogen (type e). The type e resonance showed a cross peak correlation with a resonance at 7.47 ppm, which in turn showed a correlation with a resonance at 7.36 ppm. Thus, the resonances at 7.47 and 7.36 ppm were assigned as type f and type g protons, respectively. The resonance at 7.81 ppm was identified as a type h proton based on its correlation with the type g proton. The most upfield resonance at 6.90 ppm was identified as a type d proton as this proton is adjacent to the –OH group. The resonance that appeared in the cluster of aryl resonances in the region of 7.15–7.11 ppm was assigned as a type c proton based on its cross-peak correlation with the type d proton, and the singlet resonance at 7.41 ppm was identified as a type b proton. The –OH proton was observed at 12.50 ppm. Similarly, all resonances of compound 1b were also identified by adopting the same strategy. In compound 1b, the –OCH3 resonance appeared at 4.01 ppm. Thus, 1D and 2D NMR spectroscopy were used to identify all resonances in compounds 1a and 1b.
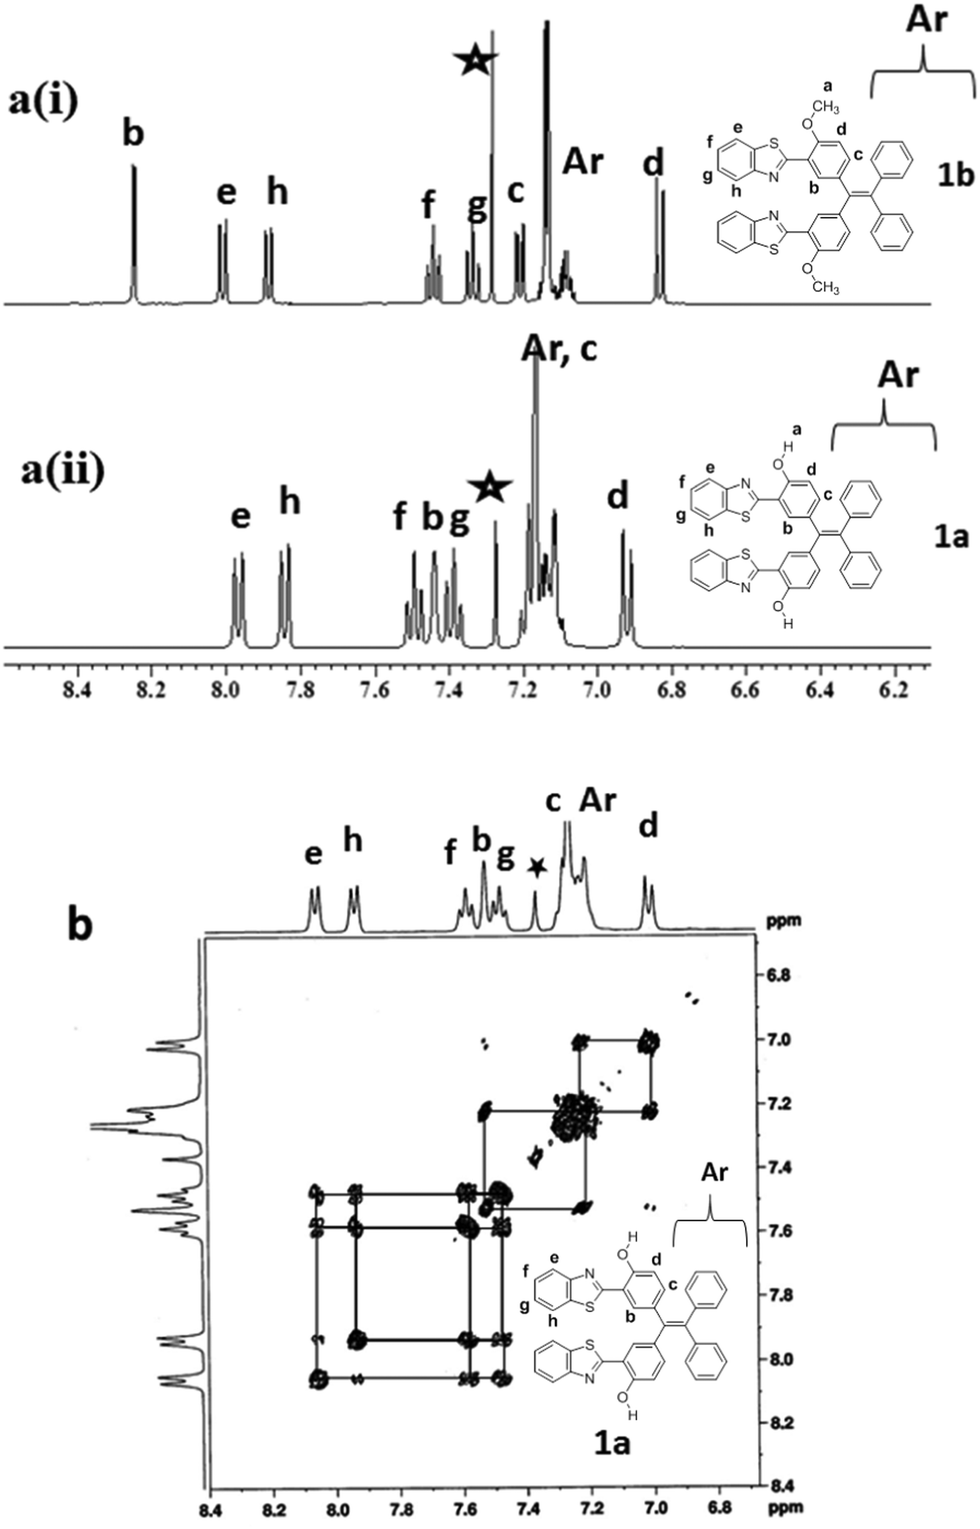 | ||
| Fig. 1 (a) Comparison of 1H-NMR spectra of compounds 1a and 1b obtained in CDCl3 (* is the residual solvent peak) at room temperature and (b) partial 1H–1H COSY NMR spectrum of 1a acquired in CDCl3 at room temperature. | ||
X-ray crystal structures of compounds 1a and 1b
The single crystals of 1a and 1b (CCDC 1458979 and 1459001) were obtained by slow evaporation from hexane/ethyl acetate solvent mixtures over a period of one week. Both the TPE-benzothiazoles 1a and 1b were crystallized in a triclinic space group P![[1 with combining macron]](https://www.rsc.org/images/entities/char_0031_0304.gif) . The crystal structure and data refinement parameters for 1a and 1b are given in Table S1 (ESI†). The crystal structure of 1a shows that the benzothiazole ring is planar and slightly twisted with respect to the phenyl ring, and it makes dihedral angles of 4.13(6)° and 6.88(7)°. The dihedral angle between the phenyls containing the benzothiazole rings was found to be 74.2(1)°, and for the unsubstituted phenyls, the dihedral angle was 84.0(1)°. In 1a, the nitrogen atom of the benzothiazole unit is directed towards the hydroxyl group present on the phenyl ring due to intramolecular (N⋯O–H) hydrogen bonding (Fig. 2a), and the two hydroxyl groups were involved in H-bonding with the nitrogen atom of the benzothiazole moiety (N1–H1 1.902(2) Å, angle O1–H1–N1 147.2(2)°; N2–H2 1.926(2) Å, angle O2–H2–N2 147.0(2)°).
. The crystal structure and data refinement parameters for 1a and 1b are given in Table S1 (ESI†). The crystal structure of 1a shows that the benzothiazole ring is planar and slightly twisted with respect to the phenyl ring, and it makes dihedral angles of 4.13(6)° and 6.88(7)°. The dihedral angle between the phenyls containing the benzothiazole rings was found to be 74.2(1)°, and for the unsubstituted phenyls, the dihedral angle was 84.0(1)°. In 1a, the nitrogen atom of the benzothiazole unit is directed towards the hydroxyl group present on the phenyl ring due to intramolecular (N⋯O–H) hydrogen bonding (Fig. 2a), and the two hydroxyl groups were involved in H-bonding with the nitrogen atom of the benzothiazole moiety (N1–H1 1.902(2) Å, angle O1–H1–N1 147.2(2)°; N2–H2 1.926(2) Å, angle O2–H2–N2 147.0(2)°).
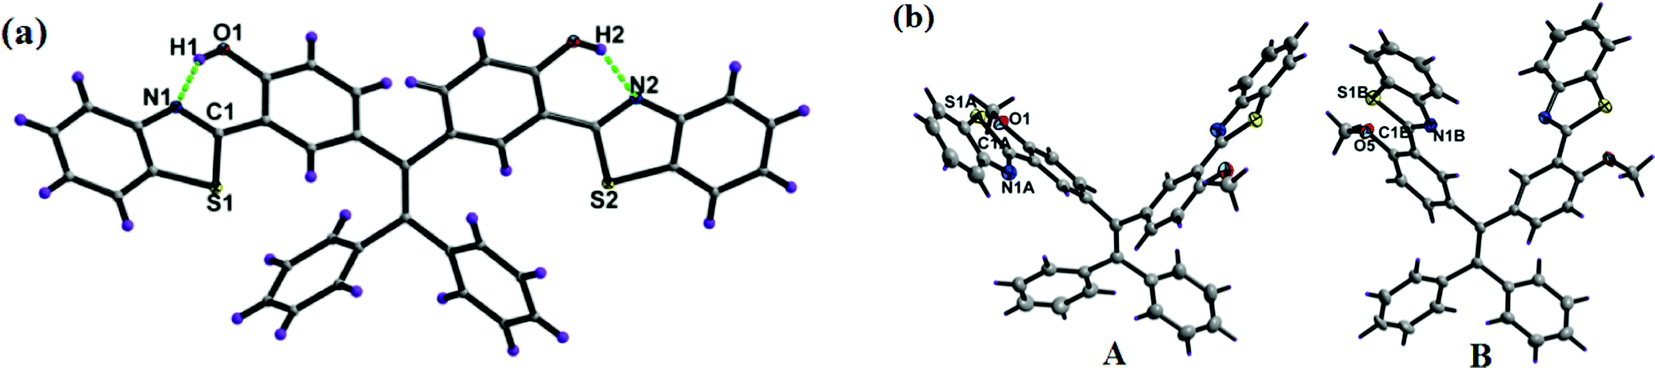 | ||
| Fig. 2 X-ray crystal structure of compounds 1a and 1b, dashed lines indicate intramolecular hydrogen bonds. Thermal ellipsoids are drawn at the 50% probability level. | ||
The crystal structure of 1b contains two molecules, A and B, in an asymmetric unit, but their geometric parameters do not differ significantly. In 1b, the benzothiazole ring is planar and slightly twisted with respect to the phenyl ring with a dihedral angle of 3.90(7)° and 5.99(5)° for molecule A, and 3.92(6)° and 15.47(6)° for molecule B. The other geometric parameters within the benzothiazole framework and tetraphenylethylene moiety are as usually observed. In structure 1b, the nitrogen atom of the benzothiazole was oriented opposite to the methoxy group, unlike 1a where the nitrogen atom of the benzothiazole was oriented towards the hydroxyl group and involved in the intramolecular hydrogen bonding.
The packing diagram of compound 1a is shown in Fig. 3a. It indicates that the molecules are arranged in a co-facial manner. Significant intermolecular π–π stacking was observed, and the distance between the aromatic benzothiazole moieties of the two adjacent molecules in 1a is 3.349(1) Å, which supports the weak π–π interactions between the molecules (Fig. 3a).16,17 In 1a, the planar benzothiazole part adopts an edge to face stacking C(4)–H(4)⋯π(C29–C34) with the contact distance of 3.119(1) Å to form a linear chain-like structure along the c axis (Fig. S9, ESI†). This chain grows further along the same direction through edge to face interaction [C(39)–H(39)⋯π(C8–C13) distance is 3.481(1) Å and C(6)–H(6)⋯π(C21–C26) distance is 2.771(1) Å] to form a sheet-like structure. The benzothiazole unit present in this sheet interacts with other benzothiazole units present above and below the adjacent molecules via π⋯π stacking interactions (C21–C26) to form a complex 3D structural arrangement (Fig. 3b).
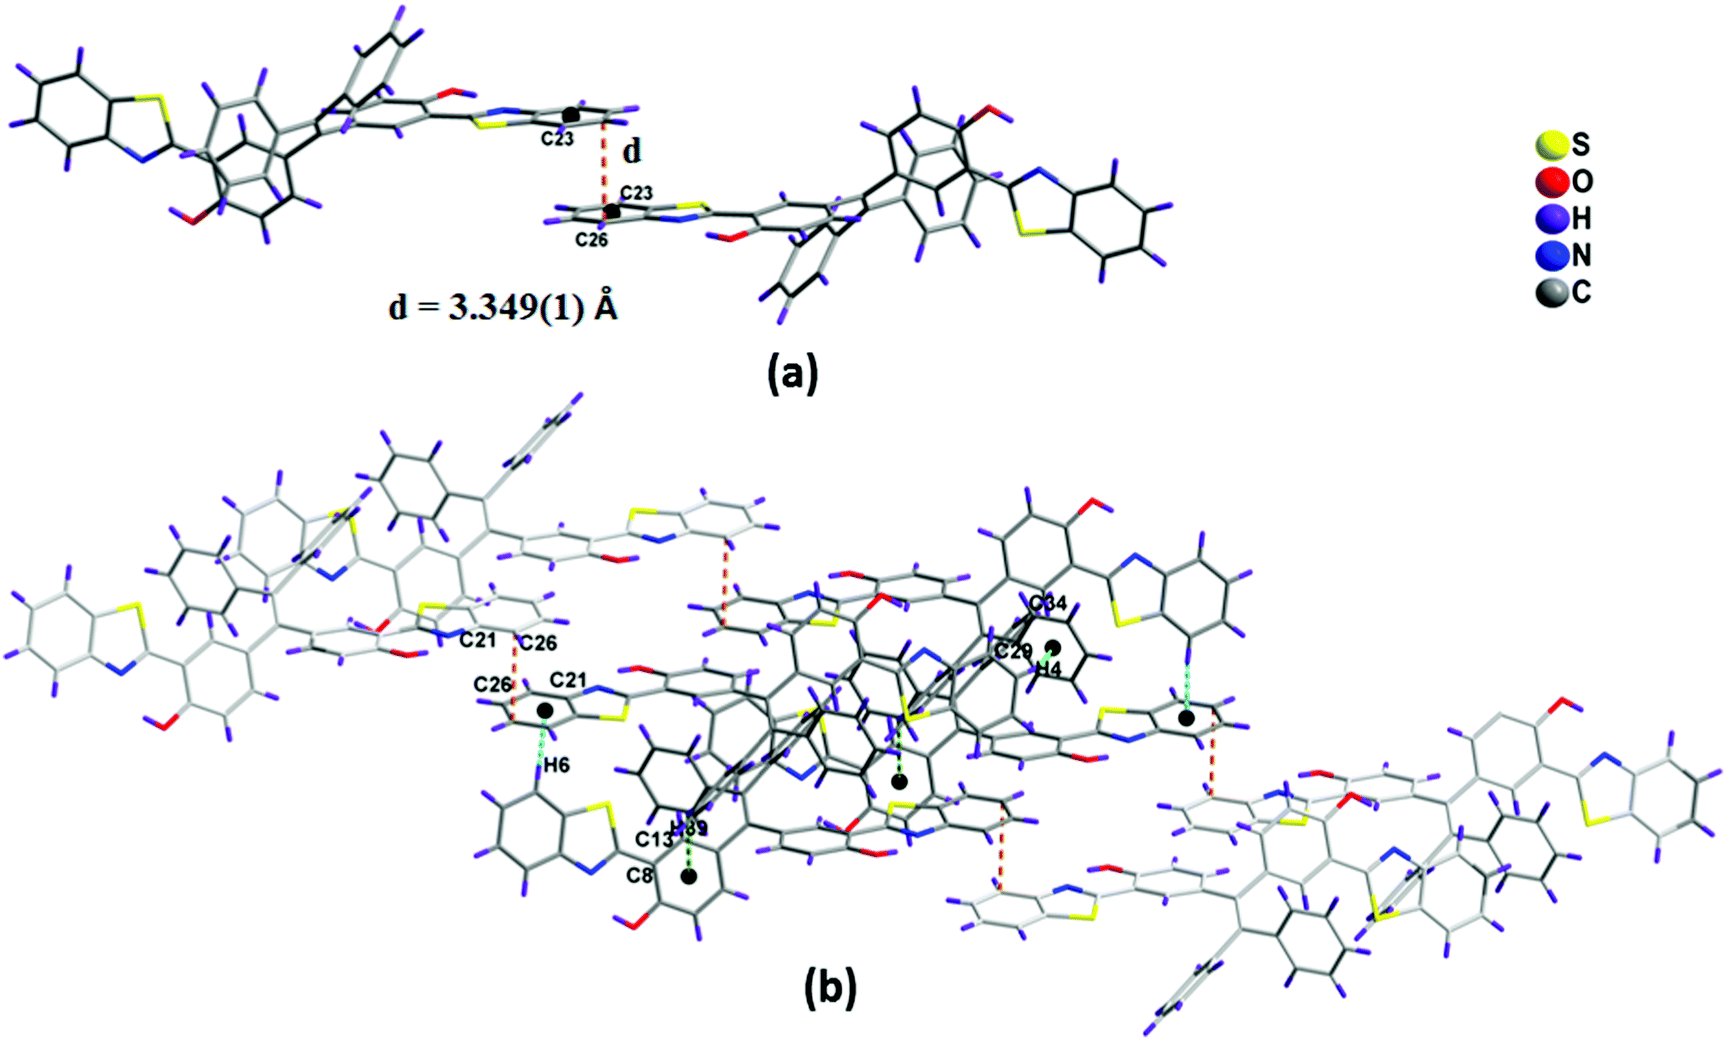 | ||
| Fig. 3 (a) Side-view of the two adjacent molecules of 1a, linked by π⋯π stacking. The schematics of the π⋯π weak interactions are drawn as dashed lines. (b) Crystal packing diagram of 1a. The dashed lines indicate the intermolecular hydrogen bonds. | ||
The packing diagram of compound 1b shown in Fig. 4b. In 1b, the two molecules in an asymmetric unit were interconnected to each other via edge to face interactions such as C(22B)–H(22B)⋯π(C2A–C7A) (3.047 Å), C(34B)–H(34B)⋯π(C16A–C21A) (2.626 Å) (Fig. 4a). The dimers are interconnected to one another via C(40B)–H(40B)⋯π(C9A–C14A) 3.235 Å to form a chain-like structure (Fig. S9, ESI†).
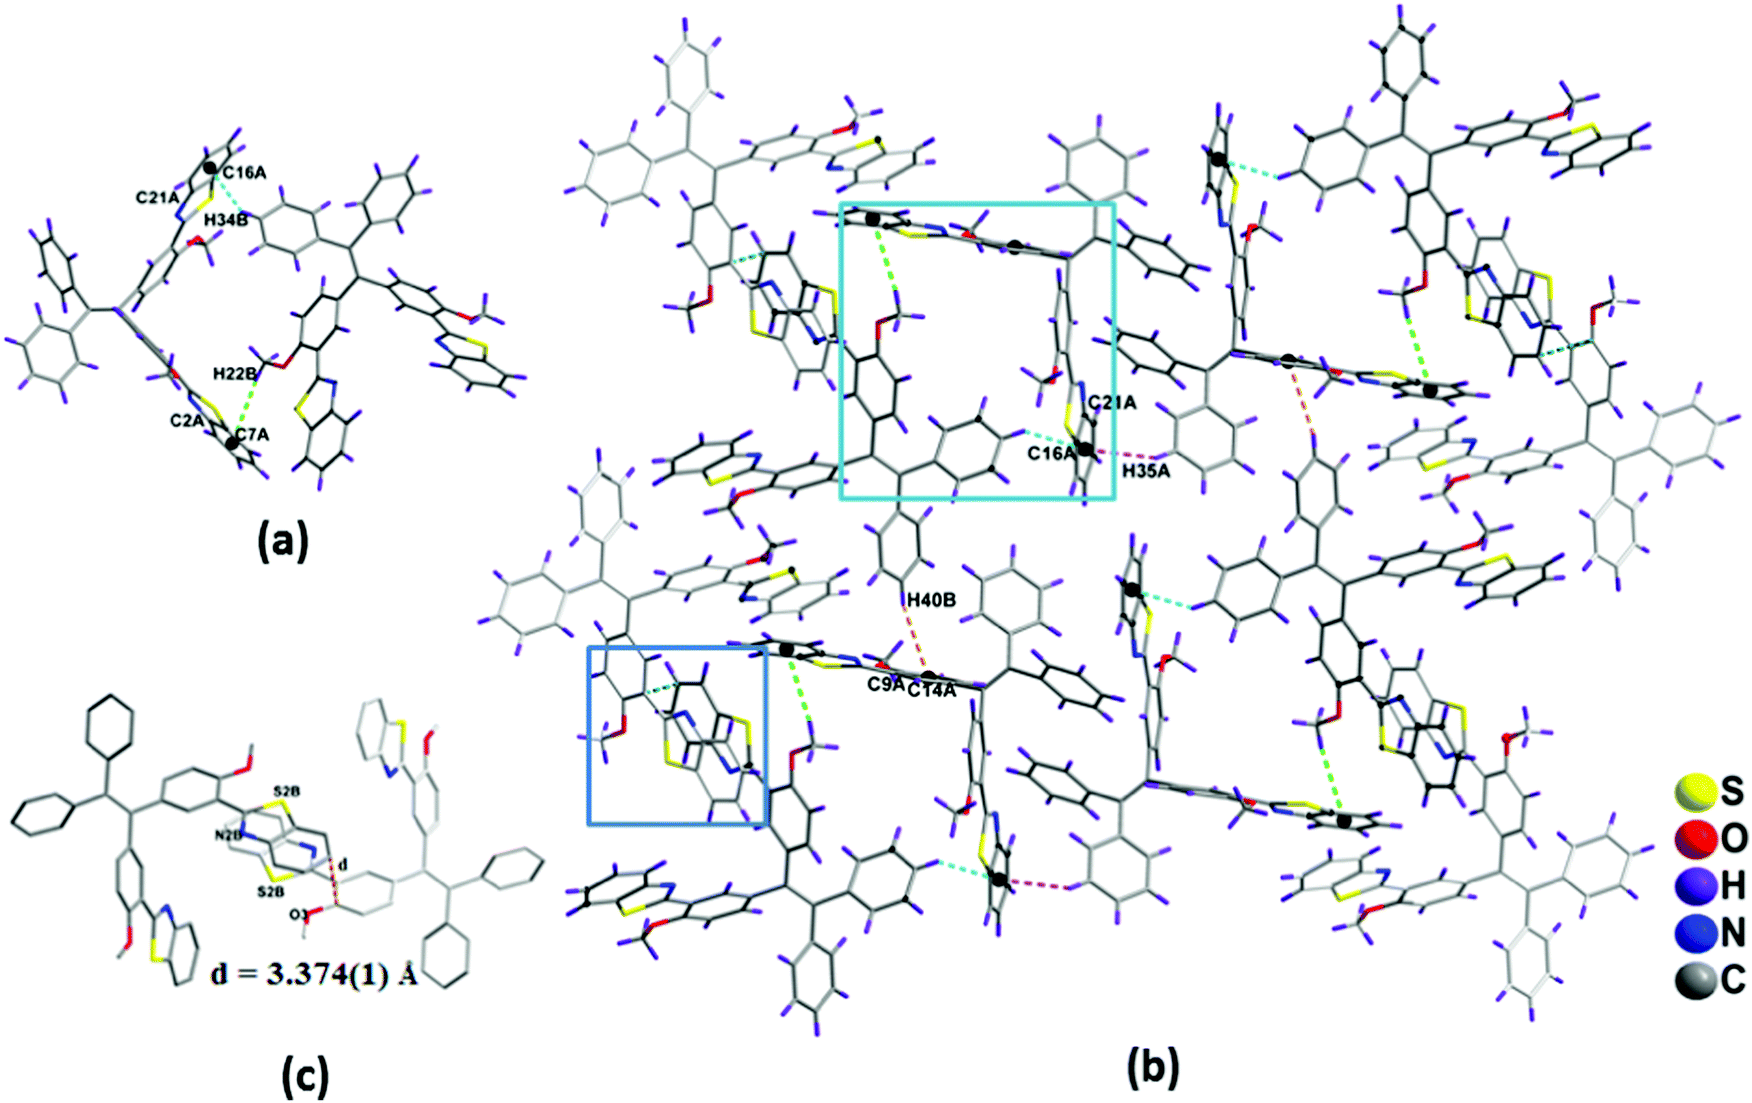 | ||
| Fig. 4 (a) The interaction between the dimer, (b) the crystal packing diagram of compound 1b and (c) the top view of the stacking arrangements. The hydrogen atoms are omitted for clarity; distances in Å between the benzothiazole moieties are indicated by dashed lines. | ||
The other packing features of 1b were similar to that of compound 1a, such as π–π edge to face stacking and arrangement of benzothiazole units in head to tail fashion, (Fig. 3a and 4c) which are responsible for the red-shifted emissions in their solid and aggregated states.16,17 The general features of the crystal packing structures of 1a and 1b, such as a molecular chain like structure as well as dimer formation, may be the driving force for these molecules to exhibit enhanced fluorescence behavior in the solid state compared to their weak fluorescence behavior in their molecularly dispersed solution state (Fig. 4).
Photophysical properties
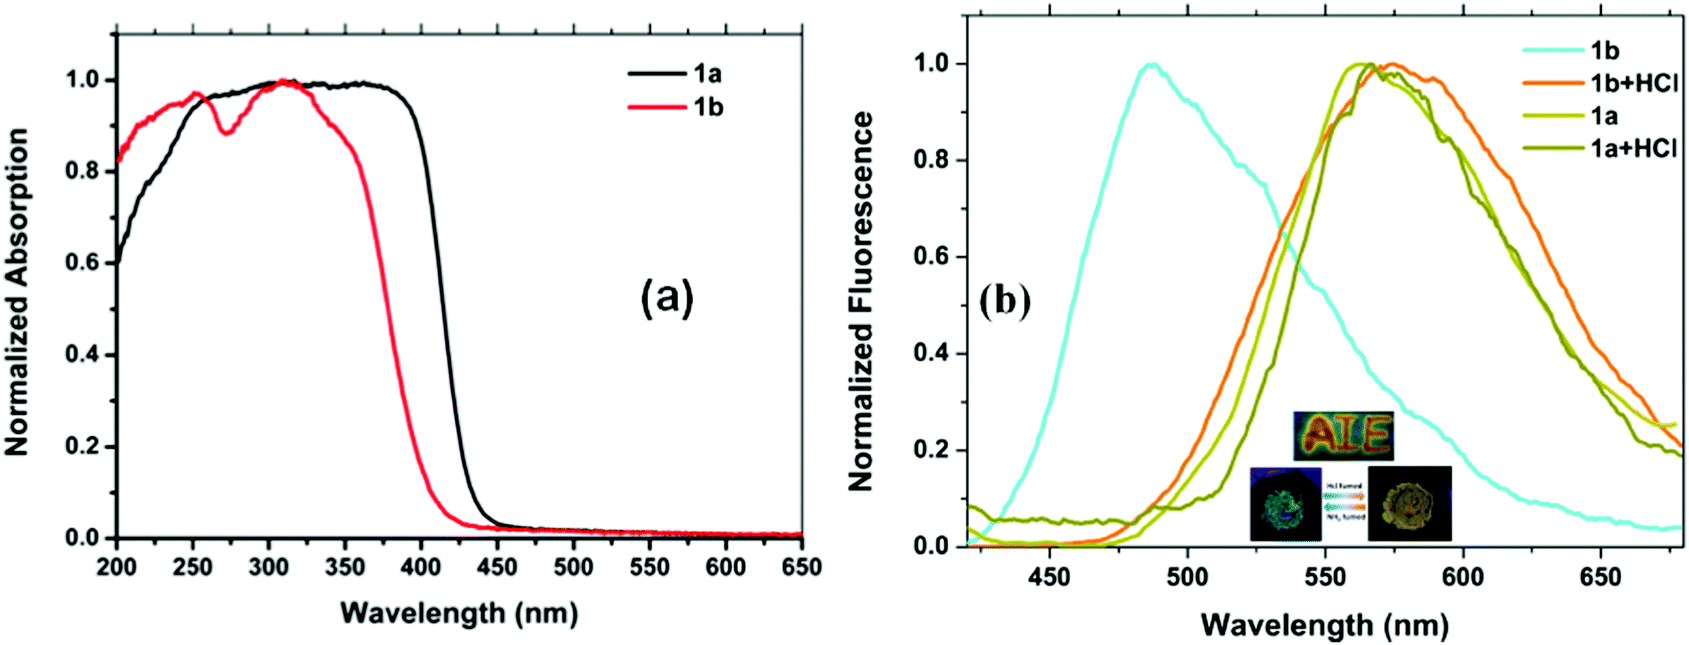
The electronic absorption spectra of compounds 1a and 1b are shown in Fig. 5a. The absorption spectra of 1a show a broad absorption band in the region of 250 and 425 nm with an absorption maxima at around 325 nm. The absorption spectra of 1b show a broad absorption band in the region of 255 and 390 nm with an absorption maxima at around 327 nm. Thus, the TPF-benzothiazole compounds 1a and 1b exhibit similar absorption behavior with a small red-shift in the absorption spectra of 1a (Fig. 5a).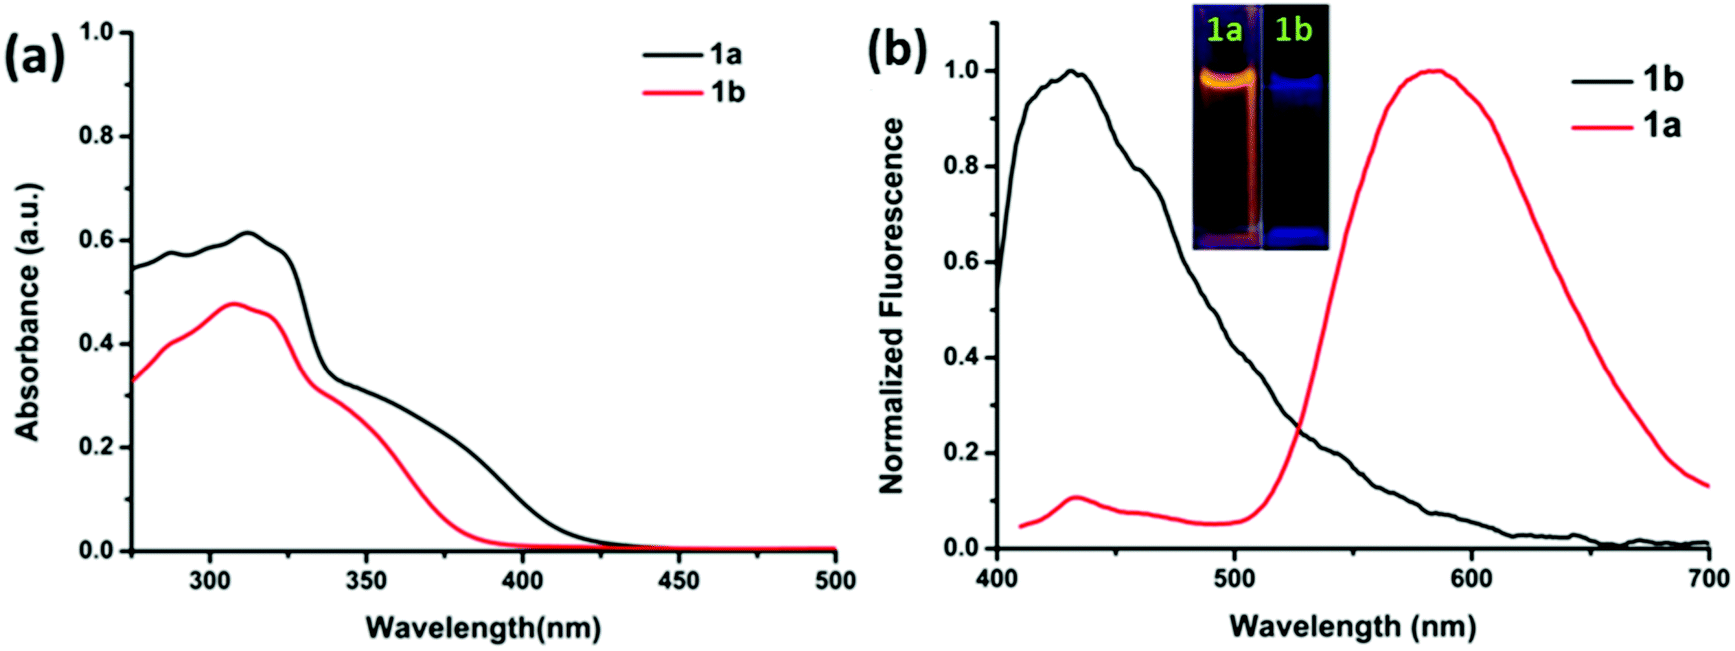 | ||
| Fig. 5 Comparison of (a) absorption spectra of compounds 1a and 1b and (b) fluorescence spectra of 1a and 1b recorded in tetrahydrofuran using the same concentration (2 × 10⁻⁵ M). Inset: photographs of 1a and 1b in THF. | ||
A comparison of fluorescence spectra of compounds 1a and 1b recorded in THF using an excitation wavelength of 350 nm is shown in Fig. 5b. Compound 1a exhibits two emission peaks: one less intense peak at 430 nm corresponding to the enol form and another low energy broad emission band at 555 nm due to the keto tautomer 1a′ (Chart 1) (Fig. 5b). The presence of this dual emission due to the keto–enol tautomerism in the ESIPT based benzothiazole moiety is well documented in the literature.16,17 Compound 1b exhibits only one emission peak at 435 nm in the THF solution. Compound 1b is less fluorescent with a quantum yield of 0.005, whereas 1a was relatively more fluorescent with a quantum yield of 0.023. The relatively strong fluorescence of 1a was attributed to intramolecular hydrogen bonding, which plays a crucial role in the ESIPT process.17 The fluorescence decay lifetimes for compounds 1a and 1b measured at λex = 350 nm were found to be 0.21 ns and 1.20 ns, respectively.
Aggregation-induced emission studies
Since the tetraphenylethylene moiety is a well known solid state emitter and shows aggregation induced emission, we studied the aggregation-induced fluorescence enhancement behavior of compounds 1a and 1b by increasing the water content in the THF solutions of compounds 1a and 1b. The photographs of 1a and 1b in THF–water mixtures with different water fractions under 365 nm UV illumination show the AIE behavior (Fig. 6). Upon addition of water to the THF solution of 1a, the clear solution of 1a transforms into aggregated particles with a significant enhancement in fluorescence.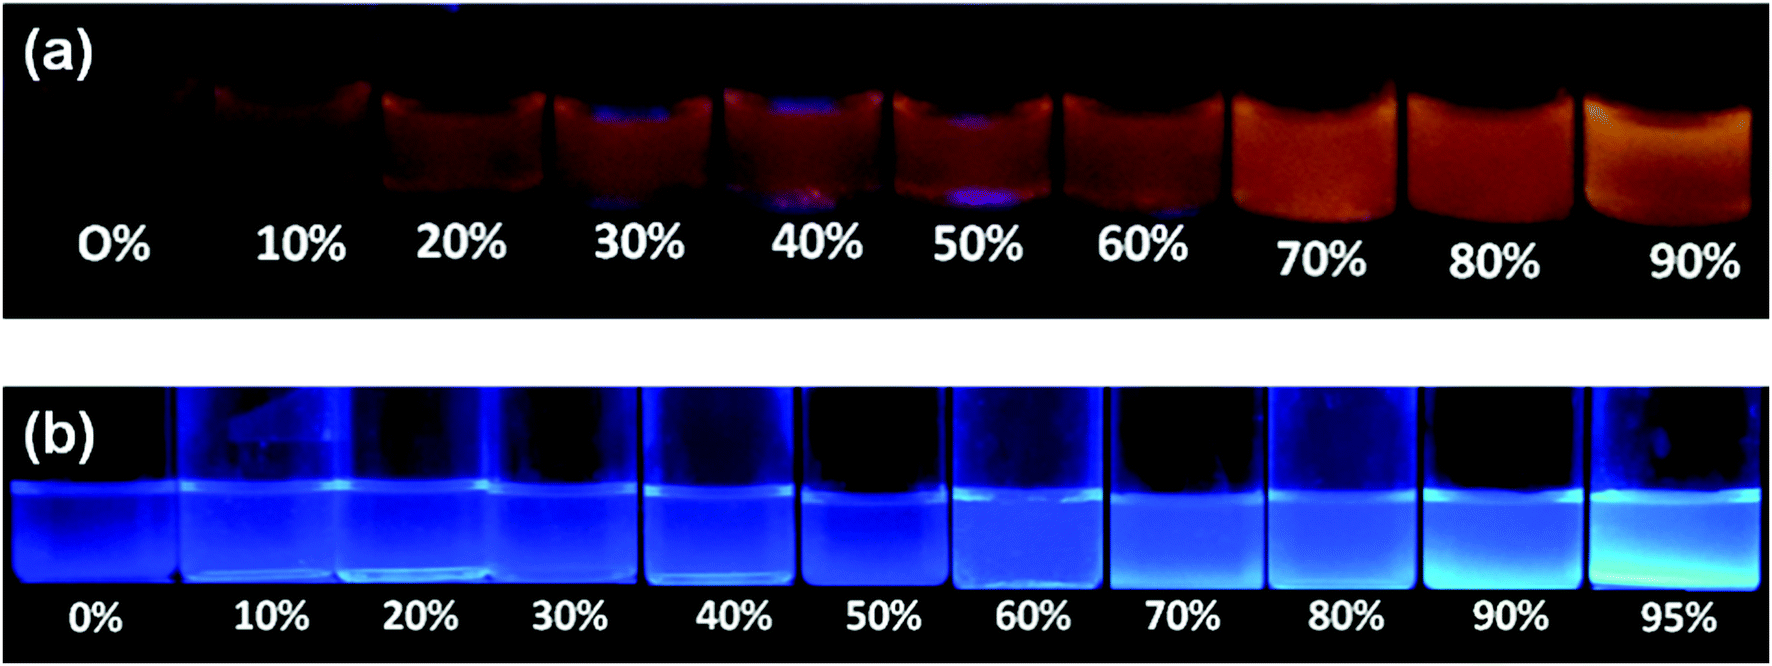 | ||
| Fig. 6 Images showing the change in emission of 1a (a) and 1b (b) in THF–water mixtures with different water fractions (fw) (20 μM) under 365 nm UV illumination. | ||
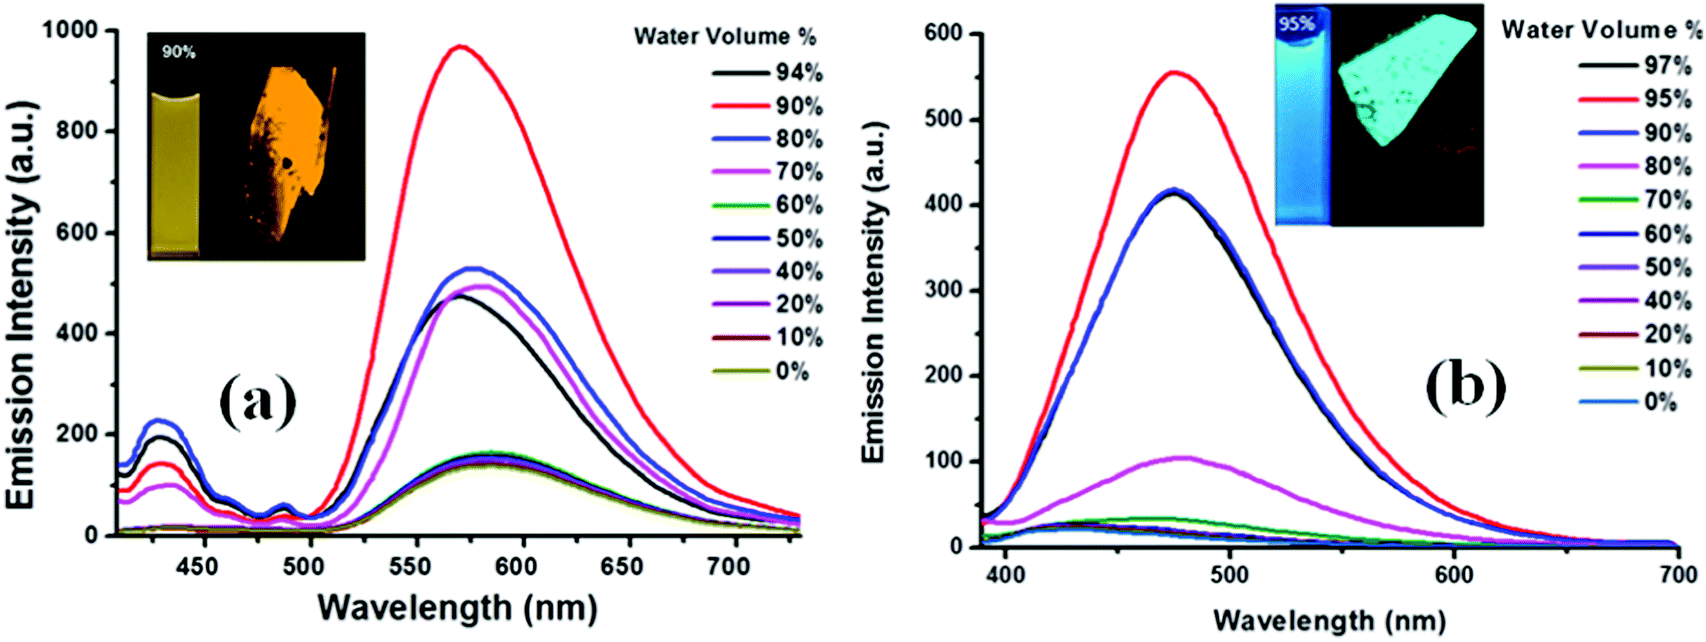
The fluorescence of TPE substituted benzothiazole 1a in the THF–water mixture remains the same until fw = 60% and then a sudden increase from 60–90% fw is seen due to aggregation (Fig. 7a). Compound 1a in THF shows an emission maxima at 565 nm, but upon increasing the water fraction (fw) to 90%, the fluorescence band experienced a hypsochromic shift and appears at 555 nm. The intramolecular interactions formed between the hydroxyl group and the nitrogen atom of the benzothiazole ring in 1a would probably be broken with the addition of water, leading to a blue shift in the fluorescence spectra (Fig. 7a). These observations were in agreement with the literature.18 Thus, the molecules started aggregating with enhanced fluorescence above 60%, and the maximum yellow color fluorescence intensity was observed at a 90% water fraction with a quantum yield of 0.45 and singlet state lifetime of 0.75 ns (Fig. 7a). Compound 1b was weakly emissive in the THF solution with a quantum yield of 0.005 but showed a strong blue emission from fw = 90–95% H2O/THF with a quantum yield of 0.21 and a singlet state lifetime of 0.77 ns due to aggregate formation. Compound 1b in the THF solution shows an emission intensity at 435 nm, but with the increasing water fraction, the fluorescence band experienced a bathochromic shift and appears at 485 nm at 95% fw (Fig. 7b). This may be due to the aggregate formation with a resultant red-shift in the fluorescence compared to that of the molecularly dispersed THF solution. The crystal packing of 1b shown in Fig. 4a also supports the formation of aggregates. The similar bathochromic shift in the emission spectra in response to aggregate formation was observed in the literature.18 However, a further increase in the water fraction caused reduced emission due to agglomeration.
 | ||
| Fig. 7 Fluorescence spectra of 10−5 M 1a (a) and 1b (b) in the THF/H2O mixture with different water fractions. Inset depicts the images of 10−5 M solutions of 1a and 1b in aggregated state and single crystals from confocal microscopy images of 1a (left) and 1b (right) crystals under UV light (365 nm). | ||
So, different volume percentages of the water fraction were required for 1a and 1b to exhibit AIE. Compound 1a requires more than 60% water fraction, whereas 1b requires more than 70% water fraction (Fig. 7a and b). The enhancement of photoluminescence of 1a and 1b was because the molecules were aggregated due to the restriction of intermolecular rotations, which in turn populated the radiative states of the excited molecules and resulted in a great increase in the fluorescence.18 Both 1a and 1b were fluorescent in the solid state, and fluorescent crystal images by confocal microscopy are shown in Fig. 7(a and b).
The maximum fluorescence efficiency of the nanoaggregates achieved for 1a at a 90% water content, which was found to be enhanced by (αAIE = ϕAgg/ϕSoln) 19 times higher than that of its molecularly dispersed THF solution. The maximum fluorescence efficiency for 1b was observed at a 95% water content, which was found to be enhanced by (αAIE = ϕAgg/ϕSoln) 39 times higher than that of its molecularly dispersed THF solution. Similar prominent increases or enhancements and bathochromic shifts in fluorescence were reported in case of aggregates of BODIPY derivatives.19
The solid state absorption spectrum of compound 1a shows broad absorption in the range of 200–450 nm, whereas, it is in the range of 200–420 nm for 1b (Fig. 8a). The pristine form of 1a shows two emissions at 382 and 567 nm. Even grinding and exposure to HCl vapor did not cause any change in the emission spectrum of 1a (Fig. S15, ESI†). The pristine form of 1b exhibits an emission band at 486 nm that remains unchanged even upon grinding. Interestingly, when compound 1b was exposed to hydrochloric acid vapor, there was a large bathochromic shift in the fluorescence peak, and a new peak appeared at 578 nm. There is an apparent color change of the solid from blue to orange yellow (Fig. 8b). This can be attributed to the electron-withdrawing capacity of benzothiazole, which was increased in the protonation process and further enhances the ICT process from tetraphenylethylene to the benzothiazole, resulting in the red shift of the fluorescence spectrum. However, on exposure to ammonia vapor, 1b attains the same emission characteristics as that of the unprotonated form.
 | ||
| Fig. 8 (a) Comparison of solid state absorption spectra of compounds 1a and 1b; (b) comparison of solid state fluorescence spectra of 1a and 1b (ground sample) in protonated and deprotonated states. The inset shows the fluorescence change under the UV lamp at 365 nm of paper strips coated with 1b in response to H+ ions (10−2 M); fluorescence images of the powder form of 1b: (A) ground sample, (B) in HCl vapor for 10 min. | ||
To check the acid sensitivity of compound 1b in the solid state, we prepared paper strips by dip-coating a solution of 1b (10−3 M) in dichloromethane on Whatman filter paper, followed by drying the strip under vacuum for 2 h. A word “AIE” was written on the strip using a dilute HCl solution (10−2 M). Interestingly, a yellow fluorescent image appeared in the regions exposed to HCl vapor (Fig. 8b). This pH response as a distinct color change in the solid state can be used in numerous applications.20
To obtain more insight into the size distribution of the aggregates of the benzothiazole-TPE derivatives 1a and 1b formed in THF/water mixtures, the size of the aggregates of 1a and 1b was determined by scanning electron microscopy (SEM), transmission electron microscopy (TEM) (Fig. 9) and differential light scattering (DLS) techniques. The SEM and TEM images of the aggregates of 1a in 90% fw show three-dimensional nanoballs 365 ± 40 nm in size (Fig. 9a). The SEM and TEM images of 95% fw of the nanostructures of 1b show a three-dimensional numerous, irregular, nanoballs 121 ± 35 nm in size (Fig. 9d), which is consistent with the data obtained from differential light scattering (Fig. S12, ESI†).
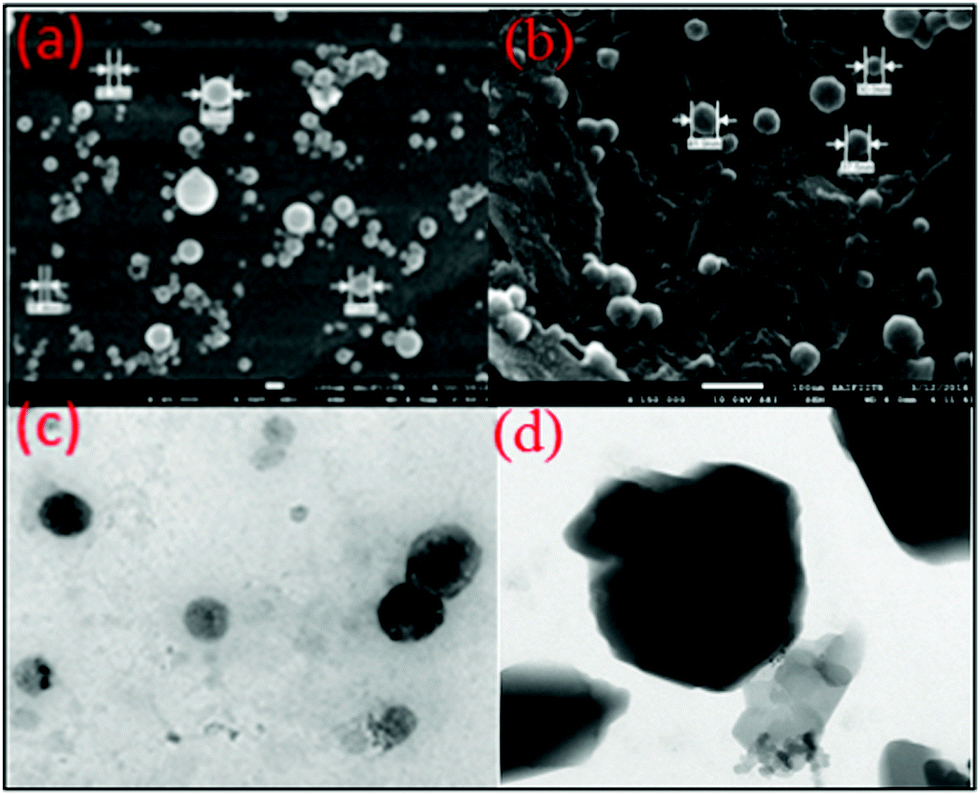 | ||
| Fig. 9 (a and b) FEG-SEM images of compounds 1a and 1b on carbon paste. (c and d) FEG-TEM images of 1a and 1b on porous copper grids. | ||
The average size of the nanoparticles as analyzed from DLS (differential light scattering) was found to be 365 nm for 1a and 121 nm for 1b. Thus, the SEM and differential light scattering data revealed that the particles are uniformly distributed in the aggregated state.
Biological studies
Luminescent probes with both ESIPT and AIE effects are potentially useful, especially in the stable bio-imaging contrast reagents.21 The cell viability study of compound 1a was performed over L929 cells using the MTT assay. The study revealed that more than 80% of cells were viable even at a concentration of 40 μg mL−1 of compound 1a (Fig. 10). The cytotoxicity assay with 1a (10 to 100 μg mL−1) in DMSO/PBS buffer (Fig. 10) supports that compound 1a is biocompatible in nature and could be used for cellular imaging. This result encouraged us to test the molecule for a bioimaging study in cancer cells.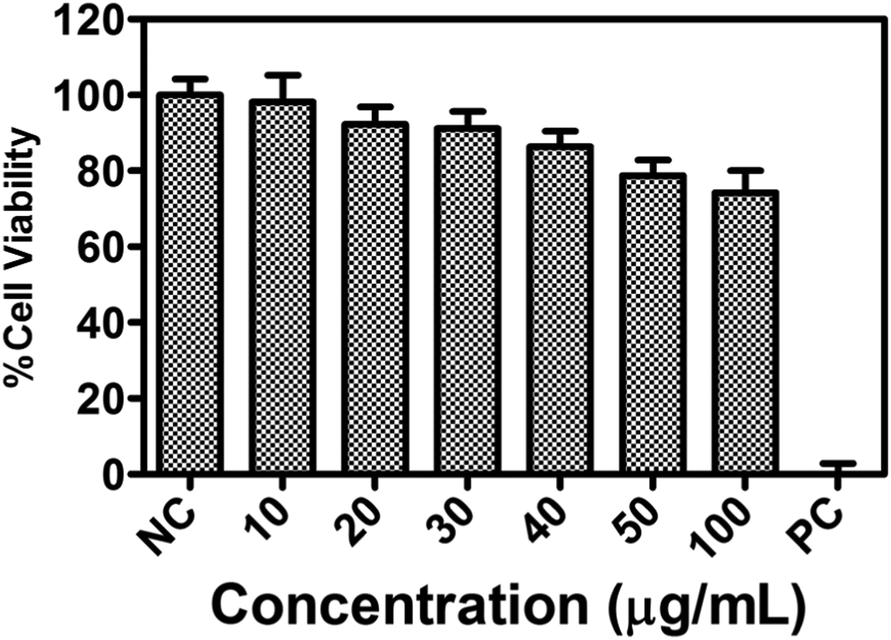 | ||
| Fig. 10 The biocompatibility of compound 1a on mouse fibroblast L929 cells. The cytotoxicity profile of compound 1a with a concentration up to 100 μg mL−1 for 24 h, and more than 80% of cells are viable up to 40 μg mL−1 of compound 1a (where n = 3; NC = negative control; PC = positive control). | ||
Since the compound 1a shows an enhanced emission due to aggregation phenomenon, and the particles are nanosize, as evident from SEM analysis, we monitored the process through flow cytometry analysis to get more insight into the cellular uptake of compound 1a.
The data from the flow cytometry analysis demonstrated the significant uptake of 1a nanoparticles (NPs) in L929 in a dose-dependent manner. Even at a minimal concentration, such as 250 μg mL−1, the compound 1a treatment exhibited a considerable increase in the fluorescence intensity of compound 1a inside L929 cells to attain 100% cellular uptake with a clear shift of the peak in the Indo-1 (Blue)-A region compared to the control cells (Fig. 11a). However, upon a further increase in the concentration of 1a, we noticed no change in the size, complexity or granularity in the cell matrix (Fig. 11b). This indicates that the size or complexity remains unchanged irrespective of the concentration of the fluorophore (Fig. 11e). After confirmation of the cellular uptake of compound 1a, a cellular localization study was performed on both L929 and HeLa cells using confocal laser imaging to see the extent of internalization and the effect on cell morphology. The cells were incubated with various concentrations of 50 μg mL−1 of compound 1a for 12 h.
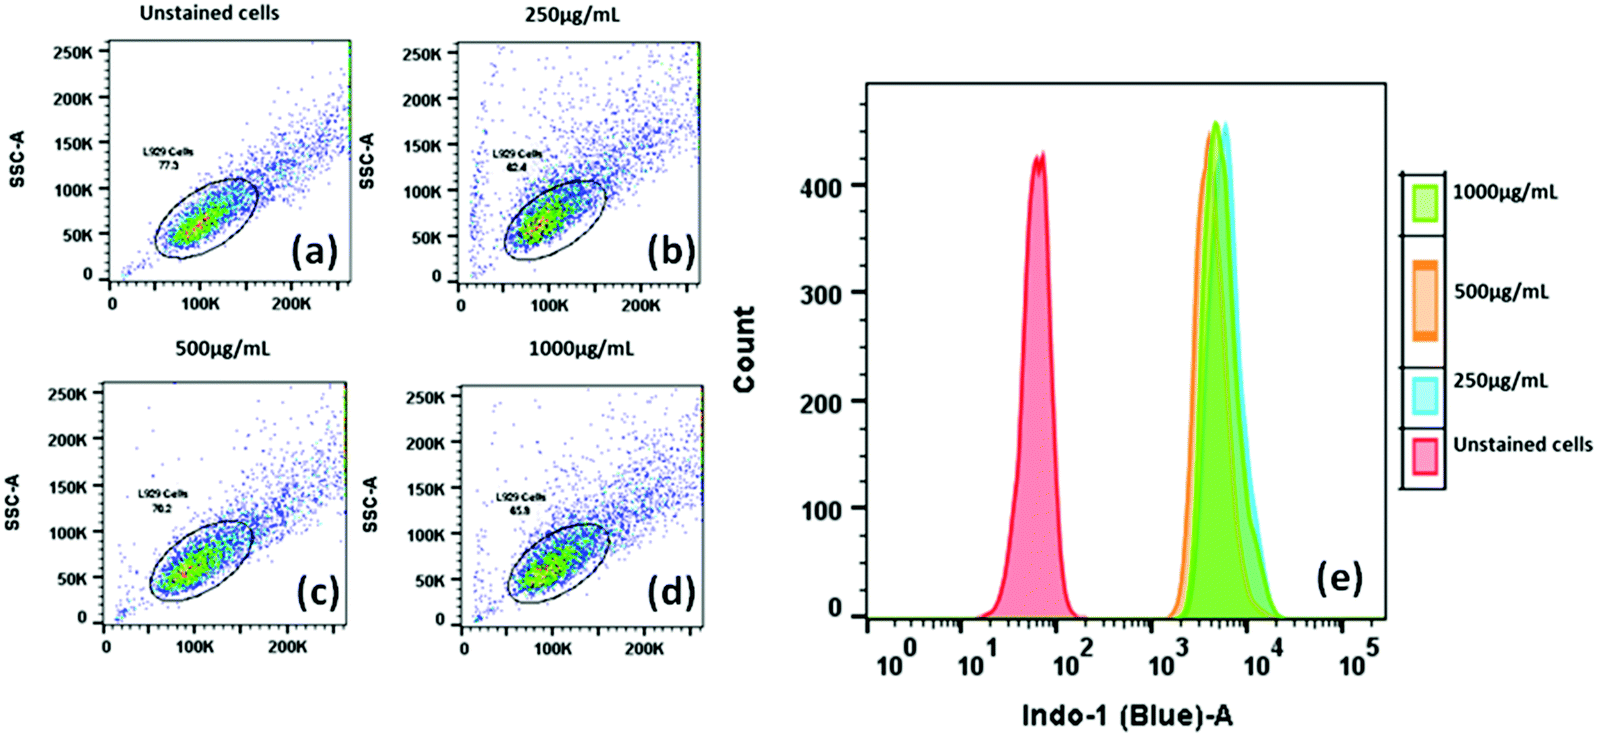 | ||
| Fig. 11 Cellular uptake and intracellular localization analysis of compound 1a (250, 500 and 1000 μg mL−1) in L929 cells using flow cytometry after 12 h. | ||
CLSM imaging showed that compound 1a is internalized successfully in both L929 and HeLa cells (cancer cell line) (Fig. 12), and compound 1a is labeling only the cytoplasm under the DAPI filter (blue fluorescence).
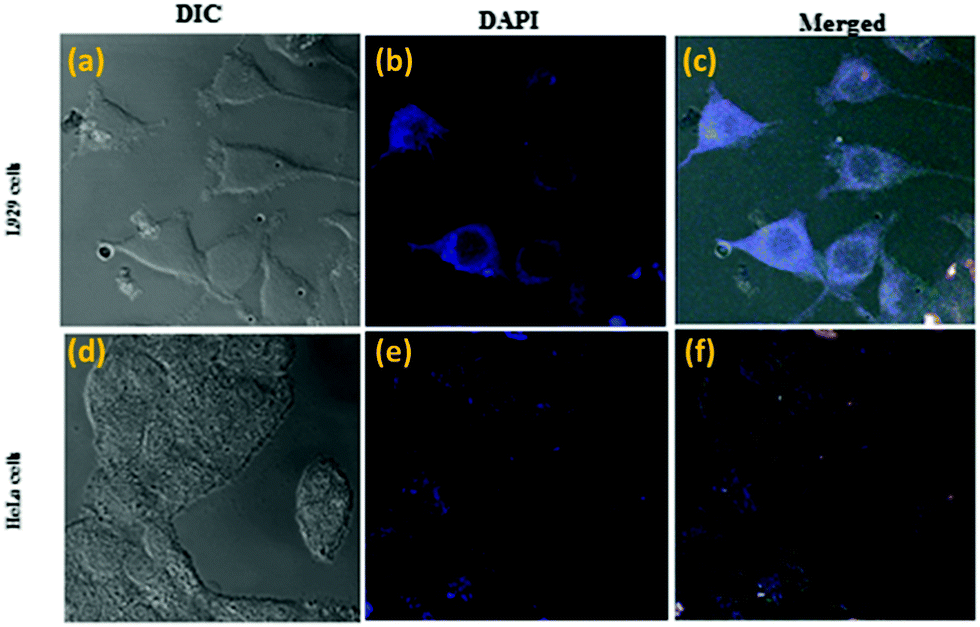 | ||
| Fig. 12 Confocal luminescence images of treated L929 (a–c) and HeLa cells (d–f) after incubation with 50 μg mL−1 of 1a for 12 h at 37 °C and excitation wavelength of 345 nm; emission filter: 449–520 nm. | ||
Compound 1a showed a peak in the Indigo (blue) region and exhibited excellent cellular uptake at various concentrations (Fig. 12c). Appearances of a blue fluorescence rather than the usual orange-red color observed in the aggregate state can be explained by the ESIPT molecule and membrane protein interactions. This result is consistent with the other ESIPT based contrasting agent.22
The overlay of the bright field and fluorescence images confirmed that 1a was located mainly in the cytoplasm of the cells but not in the nucleus. This is probably because the hydroxyl group of 1a can simply form a hydrogen bond with various polar functional groups present in the cytoplasm. This restricts the intramolecular rotation and the non-radiative decay, which in turn populated the irradiative state of the excited molecules, resulting in an increase of fluorescence in the live cell imaging. These results indicated that 1a displays selective labeling, excellent biocompatibility and non-toxicity over a wide range of concentrations and can be utilized in living cells as an excellent imaging agent.
Conclusions
In conclusion, we have designed and synthesized BTZ-TPE 1a–1b. Both benzothiazole BTZ-TPE compounds 1a and 1b were fluorescent in the solid state. Compound 1a, in which the benzothiazoles units are flanked by an OH group, exhibits a yellow color solid-state photoluminescence attributed to the excited state intramolecular proton transfer (ESIPT) phenomenon. To the best of our knowledge, this is the first report where the ESIPT active moiety is incorporated on the well-known solid state emitter tetraphenylethylene. Both TPE-BTZ molecules 1a and 1b are AIE-active, which are very weakly luminescent in molecularly dispersed THF solutions but highly luminescent in their aggregates forms. Furthermore, the crystal packing of 1a and 1b revealed that the π–π stacking interactions were probably responsible for the bathochromic shift and enhancement in the emission of compound 1b. The ability of 1a to be taken up by mouse fibroblasts and HeLa cells was examined. This difference in behavior may arise solely due to the incorporation of a single methyl group in molecule 1b. The sensitivity of 1a and 1b towards protonation has also been probed using solid state fluorescence spectroscopy. Prospectively, the TPE-BT based AIE molecules may find applications in cancer biomedical imaging, optoelectronic devices, and laser applications.General experimental
The chemicals such as titanium tetrachloride, zinc powder, 4,4′-dihydroxybenzophenone, 4,4′-dimethoxybenzophenone, and benzophenone were used as obtained from Aldrich. The other chemicals used for the synthesis were reagent grade unless otherwise specified. Column chromatography was performed on silica (60–120 mesh). The 1H, 11C NMR spectra were recorded in CDCl3 on Brucker 400 and 500 MHz instruments. The frequency for the 13C nucleus is 100.06. Tetramethylsilane [Si(CH3)4] was used as an internal standard for 1H and 13C NMR. Absorption and steady state fluorescence spectra were obtained with a Cary series UV-Vis-NIR spectrophotometer and Varian-Cary Eclipse spectrofluorometer, respectively. The fluorescence quantum yields (ϕ) of compound 1a were estimated from the emission and absorption spectra by a comparative method. The standard used for 1a was rhodamine 6G in ethanol with ϕ = 88%, while diphenyl anthracene23 in cyclohexane was used as a standard for fluorescence quantum yield calculations for 1b (ϕ = 97%). A picosecond pulsed diode laser-based time-correlated single photon counting (TCSPC) instrument from IBH (United Kingdom) was used to collect time-resolved decays at different wavelengths with the emission polarizer set at a magic angle of 54.71 with respect to the polarization of the incident light.Crystal structure determination
Suitable crystals were mounted on a Rigaku Saturn 724+ CCD diffractometer for unit cell determination and three-dimensional intensity data collection. Single-crystal diffraction studies were carried out on a Rigaku Saturn 724+ CCD diffractometer with a Mo Kα (λ = 0.71073 Å) sealed tube. All crystal structures were solved by direct methods. The program SAINT (version 6.22) was used for integration of the intensity of reflections and scaling. The program SADABS was used for absorption correction. The crystal structures were solved and refined using the SHELXTL (version 6.12) package.24 All hydrogen atoms were included in idealized positions, and a riding model was used. Non-hydrogen atoms were refined with anisotropic displacement parameters. The data collection, structure solution parameters, selected bond distances, and bond angles for compounds 1a and 1b are given in the ESI† (Table S1 and S2).General procedure for the synthesis of compounds 1a and 1b
Samples of 5,5′-(2,2-diphenylethylene-1,1-diyl)bis(2-hydroxybenzaldehyde) 2a or 5,5′-(2,2-diphenylethylene-1,1-diyl)bis(2-methoxybenzaldehyde) 2b (1.0 mmol) and 2-aminothiophenol (2.0 mmol) were dissolved in ethanol (10 mL), and the reaction was initiated by addition of aqueous 37% HCl (6.0 equivalent) and 30% H2O2 (12.0 equivalent). The reaction mixture was stirred at room temperature for 1 h. The TLC analysis indicated the disappearance of the starting materials and the appearance of a new spot corresponding to the desired benzothiazole substituted tetraphenyl ethene 1a/1b. The reaction mixture was quenched by adding water and extracted with ethyl acetate, and the combined organic extracts were dried over sodium sulphate. The solvent was evaporated and the residue was purified on silica gel using 10% ethyl acetate/hexane as the eluent to afford a white crystalline solid 1a/1b.Cell viability study
To test the biocompatibility of 1a for imaging in living cells, a cell cytotoxicity assay was conducted on L929 cells by following the standard protocols.25 The cell viability study was carried out over L929 cells, and 500 μL of a cell solution with a concentration of 5.0 × 10⁶ cells per mL was dispersed in 25.0 mL of DMEM media. A 200 μL aliquot from this stock was added to each well of the 96 well plates and kept at 37 °C with the 5% CO2 incubation condition for 24 hours. Compound 1a (1.0 mg) was dissolved in DMSO and diluted with PBS to make a 1.0 mg mL−1 stock solution. Then, a certain volume of the solution of compound 1a was added to the wells so that the final concentration of the compound in the well was 10, 20, 30, 40 and 50 and 100 μg mL−1. Cells under treatment were incubated again under the same incubation condition. After 24 hours, 25 μL of 3-(4,5-dimethylthiazol-2-yl)-2,5-diphenyltetrazolium bromide (MTT) solution with a concentration of 5 mg mL−1 was added in each well and kept under incubation for 3 hours. Later, DMSO was added to each well and dissolved the formazan crystals by mixing gently. Absorbance measurements were done on a microplate reader. The experiment was repeated in triplicate, and the results were presented as mean ± standard deviation (where n = 3). Cell viability was calculated by the formula given below: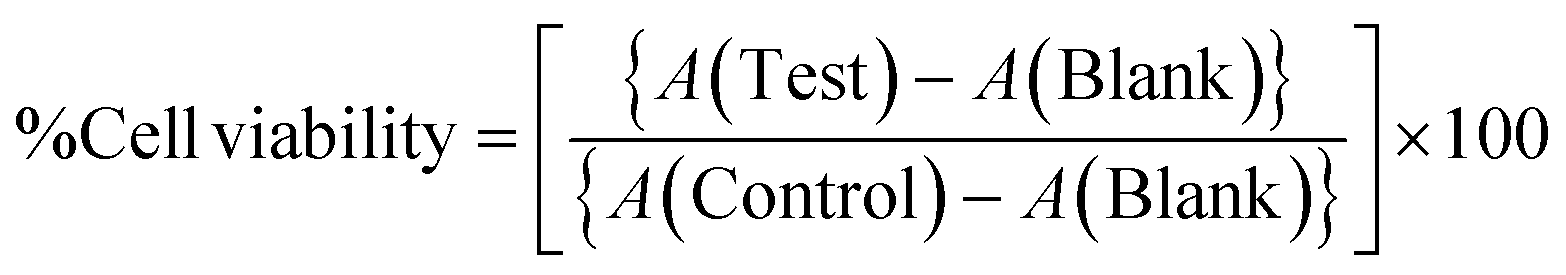
Cellular uptake and CLSM imaging
A cellular uptake study was performed using a flow cytometry instrument. Briefly, 100 μL of L929 cell solution with a concentration of 2 × 10⁶ cells per mL were seeded in each T25 flask and incubated for 24 h under 5% CO2 at 37 °C with humidified conditions. Cells were treated with compound 1a at various concentrations (1000, 500 and 250 μg mL−1). Following cell incubation again for 24 h at 5% CO2 at 37 °C, the cells were trypsinized and fixed with chilled ethanol (70%) and incubated for 5 min at room temperature. The cellular uptake of 1a was performed by flow cytometry instrument BD FACSAria III flow cytometer (BD, USA) in the Indo-1(Blue)-A region where at least 10![[thin space (1/6-em)]](https://www.rsc.org/images/entities/char_2009.gif) 000 events were analyzed. For the confocal laser scanning microscopy, L929 and HeLa cells were seeded in 12 well plates wherein each well was equipped with a sterile rounded glass cover slip. After 24 hours, cells were treated with compound 1a and incubated for 12 h. Following incubation, the cells were treated and fixed using paraformaldehyde and sodium borohydride. For bio-imaging, the treated cells were excited at 345 nm. The confocal imaging experiments were carried out with a Carl Zeiss laser scanning confocal microscope (Carl Zeiss, Germany).
000 events were analyzed. For the confocal laser scanning microscopy, L929 and HeLa cells were seeded in 12 well plates wherein each well was equipped with a sterile rounded glass cover slip. After 24 hours, cells were treated with compound 1a and incubated for 12 h. Following incubation, the cells were treated and fixed using paraformaldehyde and sodium borohydride. For bio-imaging, the treated cells were excited at 345 nm. The confocal imaging experiments were carried out with a Carl Zeiss laser scanning confocal microscope (Carl Zeiss, Germany).
Acknowledgements
KK and MR acknowledge Department of Science and Technology Government of India for funding (No. SB/FT/CS-191/2013) and Indian Institute of Technology Bombay, Mumbai for providing infrastructure facilities.References
- (a) A. P. Demchenko, K.-C. Tang and P.-T. Chou, Chem. Soc. Rev., 2013, 42, 1379–1408 RSC; (b) C.-C. Hsieh, C.-M. Jiang and P.-T. Chou, Acc. Chem. Res., 2010, 43, 1364–1374 CrossRef CAS PubMed; (c) S. Park, O.-H. Kwon, S. Kim, S. Park, M.-G. Choi, M. Cha, S.-Y. Park and D.-J. Jang, J. Am. Chem. Soc., 2005, 127, 10070–10074 CrossRef CAS PubMed.
- J. Wu, W. Liu, J. Ge, H. Zhang and P. Wang, Chem. Soc. Rev., 2011, 40, 3483–3495 RSC.
- K. C. Tang, M. J. Chang, T. Y. Lin, H. A. Pan, T. C. Fang, K. Y. Chen, W. Y. Hung, Y. H. Hsu and P. T. Chou, J. Am. Chem. Soc., 2011, 133, 17738–17745 CrossRef CAS PubMed.
- J. Keck, H. E. A. Kramer, H. Port, T. Hirsch, P. Fischer and G. Rytz, J. Phys. Chem., 1996, 100, 14468–14475 CrossRef CAS.
- J. Pospisil and S. Nespurek, Prog. Polym. Sci., 2000, 25, 1261–1335 CrossRef CAS.
- (a) Y. Zhang, J. Wang, W. Zheng, T. Chen, Q. Tong and D. Li, J. Mater. Chem. B, 2014, 2, 4159 RSC; (b) J. E. Kwon and S. Y. Park, Adv. Mater., 2011, 23, 3615–3642 CrossRef CAS PubMed; (c) H. Lin, X. Chang, D. Yan, W.-H. Fang and G. Cui, Chem. Sci., 2017 10.1039/c6sc04354b.
- (a) S. Park, J. E. Kwon, S. H. Kim, J. Seo, K. Chung, S. Y. Park, D. J. Jang, B. M. Medina, J. Gierschner and S. Y. Park, J. Am. Chem. Soc., 2009, 131, 14043–14049 CrossRef CAS PubMed; (b) N. B. Shustova, T.-C. Ong, A. F. Cozzolino, V. K. Michaelis, R. G. Griffin and M. Dinca, J. Am. Chem. Soc., 2012, 134, 15061–15070 CrossRef CAS PubMed; (c) N. B. Shustova, B. D. McCarthy and M. Dinca, J. Am. Chem. Soc., 2011, 133, 20126 CrossRef CAS PubMed.
- (a) O. S. Wolfbeis, A. Knierzinger and R. J. Schipfer, J. Photochem., 1983, 21, 67 CrossRef CAS; (b) T. Murata, Y. Morita, Y. Yakiyama, K. Fukui, H. Yamochi, G. Saito and K. Nakasuji, J. Am. Chem. Soc., 2007, 129, 10837 CrossRef CAS PubMed; (c) M. B. Cardoso, D. Samios, N. P. Silveira, F. S. Rodembusch and V. Stefani, Photochem. Photobiol. Sci., 2007, 6, 99–102 RSC; (d) S. Jayanty and T. P. Radhakrishnan, Chem. – Eur. J., 2004, 10, 791 CrossRef CAS PubMed.
- (a) K. Y. Chen, C. C. Hsieh, Y. M. Cheng, C. H. Lai and P. T. Chou, Chem. Commun., 2006, 4395–4397 RSC; (b) S. P. Anthony and Sylvia M. Draper, J. Phys. Chem. C, 2010, 114, 11708–11716 CrossRef CAS.
- S. Park, J.-E. Kwonb and S. Y. Park, Phys. Chem. Chem. Phys., 2012, 14, 8878–8884 RSC.
- (a) C. Azarias, S. Budzak, A. D. Laurent, G. Ulrich and D. Jacquemin, Chem. Sci., 2016, 7, 3763–3774 RSC; (b) S. Varughese, J. Mater. Chem. C, 2014, 2, 3499–3516 RSC.
- (a) T. Jadhav, B. Dhokale, S. M. Mobin and R. Misra, RSC Adv., 2015, 5, 29878 RSC; (b) C. P. Ma, B. J. Xu, G. Y. Xie, J. J. He, X. Zhou, B. Y. Peng, L. Jiang, B. Xu, W. J. Tian, Z. G. Chi, S. W. Liu, Y. Zhang and J. R. Xu, Chem. Commun., 2014, 50, 7374 RSC; (c) N. Zhao, J. W. Y. Lam, H. H. Y. Sung, N. Xie, S. Chen, H. Su, M. Gao, I. D. Williams, K. S. Wong and B. Z. Tang, Chem. Commun., 2012, 48, 8637 RSC.
- J. Mei, N. L. C. Leung, R. T. K. Kwok, J. W. Y. Lam and B. Z. Tang, Chem. Rev., 2015, 115, 11718–11940 CrossRef CAS PubMed.
- H.-T. Feng, J.-B. Xiong, Y.-S. Zheng, B. Pan, C. Zhang, L. Wang and Y. Xie, Chem. Mater., 2015, 27, 7812–7819 CrossRef CAS.
- H.-T. Feng, X. Zhang and Y.-S. Zheng, J. Org. Chem., 2015, 80, 8096–8101 CrossRef CAS PubMed.
- (a) T.-Y. Lin, K.-C. Tang, S.-H. Yang, J.-Y. Shen, Y.-M. Cheng, H.-A. Pan, Y. Chi and P.-T. Chou, J. Phys. Chem. A, 2012, 116, 4438–4444 CrossRef CAS PubMed; (b) G. Cui, Z. Lan and W. Thiel, J. Am. Chem. Soc., 2012, 134, 1662–1672 CrossRef CAS PubMed.
- K.-I. Sakai, H. Kawamura, N. Kobayashi, T. Ishikawa, C. Ikeda, T. Kikuchib and T. Akutagawab, CrystEngComm, 2014, 16, 3180–3185 RSC.
- (a) N. Zhao, J. W. Y. Lam, H. H. Y. Sung, N. Xie, S. Chen, H. Su, M. Gao, I. D. Williams, K. S. Wong and B. Z. Tang, Chem. Commun., 2012, 48, 8637 RSC; (b) M. Yang, Y. Zhang, W. Zhu, H. Wang, J. Huang, L. Cheng, H. Zhou, J. Wu and Y. Tian, J. Mater. Chem. C, 2015, 3, 1994–2002 RSC.
- (a) S. Choi, J. Bouffard and Y. Kim, Chem. Sci., 2014, 5, 751–755 RSC; (b) S. Mukherjee and P. Thilagar, Chem. – Eur. J., 2014, 20, 9052–9062 CAS.
- N. Lin, X. Chen, S. Yan, H. Wang, Z. Lu, X. Xia, M. Liang, Y.-L. Wu, L. Zheng, Q. Cao and Z. Dinga, RSC Adv., 2016, 6, 25416–25419 RSC.
- (a) R. T. K. Kwok, C. W. T. Leung, J. W. Y. Lamab and B. Z. Tang, Chem. Soc. Rev., 2015, 44, 4228–4238 RSC; (b) G. Feng, W. Wu, S. Xu and B. Liu, ACS Appl. Mater. Interfaces, 2016, 8, 21193–21200 CrossRef CAS PubMed; (c) Z.-F. Chang, L.-M. Jing, B. Chen, M. Zhang, X. Cai, J.-J. Liu, Y.-C. Ye, X. Lou, Z. Zhao, B. Liu, J.-L. Wang and B. Z. Tang, Chem. Sci., 2016, 7, 4527–4536 RSC.
- (a) C. Yang, X. Dong, X. Sun, D. Zhang and C. Liu, Org. Biomol. Chem., 2014, 12, 5250–5259 RSC; (b) S. Goswami, A. Manna, M. Mondala and D. Sarkarb, RSC Adv., 2014, 4, 62639–62643 RSC.
- Y. Fujiwara, R. Ozawa, D. Onuma, K. Suzuki, K. Yoza and K. Kobayashi, J. Org. Chem., 2013, 78, 2206–2212 CrossRef CAS PubMed.
- (a) SMART, Bruker Molecular Analysis Research Tools, version 5.618, Bruker Analytical X-ray Systems, Madison, WI, 2000; (b) G. M. Sheldrick, SAINT-NT, version 6.04, Bruker Analytical X-ray Systems, Madison, WI, 2001; (c) G. M. Sheldrick, SHELXTL-NT, version 6.10, Bruker Analytical X-ray Systems, Madison, WI, 2000; (d) B. Klaus, DIAMOND, version 2.1 c, University of Bonn, Bonn, Germany, 1999.
- H. Mueller, M. U. Kassack and M. Wiese, J. Biomol. Screening, 2004, 9, 506–515 CrossRef CAS PubMed.
Footnote |
| † Electronic supplementary information (ESI) available: CCDC 1458979 and 1459001. For ESI and crystallographic data in CIF or other electronic format see DOI: 10.1039/c6qm00374e |
| This journal is © the Partner Organisations 2017 |