
Downsizing metal–organic frameworks with distinct morphologies as cathode materials for high-capacity Li–O2 batteries
Wenjuan
Yan
a,
Ziyang
Guo
b,
Huoshu
Xu
b,
Yongbing
Lou
 a,
Jinxi
Chen
*a and
Qiaowei
Li
*b
a,
Jinxi
Chen
*a and
Qiaowei
Li
*b
aSchool of Chemistry and Chemical Engineering, Jiangsu Engineering Laboratory of Smart Carbon-Rich Materials, Jiangsu Key Laboratory of Advanced Metallic Materials, Southeast University, Nanjing 211189, P. R. China. E-mail: chenjinxi@seu.edu.cn
bDepartment of Chemistry and iChEM (Collaborative Innovation Center of Chemistry for Energy Materials), Fudan University, 220 Handan Road, Shanghai 200433, P. R. China. E-mail: qwli@fudan.edu.cn
First published on 6th February 2017
Abstract
Rechargeable nonaqueous Li–O2 batteries have been considered as one of the most promising candidate energy storage devices. In this work, metal–organic framework nanomaterials with distinct sizes and morphologies were successfully synthesized via a facile solvothermal method. By using modulators in a mixed solvent system, the dimension of Co-MOF-74 could be reduced down to several unit cell lengths. Furthermore, high specific capacities (11![[thin space (1/6-em)]](https://www.rsc.org/images/entities/char_2009.gif) 350 mA h g−1 at 100 mA g−1) were achieved when they were directly employed as cathode materials for Li–O2 batteries. In addition to the high density of unsaturated active sites for electrochemistry, as provided by the MOF skeleton itself, the size confinement and inherent defects of the nanocrystals have further offered efficient diffusion paths with lowered transport barriers, contributing to their high performance in Li–O2 batteries.
350 mA h g−1 at 100 mA g−1) were achieved when they were directly employed as cathode materials for Li–O2 batteries. In addition to the high density of unsaturated active sites for electrochemistry, as provided by the MOF skeleton itself, the size confinement and inherent defects of the nanocrystals have further offered efficient diffusion paths with lowered transport barriers, contributing to their high performance in Li–O2 batteries.
1. Introduction
Rechargeable nonaqueous Li–O2 batteries have attracted considerable attention in recent years due to their superior theoretical gravimetric energy density (2Li+ + O2 + 2e− ⇌ Li2O2, 2.96 V vs. Li/Li+), and they are viewed as one of the most promising energy storage devices for electrical vehicles.1–5 A rechargeable nonaqueous Li–O2 battery typically consists of a Li metal anode, a Li+ conducting organic electrolyte, and a porous oxygen diffusion cathode. However, before their practical applications, many challenges, such as poor cyclability, low power capability, and unsatisfactory rate performance need to be overcome.6–8 During cell discharging and charging, the solid products Li2O2 and the byproducts are continuously deposited on the surface and in the pores of the cathode, which will block the path for Li+ and O2 diffusion, impede the reaction from proceeding efficiently, and lead to sluggish kinetics at the cathode of Li–O2 batteries.9–11 Thus, the design and synthesis of highly effective oxygen cathode materials is highly desired. To date, a variety of electrode materials, including carbon materials with different morphologies,12,13 noble metals,14,15 and metal nitrides and oxides,16,17 have been used as cathode materials in Li–O2 batteries.Recently, materials based on metal–organic frameworks (MOFs)18–22 have been considered as promising electrocatalysts for electrochemical energy storage and conversion.23–28 Compared to porous carbon materials, metals, and metal nitride and oxide solids, MOFs have uniform pores with high surface areas and metal ion centers in the backbone, which not only provide electrically active sites on the surfaces but also facilitate the efficient diffusion of gas and ions. The application of pristine MOFs in Li–O2 batteries was firstly reported in 2014, and the study indicated that composites of MOFs with carbon as the cathode material produce higher discharge capacities compared to carbon alone.29 In addition, a cell with a cathode catalyst based on a Ni-MOF showed a high capacity of 9000 mA h g−1.30 However, studies on different morphologies and structures of MOFs for further performance improvement of Li–O2 batteries are far from complete. The unique structural features of MOFs and recent developments in the rational synthesis of MOFs allow us to precisely control the particle sizes and morphologies of the crystals,31–34 and to intentionally introduce defective but active sites by using modulators and various solvents during the synthesis.
Targeting better accessibility of active sites with shorter transportation pathways for Li–O2 battery applications without losing the internal high surface areas, in this work, we report a facile one-step synthesis method to prepare Co-MOF-7435 with three different sizes and morphologies by using modulators and adjusting the solvent compositions. These Co-MOF-74 nanorods and nanofibers, named Co-MOF-74-X (X = 1400, 800, or 20, where X indicates the average width of the nanorods and nanofibers prepared), were directly used as cathode materials for Li–O2 batteries. Higher discharge capacities and better rate performances were achieved by downsizing the crystals with specific morphologies. Specifically, Co-MOF-74-20 delivers a high discharge capacity of 11350 mA h g−1 at a current density of 100 mA g−1, which is about five times that of Super P alone. Moreover, a high capacity of 6440 mA h g−1 could still be obtained with the current density increased to 500 mA g−1. The MOF crystals uniformly distributed in the electrode equip the material with more unsaturated metal sites on the surface as potential active sties. Furthermore, with the nanofiber width of 20 nm in this MOF, corresponding to less than eight unit cell lengths, Co-MOF-74-20 provides better accessibility of the active sites for incoming guests with a shorter diffusion distance, which is favorable for improving the specific capacity and rate capability of Li–O2 batteries.
2. Experimental section
All reagents and chemicals were commercially obtained and used as received without any further purification unless otherwise stated.2.1 Synthesis of Co-MOF-74
In a typical synthesis, 0.200 g (1.00 mmol) of 2,5-dihydroxyterephthalic acid (H4DOBDC) was dissolved in a 15.0 mL solvent mixture of N,N-dimethylformamide (DMF) and deionized water (1:4, by volume). After sonication for 0.5 h, 0.140 g (1.00 mmol) of salicylic acid was then added to the H4DOBDC solution. The above solution was added dropwise to a solution of 0.647 g (2.60 mmol) Co(OAc)2·4H2O in 15.0 mL DMF/H2O (v:v = 1:4) under magnetic stirring, and it was transferred to a 50 mL Teflon-lined autoclave and heated at 130 °C for 24 h. The product was collected through centrifugation and washed three times with DMF and methanol, followed by solvent exchange with ethanol six times over three days before being dried under vacuum at 70 °C overnight. Similarly, to further control the morphologies of the MOFs, different solvent mixtures (DMF/H2O volume ratios: 1:1 and 4:1) were also investigated.
2.2 Material characterization
Powder X-ray diffraction (PXRD) patterns were recorded using an Ultima IV (Rigaku Corporation) with Cu Kα radiation (λ = 1.54059 Å) at 40 kV and 35 mA at room temperature. Diffraction data were collected in the range of 2θ = 5–65° at a scan rate of 20° min−1. The morphologies of the structures were examined with a Hitachi S-4800 scanning electron microscope (SEM) with acceleration voltages of 5 and 10 kV and a transmission electron microscope (TEM, JEM-2100) at an acceleration voltage of 200 kV. O2 adsorption isotherms were measured at 273 K on Micromeritics ASAP 2020 volumetric adsorption apparatus after degassing the samples at 250 °C for 12 h.2.3 Electrode preparation and battery assembly
Co-MOF-74 with different sizes and morphologies (16.0 mg), Super P (16.0 mg), and polyvinylidene fluoride (8.0 mg, PVDF) were mixed with N-methyl-2-pyrrolidone (NMP) to form a homogeneous slurry, which was subsequently coated on carbon paper in an argon-filled glove box. After vacuum-drying at 80 °C for 12 h, the coating with the final active materials (MOF and Super P) at a mass loading of ∼0.6 mg cm−2 on the carbon paper was employed as the O2 electrode for further cell assembly and the primary discharge capacity test. For comparison, an O2 electrode based on Super P only was prepared with 80 wt% Super P and 20 wt% PVDF by the same method.The cell was assembled with lithium foil (15 mm in diameter) as the anode, a glass fiber (Celgard 2300) separator, and the prepared electrode as the cathode in a glove box filled with pure argon. The electrolyte was prepared by dissolving 1 M lithium bis(trifluoromethanesulfonyl)imide (LiTFSI) in tetraethylene glycol dimethyl ether (TEGDME). The Li/separator (soaked with electrolyte)/prepared electrode was then sealed into a Swagelok cell with an air hole (10 mm in diameter) placed on the cathode side to ensure the free diffusion of oxygen.
2.4 Electrochemical test
The Li–O2 battery performance was tested in a LAND cycler (Wuhan Land Electronic Co. Ltd). The discharge/charge performances were measured in a voltage range of 2.0–4.5 V vs. Li+/Li at different current densities with respect to the total weight of Co-MOF-74 and Super P. All the tests were carried out at room temperature in an oxygen (1 atm) glove box.3. Results and discussion
The PXRD patterns of Co-MOF-74 samples synthesized with different DMF/H2O volume ratios are shown in Fig. 1. All the diffraction peak positions match well with the simulated pattern,35 indicating that all of them are from pure phase Co-MOF-74 with high crystallinity. The prominent reflections at 2θ = 6.8° and 11.8° corresponded to the [2![[1 with combining macron]](https://www.rsc.org/images/entities/char_0031_0304.gif) 0] and [300] planes of the MOF-74 single crystal. Interestingly, with the increase of volume ratios of DMF:H2O, the PXRD peak widths of the sample prepared at the ratio of 4:1 (Co-MOF-74-20) became broader, indicating a smaller grain size.
0] and [300] planes of the MOF-74 single crystal. Interestingly, with the increase of volume ratios of DMF:H2O, the PXRD peak widths of the sample prepared at the ratio of 4:1 (Co-MOF-74-20) became broader, indicating a smaller grain size.
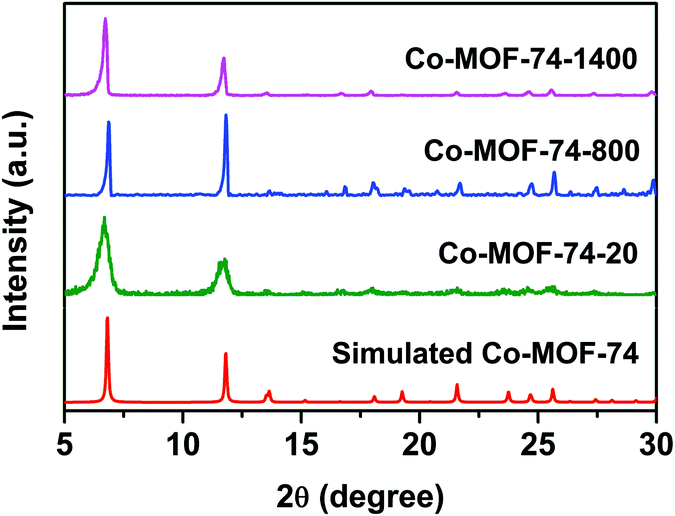 | ||
| Fig. 1 PXRD patterns of Co-MOF-74 samples synthesized with different DMF/H2O volume ratios. Co-MOF-74-1400, Co-MOF-74-800 and Co-MOF-74-20 correspond to the solvent volume ratios of 1:4, 1:1 and 4:1, respectively. | ||
Co-MOF-74 (Fig. 2a) possesses one-dimensional microporous hexagonal channels with high surface areas, which provides sufficient active sites that may enhance O2 adsorption and potential catalysis. Besides, the pore diameter of Co-MOF-74 is ∼12 Å,35–37 which allows free transportation of Li+ and O2 in the pores. Thus, the unique structure could be an ideal candidate as an O2 electrode material. Previous studies by us and other groups29,30 revealed that employing MOFs as the cathode materials has significantly enhanced the performance of Li–O2 batteries. We are particularly interested in whether the sizes and morphologies of the MOFs prepared affect the O2 adsorption and transportation in the pores, as well as the accessibility of active sites for electrochemistry.
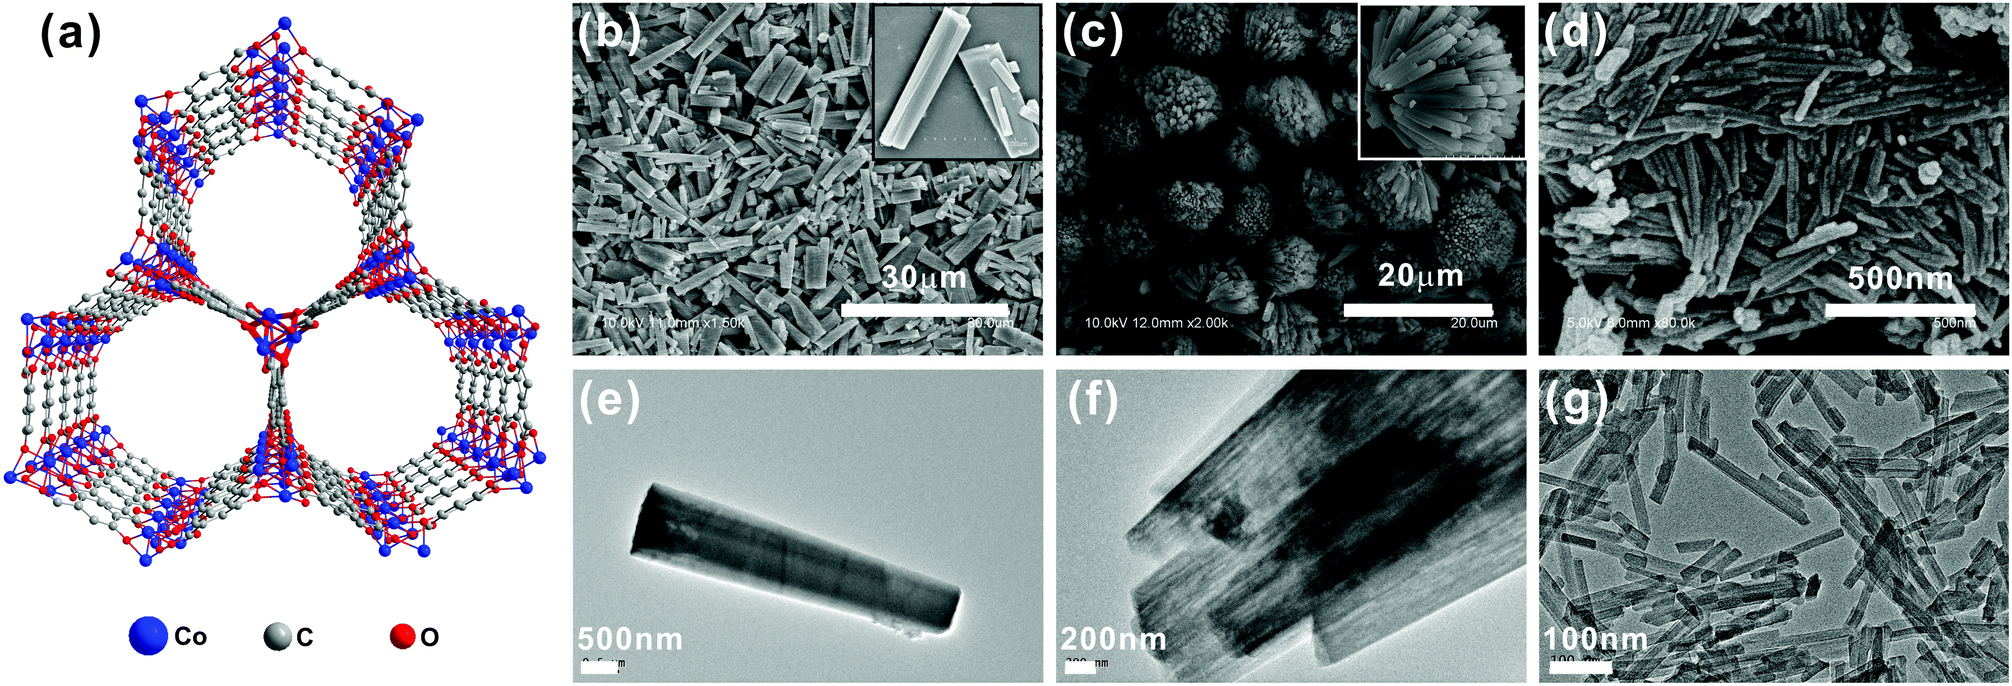 | ||
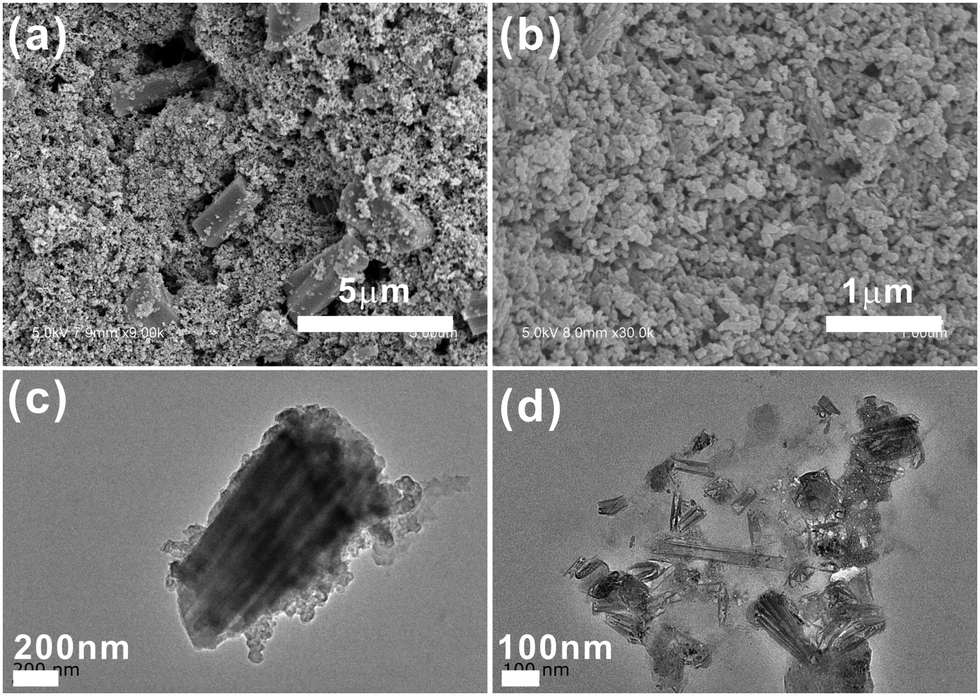
| Fig. 2 The crystal structure and morphology of Co-MOF-74. (a) Crystal structure of Co-MOF-74, the blue, red, and gray spheres represent cobalt, oxygen, and carbon atoms, respectively. (b)–(d) SEM images of Co-MOF-74-1400, Co-MOF-74-800, and Co-MOF-74-20 crystals synthesized with different solvent compositions, with high-resolution images shown as insets. (e)–(g) TEM images of Co-MOF-74-1400, Co-MOF-74-800, and Co-MOF-74-20 crystals. | ||
It is well known that the size and morphology of the materials could be finely tuned by adjusting the ratios of different solvents.38–40 We firstly examined the morphologies and sizes of Co-MOF-74 prepared with different solvent ratios of DMF/H2O, under the modulating effect of salicylic acid. SEM and TEM indicate that when the DMF/H2O volume ratio was 1:4, homogeneous rod-shaped crystals with an average length of ∼9.5 μm and a width of ∼1400 nm (named Co-MOF-74-1400) were obtained (Fig. 2b and e). However, when the synthesis was conducted with the ratio of 1:1, it yielded a hierarchical superstructure composed of nanorods that are ∼6.5 μm in length and ∼800 nm in width (named Co-MOF-74-800) (Fig. 2c). The high-magnification SEM image (inset of Fig. 2c) and the TEM image (Fig. 2f) provide detailed information about further assembly of the nanorods into the hierarchical superstructure. Further increasing the DMF amount in the solvent resulted in a sample that consists entirely of uniform nanofibers with an average diameter of 20 nm and a length/diameter ratio of 12 (named Co-MOF-74-20, Fig. 2d). The uniform size and detailed structure of the as-synthesized Co-MOF-74-20 were further confirmed by the TEM image (Fig. 2g), and the nanofiber structure with uniform sizes may guarantee the fast transfer of O2 and effective contact with the electrolyte and the catalytic sites. Overall, by adjusting the solvent composition, the sizes and morphologies of Co-MOF-74 can be finely tuned. It is worth noting that salicylic acid acts as a modulator in the synthesis, which competes with H4DOBDC in coordinating with the metal ions.34 The solvent composition has changed the modulator's capability in regulating the monodispersity and the crystal sizes in a limited range. In addition, DMF may act as the structure-directing reagent to further influence the morphology of the structure through its deprotonation and polarity.38,39,41
Low-pressure oxygen adsorption isotherms were conducted to evaluate the O2 enrichment capabilities of three Co-MOF-74 samples at 273 K (Fig. 3). As a function of pressure, the three MOFs adsorb O2 linearly without reaching plateaus, indicating that the interaction between the MOFs and O2 is relatively weak at 273 K.29,42,43 Co-MOF-74-800 and Co-MOF-74-20 exhibit similar adsorptive capacities, taking up 10.8 and 9.6 cm3 g−1 O2 at 1 atm, respectively. However, Co-MOF-74-1400 has a significantly lower capacity for O2 uptake, with the value being 3.10 cm3 g−1 at 1 atm. These values are lower than that for the previously reported parent material,29 which intrigued us to examine the surface areas of these nanosized Co-MOF-74 materials. The BET surface areas of Co-MOF-74-1400, Co-MOF-74-800, and Co-MOF-74-20 are calculated to be 669, 750, and 874 m2 g−1, by measuring low pressure N2 adsorption isotherms at 77 K, a reduction of the surface area from 1380 m2 g−1 as in the case of Co-MOF-74 in ref. 29.
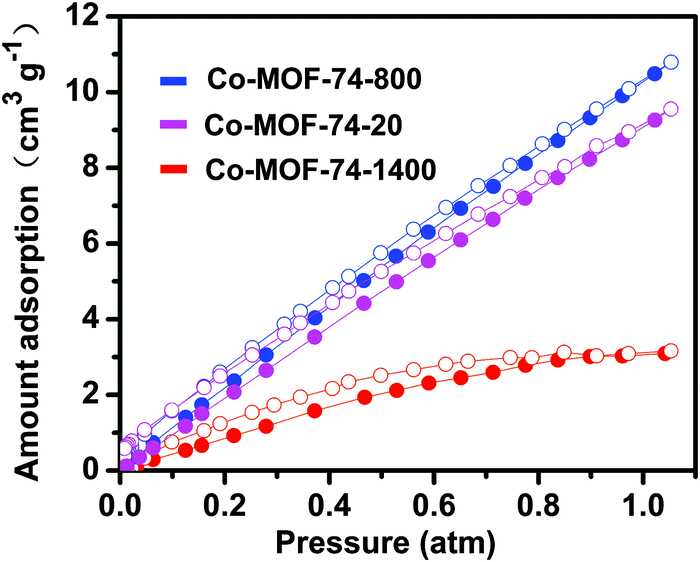 | ||
| Fig. 3 Low-pressure O2 adsorption isotherms for the Co-MOF-74-based materials at 273 K. Filled and empty symbols represent adsorption and desorption, respectively. | ||
The decrease in the O2 uptake is mainly contributed by this reduction of the surface area, which is due to the use of modulators,44 as well as the downsizing of the materials which further affect the periodicity of the frameworks. In spite of the ∼10 times increase in the concentration in the pores of Co-MOF-74-800 and Co-MOF-74-20 compared to ambient air, the oxygen enrichment effect on the whole battery properties is unclear, because MOFs take up only a small portion of the total weight of the electrode. However, compared to Co-MOF-74 synthesized without modulators, the lack of perfectness of the framework may introduce additional defect-based active sites in the pores,45,46 which may have interesting roles in the enhancement of the Li–O2 battery performance. The nanosize of the nanocrystals has further ensured the accessibility of the pristine coordinative unsaturated metals, as well as the newly introduced defect sites in Co-MOF-74 for incoming guest molecules.
To investigate the effects of the sizes and morphologies, as well as the structural features of these materials on the electrochemical performance, Co-MOF-74-1400, Co-MOF-74-800, and Co-MOF-74-20 were used as cathode materials along with Super P for rechargeable Li–O2 batteries. A battery made from pure Super P was also employed for comparison. The current density (mA g−1) and capacity (mA h g−1) were reported based on the total mass of Co-MOF-74 and Super P on the cathode. Fig. 4a shows the first discharge curves of the Li–O2 batteries that contain three MOFs with different sizes and morphologies, respectively, at a current density of 100 mA g−1 with a cutoff voltage of 2.0 V. These cathodes exhibit much improved performance compared to a pure Super P based cathode (2090 mA h g−1). The discharge capacities for batteries using Co-MOF-74-1400 and Co-MOF-74-800 are 4710 and 4880 mA h g−1, respectively, in spite of the difference in the O2 adsorption values. Remarkably, the Co-MOF-74-20 based cathode delivers a high capacity of 11350 mA h g−1, about five times the capacity of a cell without MOFs. It is worth noting that Co-MOF-74-20 has similar O2 uptake to Co-MOF-74-800, and we concluded that the capacity enhancement is mainly due to other factors such as accessibility of the active sites, shorter transportation distances of the reactants and products, as well as larger electrode–electrolyte contact areas for Li–O2 batteries.47 This observation indicates that Co-MOF-74-20, which is only 20 nm in width, with a pore diameter of 1.2 nm and a high density of 4.4 Co sites per square nanometer on the inner surface, can effectively facilitate the oxygen reduction reaction during discharge. What is more, the average operating voltages of Co-MOF-74-1400, Co-MOF-74-800, and Co-MOF-74-20 based cathodes at a discharge capacity of 1000 mA h g−1 are 2.67, 2.66, and 2.74 V, respectively; observably higher than a pure Super P based system (2.62 V). The improved discharge voltage on Co-MOF-74-based cathodes further contributes to the high energy density of these Li–O2 batteries.48 The cell based on Co-MOF-74-20 has the highest energy density value in our studies, with a value of up to 31.1 kW h kg−1. Overall, by downsizing the crystals into the nanoregion and designing more active sites by introducing defects with the use of modulators in MOF synthesis, a higher capacity (11350 mA h g−1 under 100 mA g−1 current) compared to the previously reported perfect Co-MOF-74 case (3630 mA h g−1 under 50 mA g−1)29 was achieved. In other words, making the crystals smaller and less perfect results in a lower surface area, but will create more active sites, achieving better electrochemical performance.
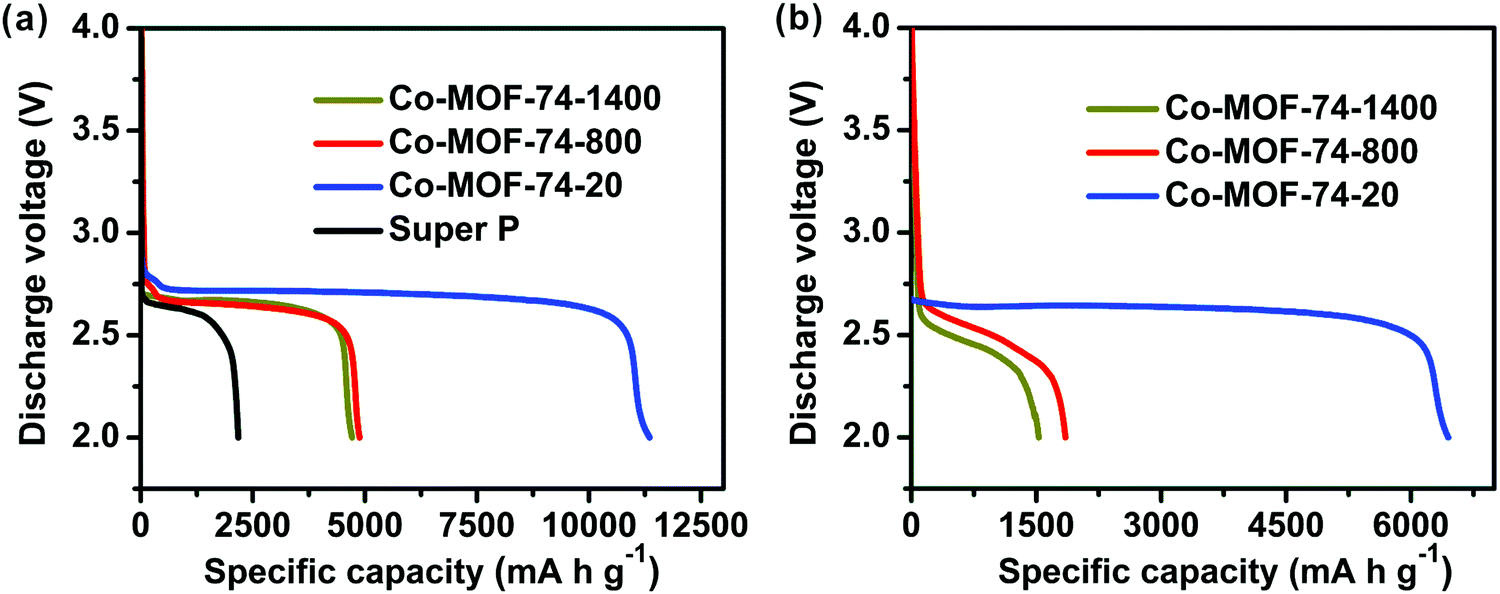 | ||
| Fig. 4 (a) Discharge curves of Li–O2 batteries at a current density of 100 mA g−1 for MOF–Super P composite electrodes or pure Super P electrodes. (b) Discharge curves of Li–O2 batteries at a current density of 500 mA g−1 for MOF–Super P composite electrodes. | ||
With the current density increased to 500 mA g−1, as shown in Fig. 4b, the discharge capacities dropped to 1530, 1850 and 6440 mA h g−1, respectively. The reduction in capacity value is moderate as compared to similar systems,29,49 and the rate performance of these batteries based on differently shaped Co-MOF-74 was effectively enhanced. Co-MOF-74-20, which has the highest primary discharge capacity, also achieves the best rate performance among the three different MOFs.
For the Co-MOF-74-20 based battery, its rate capability and cycling stability were further investigated, as shown in Fig. 5. A full charge and discharge cycle (Fig. 5a) can be obtained in the Co-MOF-74-20 based cell at a current density of 100 mA g−1 within a voltage window between 2.0 and 4.5 V vs. Li+/Li. Clearly, the discharge capacity was close to the charge capacity, suggesting that the Li2O2 product after discharge can be reversibly converted to Li and O2.50 We also noticed that the deviation of the mid-potential of 0.85 V is lower than the common value of ∼1.50 V from other typical carbon carriers.14,51 A more detailed rate capability test of Co-MOF-74-20 under three different currents (100, 200, 500 mA g−1) further confirmed the high activity (Fig. 5b). While the detailed mechanism of the MOFs' participation in the battery is still unclear, it is tempting to propose that: (i) abundant unsaturated Co active sites with a high surface density in the framework with defects and (ii) the potential catalytic effect in lowering the electron and mass transport barriers and reducing overpotentials52 due to the fine-tuning of the particle sizes and morphologies, have all contributed to the improved electrical energy efficiency of the discharge/charge process. In addition, the uniform nanofiber structure of Co-MOF-74-20 may facilitate electrolyte immersion and Li+ diffusion, and the MOF/Super P composite provides an effective space for O2 diffusion and Li2O2 formation/decomposition.49
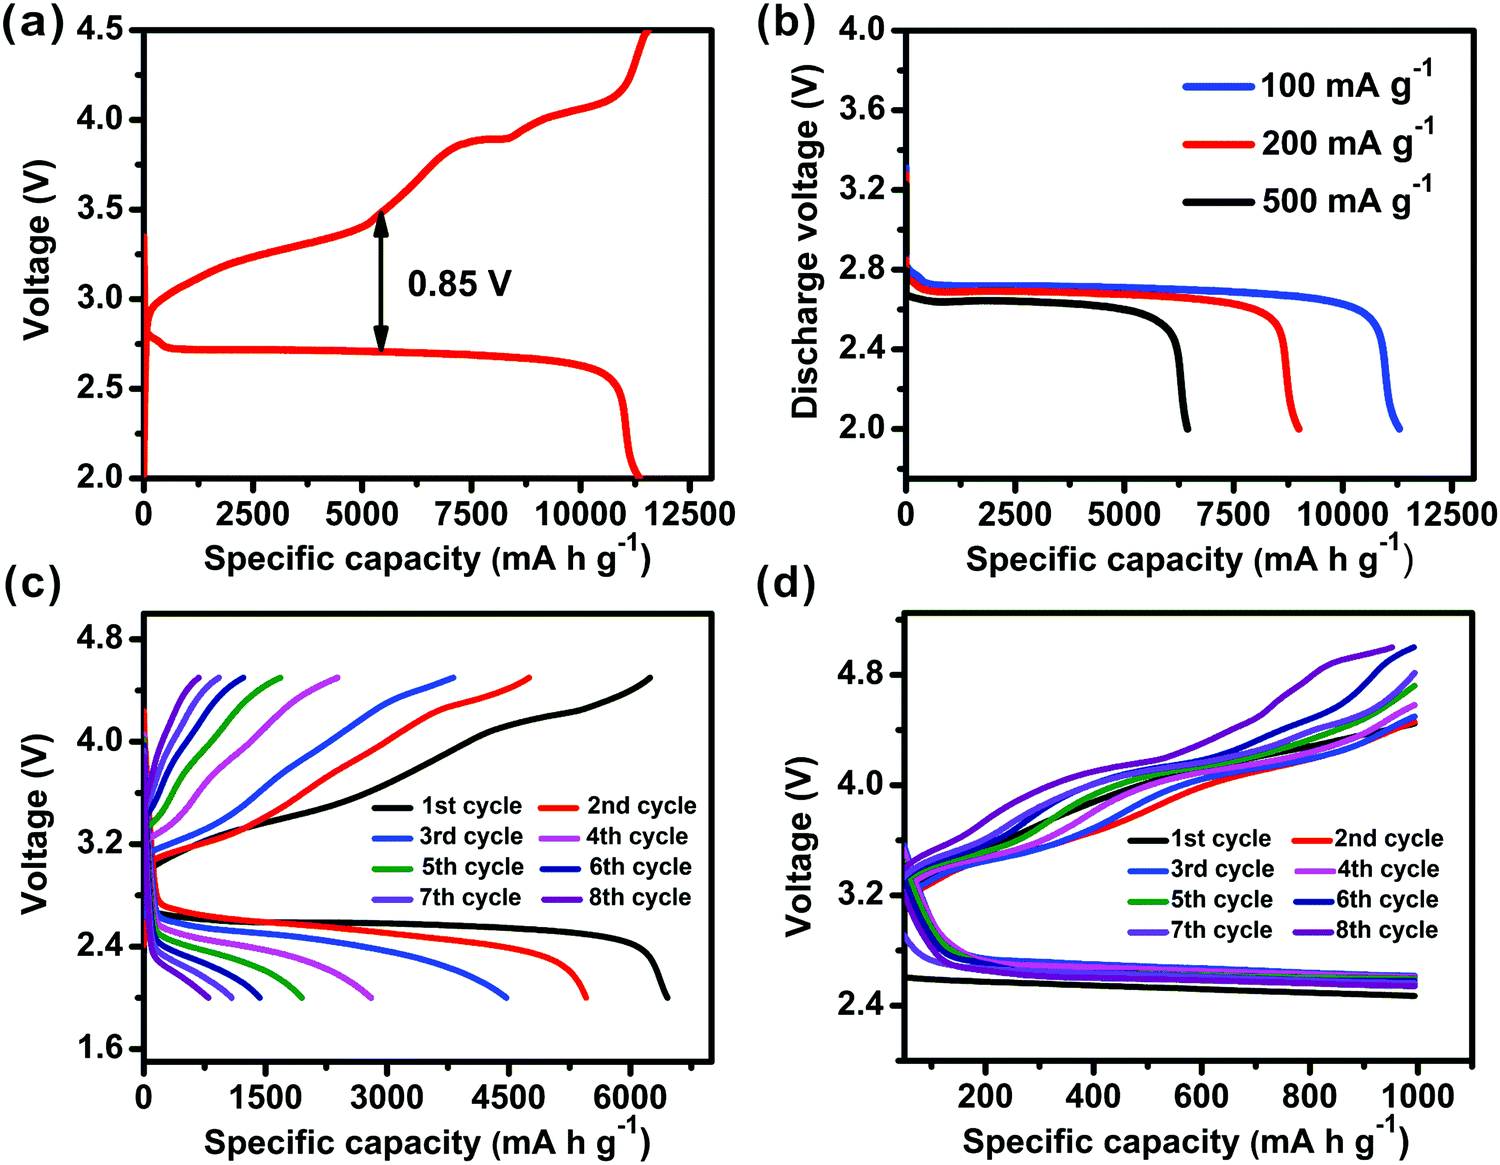 | ||
| Fig. 5 (a) The 1st discharge/charge cycle profile of a Li–O2 cell using a Co-MOF-74-20/Super P composite cathode at a current of 100 mA g−1. (b) Discharge profiles of Li–O2 batteries with Co-MOF-74-20 based at various current densities. (c) Cycling response of the Co-MOF-74-20 based battery at a current of 500 mA g−1. (d) The cycling performance of the Co-MOF-74-20 based Li–O2 cell under a specific capacity limit of 1000 mA h g−1 at a current density of 250 mA g−1. | ||
To investigate the cycling performances of these cells made from MOFs with different sizes and morphologies, the full discharge/charge profiles of the cells based on Co-MOF-74-20 were monitored for eight cycles in a voltage range of 2.0–4.5 V vs. Li+/Li at a current of 500 mA g−1. As shown in Fig. 5c, the capacity of the Li–O2 cell decays rapidly with the increase in the polarization, similar to previous works.53 Specifically, the possible accumulation of discharge products and the complicated gas-solid state conversion on the interface affect the electrode performance.30 The cycling stability of the Co-MOF-74-20 based Li–O2 cell was further evaluated with a fixed capacity of 1000 mA h g−1 at a current density of 250 mA g−1 (Fig. 5d). The discharge profiles of the first 8 cycles illustrate that the cell can operate efficiently with slightly lower voltage. With further understanding of the MOFs' role in the Li–O2 batteries and their chemical stabilities during operation, better cycling performance is expected.
To further understand the dispersion fashion and structural stability of Co-MOF-74 as an electrode material, SEM and TEM analyses were performed on the electrodes before and after the electrochemical operation. As shown in Fig. 6a and b, both Co-MOF-74-1400 and Co-MOF-74-20 were evenly dispersed with Super P, respectively, and they were loosely packed on the carbon paper. It is noteworthy that the Co-MOF-74-20 nanofibers were more homogeneous with carbon due to similar sizes. Previous studies29 on the porosity of the whole electrode confirm that the accessibility of O2 into the electrode was still retained after the MOFs were incorporated with Super P, which may facilitate oxygen transport during the discharge process and provide adequate void volume for the discharged products.49
 | ||
| Fig. 6 SEM images of a Co-MOF-74-1400 based electrode with Super P (a) and a Co-MOF-74-20 based electrode with Super P (b). TEM images of the Co-MOF-74 nanocrystals after cycling: (c) Co-MOF-74-800 and (d) Co-MOF-74-20. | ||
The electrodes were analyzed again after they were dismantled from the cell followed by cycling tests with extra time under 4 V class after charging. The TEM image in Fig. 6c clearly indicates that the morphology of Co-MOF-74-800 after cycling is basically similar to that in the pristine state, although carbon and discharge products30 attached on the surface or some limited local structural damage was observed. Furthermore, the diameter of the pristine Co-MOF-74-20 framework did not change after cycling (Fig. 6d), suggesting that the skeletons of the MOFs are possibly intact during the operation. We tried to record the PXRD patterns of the electrode after the cell was dismantled, but the loading of active MOF materials on carbon paper is too low and no strong peak from the MOF can be identified from the diffraction. Further studies are needed to confirm the chemical stability of the MOFs at high voltages.
4. Conclusion
In summary, Co-MOF-74 materials with distinct sizes and morphologies were successfully synthesized by a facile and effective method via applying modulators and controlling the solvent composition ratios. The sizes of the materials can be precisely and uniformly controlled from several unit cell lengths to 1400 nm. Despite the use of modulators, the high porosity and the subsequent O2 adsorption uptake still remain (874 m2 g−1 surface area for Co-MOF-74-20 with 9.6 cm3 g−1 O2 uptake at 1 atm). In comparison with the electrode with carbon only, the Co-MOF-74 based electrode displayed higher discharge capacity and improved rate capability. Specifically, the Co-MOF-74-20 based Li–O2 batteries attained a capacity of 11350 mA h g−1 at 100 mA g−1 and 6440 mA h g−1 at 500 mA g−1. The structural features of MOFs with desired sizes and morphologies have allowed us to systematically design pores with a high density of unsaturated active sites for electrochemistry, as well as efficient diffusion paths with lowered electron and mass transport barriers, contributing to high performance Li–O2 batteries. These results show that the facile design of nanocrystals with specific inner diffusion paths could further improve the electrochemistry performance of the electrode materials.
Acknowledgements
We would like to express thanks to Jiangsu Provincial financial support of Fundamental Conditions and Science and Technology for People's Livelihood for Jiangsu Key Laboratory of Advanced Metallic Materials (BM2007204), the National Natural Science Foundation of China (21475021, 21427807, and 21571037), the Natural Science Foundation of Jiangsu Province (BK20141331) and the Fundamental Research Funds for the Central Universities (2242016K40083).References
- K. M. Abraham and Z. Jiang, J. Electrochem. Soc., 1996, 143, 1–5 CrossRef CAS.
- H. G. Jung, J. Hassoun, J. B. Park, Y. K. Sun and B. Scrosati, Nat. Chem., 2012, 4, 579–585 CrossRef CAS PubMed.
- P. G. Bruce, S. A. Freunberger, L. J. Hardwick and J. M. Tarascon, Nat. Mater., 2012, 11, 19–29 CrossRef CAS PubMed.
- Y. C. Lu, B. M. Gallant, D. G. Kwabi, J. R. Harding, R. R. Mitchell, M. S. Whittingham and Y. Shao-Horn, Energy Environ. Sci., 2013, 6, 750–768 CAS.
- J. Lu, L. Li, J. B. Park, Y. K. Sun, F. Wu and K. Amine, Chem. Rev., 2014, 114, 5611–5640 CrossRef CAS PubMed.
- Z. Peng, S. A. Freunberger, Y. Chen and P. G. Bruce, Science, 2012, 337, 563–566 CrossRef CAS PubMed.
- Y. Liu, L. J. Cao, C. W. Cao, M. Wang, K. L. Leung, S. S. Zeng, T. F. Hung, C. Y. Chung and Z. G. Lu, Chem. Commun., 2014, 50, 14635–14638 RSC.
- H. Wang, Y. Yang, Y. Liang, G. Zheng, Y. Li, Y. Cui and H. Dai, Energy Environ. Sci., 2012, 5, 7931–7935 CAS.
- X. Huang, H. Yu, H. Tan, J. Zhu, W. Zhang, C. Wang, J. Zhang, Y. Wang, Y. Lv, Z. Zeng, D. Liu, J. Ding, Q. Zhang, M. Srinivasan, P. M. Ajayan, H. H. Hng and Q. Yan, Adv. Funct. Mater., 2014, 24, 6516–6523 CrossRef CAS.
- J. H. Kim, A. G. Kannan, H. S. Woo, D. G. Jin, W. Kim, K. Ryu and D. W. Kim, J. Mater. Chem. A, 2015, 3, 18456–18465 CAS.
- S. Ganapathy, Z. Li, M. S. Anastasaki, S. Basak, X. F. Miao, K. Goubitz, H. W. Zandbergen, F. M. Mulder and M. Wagemaker, J. Phys. Chem. C, 2016, 120, 18421–18427 CAS.
- J. Xiao, D. Mei, X. Li, W. Xu, D. Wang, G. L. Graff, W. D. Bennett, Z. Nie, L. V. Saraf, I. A. Aksay, J. Liu and J. G. Zhang, Nano Lett., 2011, 11, 5071–5078 CrossRef CAS PubMed.
- Q. Li, R. Cao, J. Cho and G. Wu, Phys. Chem. Chem. Phys., 2014, 16, 13568–13582 RSC.
- Y. C. Lu, Z. Xu, H. A. Gasteiger, S. Chen, K. Hamad-Schifferli and Y. Shao-Horn, J. Am. Chem. Soc., 2010, 132, 12170–12171 CrossRef CAS PubMed.
- F. Li, D. M. Tang, Y. Chen, D. Golberg, H. Kitaura, T. Zhang, A. Yamada and H. Zhou, Nano Lett., 2013, 13, 4702–4707 CrossRef CAS PubMed.
- R. Black, J. H. Lee, B. Adams, C. A. Mims and L. F. Nazar, Angew. Chem., Int. Ed., 2013, 52, 392–396 CrossRef CAS PubMed.
- J. Park, Y. S. Jun, W. R. Lee, J. A. Gerbec, K. A. See and G. D. Stucky, Chem. Mater., 2013, 25, 3779–3781 CrossRef CAS.
- O. M. Yaghi, M. O'Keeffe, N. W. Ockwig, H. K. Chae, M. Eddaoudi and J. Kim, Nature, 2003, 423, 705–714 CrossRef CAS PubMed.
- S. Kitagawa, R. Kitaura and S. Noro, Angew. Chem., Int. Ed., 2004, 43, 2334–2375 CrossRef CAS PubMed.
- H. Deng, C. J. Doonan, H. Furukawa, R. B. Ferreira, J. Towne, C. B. Knobler, B. Wang and O. M. Yaghi, Science, 2010, 327, 846–850 CrossRef CAS PubMed.
- G. Férey, C. Serre, T. Devic, G. Maurin, H. Jobic, P. L. Llewellyn, G. D. Weireld, A. Vimont, M. Daturi and J. S. Chang, Chem. Soc. Rev., 2011, 40, 550–562 RSC.
- H. Furukawa, K. E. Cordova, M. O'Keeffe and O. M. Yaghi, Science, 2013, 341, 974–986 CrossRef CAS PubMed.
- W. Xia, A. Mahmood, R. Zou and Q. Xu, Energy Environ. Sci., 2015, 8, 1837–1866 CAS.
- A. Mahmood, W. Guo, H. Tabassum and R. Zou, Adv. Energy Mater., 2016, 6, 1600423 CrossRef.
- R. R. Salunkhe, Y. Kamachi, N. L. Torad, S. M. Hwang, Z. Sun, S. X. Dou, J. H. Kim and Y. Yamauchi, J. Mater. Chem. A, 2014, 2, 19848–19854 CAS.
- L. Ge, Y. Yang, L. Wang, W. Zhou, R. De Marco, Z. Chen, J. Zou and Z. Zhu, Carbon, 2015, 82, 417–424 CrossRef CAS.
- R. Demir-Cakan, M. Morcrette, F. Nouar, C. Davoisne, T. Devic, D. Gonbeau, R. Dominko, C. Serre, G. Ferey and J. M. Tarascon, J. Am. Chem. Soc., 2011, 133, 16154–16160 CrossRef CAS PubMed.
- S. Maiti, A. Pramanik, U. Manju and S. Mahanty, ACS Appl. Mater. Interfaces, 2015, 7, 16357–16363 CAS.
- D. Wu, Z. Guo, X. Yin, Q. Pang, B. Tu, L. Zhang, Y. G. Wang and Q. Li, Adv. Mater., 2014, 26, 3258–3262 CrossRef CAS PubMed.
- X. Hu, Z. Zhu, F. Cheng, Z. Tao and J. Chen, Nanoscale, 2015, 7, 11833–11840 RSC.
- J. Cravillon, R. Nayuk, S. Springer, A. Feldhoff, K. Huber and M. Wiebcke, Chem. Mater., 2011, 23, 2130–2141 CrossRef CAS.
- H. J. Lee, J. We, J. O. Kim, D. Kim, W. Cha, E. Lee, J. Sohn and M. Oh, Angew. Chem., Int. Ed., 2015, 54, 10564–10568 CrossRef CAS PubMed.
- M. Sindoro, A. Y. Jee and S. Granick, Chem. Commun., 2013, 49, 9576–9578 RSC.
- M. Sindoro, N. Yanai, A. Jee and S. Granike, Acc. Chem. Res., 2013, 47, 459–469 CrossRef PubMed.
- P. D. C. Dietzel, Y. Morita, R. Blom and H. Fjellvåg, Angew. Chem., Int. Ed., 2005, 117, 6512–6516 CrossRef.
- Y. S. Bae, C. Y. Lee, K. C. Kim, O. K. Farha, P. Nickias, J. T. Hupp, S. T. Nguyen and R. Q. Snurr, Angew. Chem., Int. Ed., 2012, 51, 1857–1860 CrossRef CAS PubMed.
- N. L. Rosi, J. Kim, M. Eddaoudi, B. Chen, M. O'Keeffe and O. M. Yaghi, J. Am. Chem. Soc., 2005, 127, 1504–1518 CrossRef CAS PubMed.
- X. Cheng, A. Zhang, K. Hou, M. Liu, Y. Wang, C. Song, G. Zhang and X. Guo, Dalton Trans., 2013, 42, 13698–13705 RSC.
- B. Zhang, J. Zhang, C. Liu, X. Sang, L. Peng, X. Ma, T. Wu, B. Han and G. Yang, RSC Adv., 2015, 5, 37691–37696 RSC.
- X. Wan, F. Jiang, L. Chen, M. Wu, M. Zhang, J. Pan, K. Su, Y. Yang and M. Hong, Cryst. Growth Des., 2015, 15, 1481–1491 CAS.
- E. Stavitski, M. Goesten, J. Juan-Alcaniz, A. Martinez-Joaristi, P. Serra-Crespo, A. V. Petukhov, J. Gascon and F. Kapteijn, Angew. Chem., Int. Ed., 2011, 50, 9624–9628 CrossRef CAS PubMed.
- X. Kong, E. Scott, W. Ding, J. A. Mason, J. R. Long and J. A. Reimer, J. Am. Chem. Soc., 2012, 134, 14341–14344 CrossRef CAS PubMed.
- D. Britt, H. Furukawa, B. Wang, T. G. Glover and O. M. Yaghi, Proc. Natl. Acad. Sci. U. S. A., 2009, 106, 20637–20640 CrossRef CAS PubMed.
- F. Wang, H. Guo, Y. Chai, Y. Li and C. Liu, Microporous Mesoporous Mater., 2013, 173, 181–188 CrossRef CAS.
- Z. Fang, J. P. Durholt, M. Kauer, W. Zhang, C. Lochenie, B. Jee, B. Albada, N. Metzler-Nolte, A. Poppl, B. Weber, M. Muhler, Y. Wang, R. Schmid and R. A. Fischer, J. Am. Chem. Soc., 2014, 136, 9627–9636 CrossRef CAS PubMed.
- F. Vermoortele, B. Bueken, G. Le Bars, B. Van de Voorde, M. Vandichel, K. Houthoofd, A. Vimont, M. Daturi, M. Waroquier, V. Van Speybroeck, C. Kirschhock and D. E. De Vos, J. Am. Chem. Soc., 2013, 135, 11465–11468 CrossRef CAS PubMed.
- L. Ji and X. Zhang, Nanotechnology, 2009, 20, 155705 CrossRef PubMed.
- Q. Li, P. Xu, W. Gao, S. Ma, G. Zhang, R. Cao, J. Cho, H. L. Wang and G. Wu, Adv. Mater., 2014, 26, 1378–1386 CrossRef CAS PubMed.
- Z. Guo, D. Zhou, X. Dong, Z. Qiu, Y. Wang and Y. Xia, Adv. Mater., 2013, 25, 5668–5672 CrossRef CAS PubMed.
- Z. Wang, D. Xu, J. Xu, L. Zhang and X. Zhang, Adv. Funct. Mater., 2012, 22, 3699–3705 CrossRef CAS.
- T. Zhang and H. Zhou, Angew. Chem., Int. Ed., 2012, 124, 11224–11229 CrossRef.
- J. Shui, N. K. Karan, M. Balasubramanian, S. Li and D. Liu, J. Am. Chem. Soc., 2012, 134, 16654–16661 CrossRef CAS PubMed.
- H. D. Lim, K. Y. Park, H. Song, E. Y. Jang, H. Gwon, J. Kim, Y. H. Kim, M. D. Lima, R. Ovalle Robles, X. Lepro, R. H. Baughman and K. Kang, Adv. Mater., 2013, 25, 1348–1352 CrossRef CAS PubMed.
| This journal is © the Partner Organisations 2017 |