DOI:
10.1039/C6QM00118A
(Research Article)
Mater. Chem. Front., 2017,
1, 550-561
Luminescence properties of La2W2−xMoxO9 (x = 0–2):Eu3+ materials and their Judd–Ofelt analysis: novel red line emitting phosphors for pcLEDs†
Received
8th July 2016
, Accepted 12th August 2016
First published on 15th September 2016
Abstract
A series of novel red emitting La1.95Eu0.05W2−xMoxO9 (x = 0–2, in steps of 0.1) and La2−yEuyW1.6Mo0.4O9 (y = 0–2, insteps of 0.2) phosphors were prepared by a conventional solid state reaction. Powder XRD analysis of La1.95Eu0.05W2−xMoxO9 (x = 0–2, in steps of 0.1) reveals a phase transition from a triclinic to a cubic structure with increasing Mo6+ concentration (x ≥ 0.2). All the compositions show a broad charge transfer (CT) band due to CT from O to W/Mo and red emission (due to Eu3+ ions). In order to obtain the strongest red emission, concentration variation of Eu3+ was performed in La2−yEuyW1.6Mo0.4O9 (x = 0–2, insteps of 0.2). The Eu1.6La0.4W1.6Mo0.4O9 composition shows a high red emission intensity (∼8.2 times) compared to a commercial red phosphor with very good CIE chromaticity coordinates (x = 0.67, y = 0.33). A selected composition has also been synthesized by simple co-precipitation method. The emission intensity of the Eu1.6La0.4W1.6Mo0.4O9 phosphor synthesized by co-precipitation technique is ∼1.78 times higher than that of the phosphor synthesized by the solid state reaction. Phonon sideband spectrum analysis has been carried out for Eu3+ activated La2M2O9 (M = W and Mo). The temperature dependent photoluminescence studies reveal that the Eu1.4La0.6W1.6Mo0.4O9 compositions loses 30% of its efficiency up to 400 K (compared to ∼80% for CaS:Eu2+) and the Judd–Ofelt parameters were also calculated for the Eu3+ ions.
Introduction
There is an ever-increasing petition to improve the efficiency of lighting devices, because ∼20% of generated electricity is currently devoted to lighting. Solid-state lighting (SSL, including white LEDs) based on semiconductor InGaN LED chips is an attractive alternative to replace conventional fluorescent lamps and incandescent bulbs due to its extraordinary features such as high emission quantum efficiencies, prolonged lifetime, and harmless constituent atoms.1 The reason behind the development of SSL lies in dynamic research on down conversion phosphor materials.2a,b There are abundant methods that are available to create white light from LEDs, one of the straightforward ways to generate white light is from primary color LEDs (InGaN based blue, green LEDs and red AlGaInP LED).3 Commercialization of these is difficult since it requires independent output power control on each LED since the operating voltage is different between InGaN-based LEDs and AlGaInP-based LEDs. The first white LED based on a blue InGaN LED and a yellow emitting (Y3Al5O12:Ce3+, YAG:Ce3+) phosphor has been commercialized by Nichia, Japan.4 The yellow YAG:Ce3+ phosphor’s efficiency was improved by crystal chemical substitution in the host lattice YAG:Ce3+ (Y1−aGda)3(Al1−bGab)5O12:Ce3+.5,6 The spectral composition of the white light which is obtained from the white LED (blue LED + yellow phosphor) differs from that of natural white light. It is mainly due to the halo effect of blue/yellow color separation and poor color rendering index (CRI) caused by the lack of red component in the emission region. An alternative way to mimic efficient white light with a better CRI is the combination of a blue-emitting LED with green-emitting or red-emitting phosphors, or red-, green- and blue-(RGB) emitting phosphors with a near ultraviolet (NUV) LED.7 Currently, lanthanide activated sulfide and nitride [Y2O2S:Eu3+, SrGa2S4:Eu2+, CaS:Eu2+, Sr3Si5N8:Eu2+, CaSiAlN3:Eu2+] red phosphors are widely being used for SSL applications.8a,b The synthesis of sulfide based phosphors requires sulfur containing gases (H2S and CS2). These have a severe environmental impact due to their toxic nature towards aspects of human health. Meanwhile, there are practical difficulties in the synthesis of nitride based phosphors since a very high temperature (>1800 °C), an ammonia atmosphere and high pressure (10 MPa) are required. So the use of sulfide and nitride based phosphors is ruled out and the search for non-toxic highly efficient host materials has attracted researchers, and this is how the oxide based phosphor came into the scenario. In order to achieve a high luminous output, the emission band should have a full width at half-maximum (FWHM) which is as small as possible.8b However, the emission spectrum of Eu2+ activated nitride or oxynitride is very broad (FWHM = ∼80 to 90 nm). The overall luminous efficiency of radiation (LER) decreases due to the fact that the larger part of the spectrum is beyond 650 nm in wavelength and insensitive to the human eye.9a–d On the other hand, the use of oxide based phosphor materials is free of the complications incurred from sulfide and nitride based phosphors and hence research and development of highly efficient oxide based phosphors is advantageous.
Among all the red emitting phosphors, Eu3+ substituted oxide based phosphors have attracted much interest due to their simple electronic energy level scheme and hypersensitive transitions (pure red emission). Generally, Eu3+ emission arises mainly from the 5D0 level to the 7FJ (J = 0, 1, 2, 3, 4) manifolds. The intensity of the magnetic dipole transitions (5D0 → 7F1, ∼590 nm) and the electric dipole transition (5D0 → 7F2, ∼615 nm) is dependent on the local site symmetry of the Eu3+ ion present in the host lattice. The larger amplitude of the 5D0 → 7F2 transition than that of the 5D0 → 7F1 transition is an indication that the symmetry around Eu3+ does not contain an inversion center.8a
Trivalent Eu substituted phosphor materials with either MO4 tetrahedra or MO6 octahedra [M = W or Mo] are a choice of interest due to their exceptional absorption from the near UV to blue region where the LED emission occurs, in addition these structures show decent chemical stability.8a,b,10a–c Scheelite based compounds have been widely studied as efficient red phosphors and demonstrate potential for application in phosphor converted white LEDs.11a–c Recently, we have explored the tungstate and molybdate based narrow-band red emitting phosphor La1.95Eu0.05W2−xMoxO9 (x = 0–2, in steps of 0.3) as a possible candidate for white light emitting diodes, due to its high absorption in the blue region and emission intensity (∼3.8 times that of the commercial red phosphor, Y2O2S:Eu3+, Nichia).12 In the present study, we have systematically investigated the phase transition, thermal quenching and Eu3+ luminescence in La1.95Eu0.05W2−xMoxO9 (x = 0–2, in steps of 0.1) phosphors in detail. In order to improve the absorption strength (excitation spectrum) and emission intensity of the La1.95Eu0.05W1.4Mo0.6O9 phosphor, concentration variation of Eu3+ has been carried out in La2−yEuyW1.6Mo0.4O9 (y = 0–2, in steps of 0.2). The red emission intensities of the presently studied compositions are compared with that of the commercial red phosphor (Y2O2S:Eu3+, Nichia). A phonon sideband (PSB) was also observed in the Eu3+ doped La2M2O9 phosphors. The Judd–Ofelt parameters were also calculated for the Eu3+ substituted compositions.
The high temperature solid state reaction method had certain disadvantages, such as inhomogeneous mixing, and difficulty in controlling the product’s morphology, crystalline/particle size and distribution.13 The use of a nonconventional method such as a co-precipitation method could facilitate overcoming the problem of inhomogeneity and higher particle size. Many of the commercially available phosphors have been synthesized by the co-precipitation technique and have found enhancement in luminescence intensity. L.-T. Chen et al., synthesized the BAM phosphor by the TEA co-precipitation method as well as by a solid state reaction. The phosphor which was synthesized by the TEA co-precipitation method showed a stronger relative luminescence intensity of Eu2+.14 Ce-doped YAG phosphor powders were prepared by co-precipitation and heterogeneous precipitation methods and the phosphors showed a better intensity compared to that of the heterogeneous precipitation technique.15 In addition, a comparative investigation into the synthesis and photoluminescence of the YAG:Ce phosphor has been reported. The phosphor obtained by the co-precipitation method is more homogeneous due to mixing of the starting materials at the molecular level.16 Red phosphor [Y2(MoO4)3:Eu3+] with a flowerlike shape was prepared via a co-precipitation method. The emission quantum efficiency was found to be 22.38% for the 5D0 level of the Eu3+ ion and the CIE color coordinates are (x = 0.656 and y = 0.344). Microwave-assisted hydrothermal synthesis, the growth mechanism and luminescent properties of 3D flower-shaped NaY(WO4)2:Eu3+ microarchitectures have also been reported.17 In the present study, efforts have been made to synthesize a phosphor through a method other than conventional synthetic methods (via co-precipitation), in order to further improve the efficiency of the selected phosphor Eu1.6La0.4W1.6Mo0.4O9 (synthesized by a solid state reaction).
Experimental
Solid state synthesis
A series of La1.95Eu0.05W2−xMoxO9 (x = 0–2, in steps of 0.1), and La2−yEuyW1.6Mo0.4O9 (y = 0–2, in steps of 0.2) phosphors were prepared from the appropriate mixtures of La2O3 (99.9%, Sigma Aldrich), Eu2O3 (99.99%, Sigma Aldrich), MoO3 (99.99%, Sigma Aldrich), and WO3 (99.99%, Sigma Aldrich), by a high temperature solid state reaction. La2O3 was heated at 1200 °C for 12 h prior to use to ensure decarbonation. The oxides were well mixed with agate mortar and heated in air at 500 °C for 6 h to decompose the carbonates. The powder samples were ground again and heated in air at 1100 °C for 6 h.
Co-precipitation technique
The selected phosphor was synthesized by a co-precipitation technique. Eu(NO3)3·6H2O and La(NO3)3·6H2O were prepared through dissolving Eu2O3 and La2O3 in nitrate acid (the volume ratio between nitric acid and water is 1![[thin space (1/6-em)]](https://www.rsc.org/images/entities/char_2009.gif) :
:![[thin space (1/6-em)]](https://www.rsc.org/images/entities/char_2009.gif) 1). Then, the resultant solutions were dried and white powders of Eu(NO3)3·6H2O and La(NO3)3·6H2O were obtained. The white powders were dissolved in 10 ml of deionized water (labelled solution A), and MoO3 (99.99%, Sigma Aldrich) and WO3 (99.99%, Sigma Aldrich) were dissolved in liquid ammonia (labelled solution B). Solution A was slowly dropped into solution B under magnetic stirring, and subsequently a greenish white precipitate was formed. After reacting for 1 hour, the precursor solution was filtered and the resultant precipitate was washed several times with deionized water and acetone. Then the powder was dried under vacuum overnight and finally, the La0.6Eu1.4W1.6Mo0.4O9 red phosphor was obtained and calcined at 1000 °C for 2 h.
1). Then, the resultant solutions were dried and white powders of Eu(NO3)3·6H2O and La(NO3)3·6H2O were obtained. The white powders were dissolved in 10 ml of deionized water (labelled solution A), and MoO3 (99.99%, Sigma Aldrich) and WO3 (99.99%, Sigma Aldrich) were dissolved in liquid ammonia (labelled solution B). Solution A was slowly dropped into solution B under magnetic stirring, and subsequently a greenish white precipitate was formed. After reacting for 1 hour, the precursor solution was filtered and the resultant precipitate was washed several times with deionized water and acetone. Then the powder was dried under vacuum overnight and finally, the La0.6Eu1.4W1.6Mo0.4O9 red phosphor was obtained and calcined at 1000 °C for 2 h.
The compositions were checked for phase formation by X-ray powder diffraction (XRD) using Cu-Kα1 radiation (Rigaku, ULTIMA IV). The UV-Vis spectrum was recorded using a Perkin Elmer Lambda 55 spectrophotometer. The excitation and emission spectra were recorded on a Horiba Jobin Yvon, USA/Fluoromax 4P spectrophotometer, which utilizes a 150 W Xe lamp as the excitation source. Temperature-dependent PL spectra were obtained using a DARSA PRO 5100 PL System (PSI Scientific Co. Ltd, Korea) equipped with a sample holder connected to a temperature controller. The morphology and elemental compositions were measured using a field emission scanning electron microscope equipped with an energy dispersive X-ray system FE-SEM-EDX (Nova NanoSEM 450/FEI). All the measurements were carried out at room temperature (RT). The Fourier transform infrared (FTIR) spectra were measured using a Bruker Alpha-E FTIR Spectroscope over a wavelength ranging from 400 to 4000 cm−1, with the KBr pellet technique.
Results and discussion
Crystal structure and phase formation
α-La2W2O9 and β-La2W2O9 are the two different (low and high temperature polymorphs, respectively) structures of La2W2O9. β-La2W2O9 crystallizes in a cubic structure, whereas α-La2W2O9 crystallizes in a triclinic structure.18 Similarly La2Mo2O9 also exhibits two different structures, its low temperature polymorph α-La2Mo2O9 crystallizes in a monoclinic structure (exhibiting a 2 × 3 × 4 superstructure of the cubic form), whereas its high temperature polymorph, β-La2Mo2O9, crystallizes in cubic structure. In the α-La2W2O9 structure, W1 is surrounded by five oxygen atoms which form a trigonal bipyramid, whereas W2 is in a six-fold octahedral coordination. Two octahedra share two corners with two trigonal bipyramids in order to form a four-membered ring with a [W4O18]12− formulation. All of the nine oxygen atom sites are involved in one isolated cluster. The Mo atom in β-La2Mo2O9 is approximatively in a trigonal bipyramidal surrounding with statistical occupancy for two on the three oxygen sites. The X-ray powder diffraction patterns of the selected compositions of La1.95Eu0.05W2−xMoxO9 (x = 0–2, in steps of 0.1) with its parent compounds are shown in Fig. 1. In the La1.95Eu0.05W2−xMoxO9 (x = 0–2, in steps of 0.1) compositions, for x ≤ 0.2 all of the compositions crystallize in a triclinic structure and on further increasing x, the system undergoes a compositionally induced phase transition from a triclinic structure to a cubic structure (x ≥ 0.2). No impurity line was found in the XRD patterns clearly indicating that the compounds formed are of a single phase.
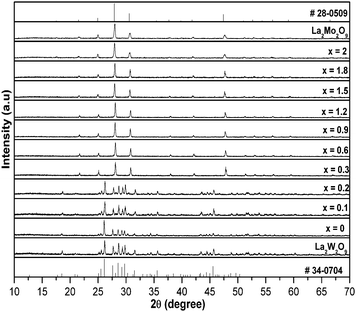 |
| | Fig. 1 X-ray powder diffraction patterns of select compositions of La1.95Eu0.05W2−xMoxO9 (x = 0–2, in steps of 0.1) with its parent compounds. | |
Morphology of the powder samples
The microstructures and particle sizes of the synthesized powders were inspected by FE-SEM (Fig. 2a–d). All the micrographs show nearly round or elliptical fashioned particles with some kinds of aggregation in the case of the phosphor synthesized via a typical solid state reaction method (Fig. 2c and d). The size distribution of the particles is 0.4–3 μm, which is appropriate for the fabrication of SSL (solid state light) devices. Meanwhile, the case of the phosphor synthesized via the co-precipitation procedure (Fig. 2a and b) shows an irregular shape with more agglomeration of the particles compared to the previous method. The effect of the particles’ size and agglomeration on the photoluminescent properties is quite significant and is discussed in the following section. Fig. 2e represents the EDX spectrum of Eu1.4La0.6W1.6Mo0.4O9, which confirms the presence of La, Eu, Mo, W and O atoms in the compound and provides supporting evidence to confirm the composition and purity. The molar ratio of La to Eu was found to be 1![[thin space (1/6-em)]](https://www.rsc.org/images/entities/char_2009.gif) :
:![[thin space (1/6-em)]](https://www.rsc.org/images/entities/char_2009.gif) 2.33.
2.33.
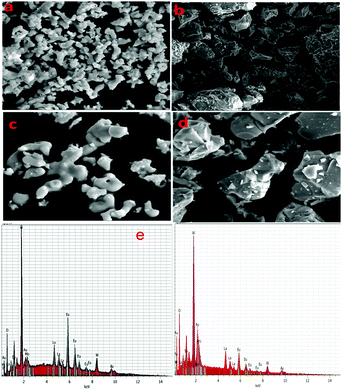 |
| | Fig. 2 Comparison of FE-SEM images of Eu1.4La0.6W1.6Mo0.4O9 solid state (b and d) versus co-precipitation (a and c), (e) EDX spectrum of Eu1.4La0.6W1.6Mo0.4O9. | |
FT-IR studies of La0.6Eu1.4W1.6Mo0.4O9
The FT-IR spectra of the corresponding phosphor is shown in Fig. 3. The absorption bands observed in the lower wavenumber region i.e. less than 950 cm−1 were assigned to the metal oxygen (M–O) bonds. So the peaks at 427 cm−1, 878 cm−1 and 1019 cm−1 were attributed to the ν1, ν3 and ν2 modes of the MO4 group (M–O, M = Mo/W) bond stretching vibration. The main absorption bands were detected at 427 cm−1, 878 cm−1 and 1019 cm−1, and were assigned to La2M2O9 (M = Mo/W). In addition, the appeared additional bands at 3559 and 1651 cm−1 correspond to surface-absorbed water and hydroxyl groups, respectively. The band located at 2367 cm−1 arises from a small quantity of CO2 in the air. The observed band at 2925 cm−1 belongs to a C–H stretching frequency, this could be a possible solvent molecule present on the surface of the phosphor.19
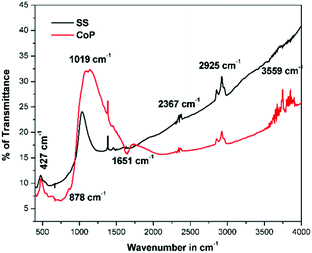 |
| | Fig. 3 FT-IR spectra of La0.6Eu1.4W1.6Mo0.4O9 synthesized via solid state and co-precipitation methods. | |
DRS study of LaM2O9:Eu3+
The diffuse reflectance spectra of La2M2O9 [M = W and Mo] and La1.95Eu0.05Mo1.8W0.2O9 are shown in Fig. 4. The DRS spectra show a broad absorption band which is attributed to the charge transfer transition from oxygen to tungsten or molybdenum. In addition to this, the Eu substituted composition shows additional absorption at around 395 and 465 nm which is attributed to the Eu f–f electronic transitions.
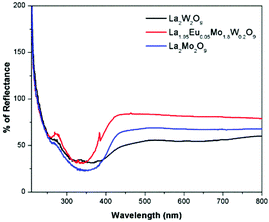 |
| | Fig. 4 DRS spectra of La2M2O9 [M = W and Mo] and La1.95Eu0.05Mo1.8W0.2O9. | |
Luminescence of La1.95Eu0.05W2O9 and La1.95Eu0.05Mo2O9
The room temperature photoluminescence excitation and emission spectrum and the corresponding energy level diagram of La1.95Eu0.05W2O9 are shown in Fig. 5. The excitation spectrum shows a broad absorption band as well as line absorption. The broad absorption band (250 to 350 nm) is due to charge transfer from oxygen to tungsten (Eu–O is not observed clearly, this may be due to the overlap with the O to W CT band), whereas the line absorptions are due to 4f–4f electronic transitions of the Eu3+ ion. The emission spectrum contains sharp lines at 615 nm and 592 nm which are due to 5D0–7F2 electric dipole (ED) and 5D0–7F1 magnetic dipole (MD) transitions of the Eu3+ ion, respectively. However, no emission corresponding to tungstate is observed. The photoluminescence excitation and emission spectrum of La1.95Eu0.05Mo2O9 is shown in Fig. 6. The excitation spectrum shows a broad absorption band as well as line absorption. The broad absorption band (250 to 450 nm) is due to charge transfer from oxygen to molybdenum, whereas the line absorptions are due to the Eu3+ ion (4f–4f electronic transition). The width of the absorption band is extended from 350 to 450 nm, compared to that of the tungsten analogue and this clearly indicates that the band gap of tungstate is different from that of molybdate. The LMCT band position can be estimated using the empirical formula proposed by Reisfeld and Jørgensen:20| | Ect (cm−1) = [χopt(X) − χopt(M)] × 30![[thin space (1/6-em)]](https://www.rsc.org/images/entities/char_2009.gif) 000 cm−1 000 cm−1 | (1) |
where χopt(X) is the optical electronegativity of the anion, which is equal to the Pauling electronegativity value, 3.2; χopt(M) is the optical electronegativity of the central metal ion (Mo = 2.10121 and Eu = 1.74).22 From expression (1), the LMCT of O2−–Mo6+ is around ∼303 nm and the O2−–Eu3+ LMCT is at ∼228 nm. The calculation clearly indicates that the estimations agree well with the experimental results.
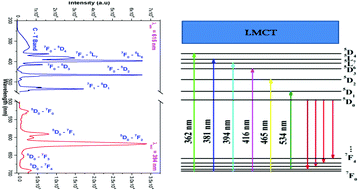 |
| | Fig. 5 PLE and PL spectra and the corresponding energy level diagram of La1.95Eu0.05W2O9. | |
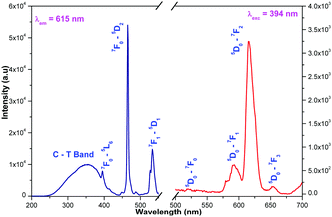 |
| | Fig. 6 PLE and PL spectra of La1.95Eu0.05Mo2O9. | |
The emission spectrum contains sharp lines at 615 nm and 592 nm which are due to 5D0–7F2 electric dipole (ED) and 5D0–7F1 magnetic dipole (MD) transitions of Eu3+ ion, respectively. However, no emission corresponding to any transition of molybdate is observed. The ED and MD emission wavelengths (due to 4f–4f transitions) are only moderately influenced by the crystal chemical environment of the lanthanide ions since the partially filled 4f shell is well shielded by the filled 5s and 5p orbitals. Nevertheless, it is possible to correlate the spectrum with the local site symmetry of the Eu site.
Luminescence of La1.95Eu0.05W2−xMoxO9 (x = 0–1.9, in steps of 0.1)
The photoluminescence excitation spectrum of La1.95Eu0.05W2−xMoxO9 (x = 0–2, in steps of 0.1) under excitation at 615 nm is shown in Fig. 7. The prominent broad absorption band ranging from ∼250–400 nm is attributed to an oxygen to metal (tungsten/molybdenum) charge transfer (LMCT) transition which is visualized in the corresponding spectrum. In other words, the observed LMCT band is due to an electronic transition from a valence band (primarily oxygen 2p non-bonding character) to a conduction band (arising from the π* interaction between the tungsten metal ion t2g orbital and oxygen). In general, in the Eu3+ substituted red phosphors, the LMCT band is stronger than that of the 4f–4f electronic transitions, because the former is a spin and parity allowed transition and the latter is a forbidden transition. However, in the tungstate/molybdate phosphors, the band intensity of the oxygen to europium charge transfer (LMCT) O2− to Eu3+ was relatively weak in the excitation spectrum, because the contribution of the O2− to M6+ (M = W/Mo) transition to the excitation was large. Hexavalent molybdenum and tungsten are interchangeable due to their almost identical ionic radii (Mo6+ = 0.41 Å or 0.59 Å and W6+ = 0.42 Å or 0.6 Å for coordination numbers 4 and 6, respectively).23 A shift in the LMCT band is observed from 360 to 430 nm, by successive replacement of tungsten by molybdenum in the host lattice, which can be explained based on the effective cation electronegativity and the covalency of the d orbitals. In general, a decrease in band gap is observed, by replacing the 5d ion (W6+) with the less electropositive and more covalent 4d ion (Mo6+).
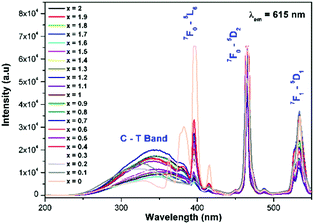 |
| | Fig. 7 The photoluminescence excitation spectrum of La1.95Eu0.05W2−xMoxO9 (x = 0–2, in steps of 0.1) under excitation at 615 nm. | |
In the present study, the highly electropositive and less covalent W6+ is replaced by Mo6+ (La1.95Eu0.05W2−xMoxO9) and the result shows that the absorption edge is shifted towards the near UV region (a decrease in band gap is observed). Similar observations have been made in perovskite and its related structures (for example Sr2CaMoO6 = 2.7 eV whereas Sr2CaWO6 = 3.6 eV).24 The charge transfer band of Eu3+–O2− is not clearly observed in the excitation spectra, this could be due to a possible overlap of the LMCT band with that of the tungstate or molybdate group.8b,22,25 In addition, characteristic Eu3+ excitation lines (5L6–7F0, 7F0–5D2 and 7F1–5D1) are also observed in the spectrum. However, the relative intensity of the LMCT band and the excitation lines of 7F0–5L6 and 7F1–5D1 decreased, whereas the intensity of the 7F0–5D2 line slightly increased. This can be explained based on the crystal structure of the host lattice. The presently studied composition crystallizes in a triclinic structure when x = 0, whereas when x = 0.3 it crystallizes in a cubic structure. So the observed results clearly indicate that the minor distortion in the host lattice crystal structure plays a vital role in determining the luminescence properties of these systems. Similar observations have been made in one of the present authors’ previous luminescence studies on AgGd0.95Eu0.05(WO4)2−x(MoO4)x (x = 0–2, in steps of 0.25)8a,b and AgLa0.95Eu0.05(WO4)2−x(MoO4)x (x = 0–2, in steps of 0.25).10a It is worth noting that the crystal structure of the phosphor is very important for determining luminescence properties. In the AgGd0.95Eu0.05(WO4)2−x(MoO4)x (x = 0–2) phosphor, it has been shown that in the excitation spectra the 394 nm absorption line is intense for tungstates (monoclinic), whereas for molybdates (tetragonal) the 465 nm absorption line is intense. In contrast, the 7F0–5D2 excitation line is found to be of much higher intensity compared to any other lines in the AgLa0.95Eu0.05(WO4)2−x(MoO4)x (x = 0–2, in steps of 0.25) solid solution and interestingly both tungstate and molybdate crystallize in a tetragonal structure. The photoluminescence emission spectrum of La1.95Eu0.05W2−xMoxO9 (x = 0–2, in steps of 0.1) is shown in Fig. 8. The spectrum contains sharp lines at 615 nm and 592 nm which are due to electric dipole (ED) and magnetic dipole (MD) transitions of the Eu3+ ion, respectively. However, no emission corresponding to the host lattice (tungstate or molybdate) is observed. This implies that there is energy transferred from the tungstate and molybdate host lattices to the Eu3+ activator ions. In the same way, there is energy migration in the host lattices, which competes against the energy transfer process. Red emission from Eu3+ is observed under charge transfer excitation, which clearly indicates the energy transfer from the tungstate or molybdate group to the Eu3+ levels. However, the relative PL intensity of Eu3+ is lower with CT band excitation when compared to that from Eu3+ excitation. In other words, the presence of an absorption band due to the tungstate or molybdate group in the excitation spectrum of Eu3+, when monitored for Eu3+ emission (615 nm), clearly suggests that the energy absorbed by the tungstate or molybdate group (Fig. 7) is transferred to the Eu3+ levels non-radiatively.8b This reveals that the energy transfer from the host lattice to Eu3+ is not competent. The variation of the electric dipole emission intensity of Eu3+vs. x value (increase of Mo concentration) is plotted in Fig. S1 (ESI†).
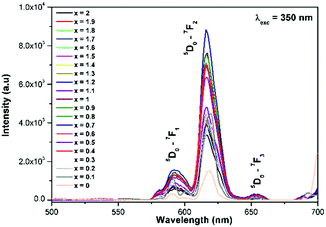 |
| | Fig. 8 The photoluminescence emission spectrum of La1.95Eu0.05W2−xMoxO9 (x = 0–2, in steps of 0.1) under excitation at 350 nm. | |
Generally the Eu3+ emission lines are hypersensitive, i.e., they are highly sensitive to the crystal chemical environment.26 Electric dipole transition is dominant when Eu3+ occupies a non-centrosymmetric site in the lattice.27 In the present study, the relative intensity of ED transition is found to be high. This clearly indicates that the Eu3+ ion occupies a non-centrosymmetric site in the presently studied compositions. All compositions show red emission under a CT band, at 394 nm (Fig. 9) and 465 nm (Fig. 10) excitation; however the relative emission intensity varies with composition.
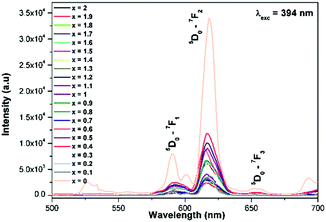 |
| | Fig. 9 The photoluminescence emission spectrum of La1.95Eu0.05W2−xMoxO9 (x = 0–2, in steps of 0.1) under excitation at 394 nm. | |
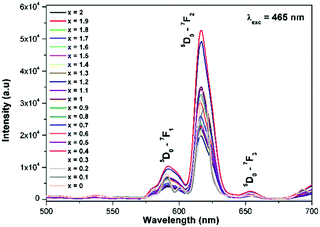 |
| | Fig. 10 The photoluminescence emission spectrum of La1.95Eu0.05W2−xMoxO9 (x = 0–2, in steps of 0.1) under excitation at 465 nm. | |
In the absence of a commercial narrow-band red emitter excitable at 465 nm, we have compared our phosphors with a UV excitable commercial narrow-band red emitter Y2O2S:Eu3+ (Nichia).8b,10a,b The emission is recorded under the same experimental measurement conditions. The intensities of the 5D0 → 7F2 emission lines of all of the compositions (Table ST1, ESI†) were compared with that of the Y2O2S:Eu3+ commercial red phosphor (Nichia) and the relative emission intensity of the La1.95Eu0.05W1.6Mo0.4O9 composition was found to be ∼4.92 times higher than that of the commercial one under 465 nm excitation. The CIE chromaticity coordinates (x, y) of the La1.95Eu0.05W1.6Mo0.4O9 compound are x = 0.6482 and y = 0.3495.
Luminescence of La2−yEuyW1.6Mo0.4O9 (y = 0–2, in steps of 0.2)
The excitation spectrum of La2−yEuyW1.6Mo0.4O9 (y = 0–2, in steps of 0.2) is shown in Fig. 11. The spectrum contains both a broad absorption band as well as line absorption. The former is due to the charge transfer absorption from oxygen to tungsten or molybdenum whereas the latter is due to characteristic absorption lines attributed to the Eu3+ ion (7F0–5L6, 7F0–5D2 and 7F1–5D1). The absorption intensity (charge transfer band and 7F0–5L6) is found to be at its maximum when y = 1.8, whereas the 7F0–5D2 and 7F0–5D1 transition shows its maximum intensity when y = 1.4 composition (as shown in Fig. 12). The emission spectrum of La2−yEuyW1.6Mo0.4O9 (y = 0–2, in steps of 0.2) is shown in Fig. 12. The spectrum contains sharp lines at 615 nm and 596 nm which are due to electric dipole (ED) and magnetic dipole (MD) transitions of the Eu3+ ion. All the compositions show red emission at around 615 nm, which is due to the 5D0–7F2 transition. Whatever the excitation value may be (350, 395 and 465 nm), red emission is observed; however the relative emission intensity is found to be different. The emission spectra of La2−yEuyW1.6Mo0.4O9 (y = 0–2, in steps of 0.2) under 395 and 465 nm excitation are shown in Fig. 13 and 14. The red emission intensity is found to be at its maximum when x = 1.8 under a CT band and 394 nm excitation, whereas x = 1.4 shows the maximum intensity under 465 nm excitation (similar to the excitation spectrum shown in Fig. 11). This indicates that the synthesized red phosphors have a high critical value of Eu3+ quenching concentration.
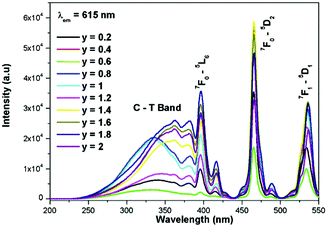 |
| | Fig. 11 The excitation spectra of La2−yEuyW1.6Mo0.4O9 (y = 0–2, in steps of 0.2). | |
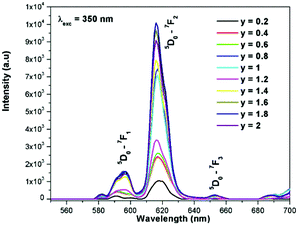 |
| | Fig. 12 The emission spectra of La2−yEuyW1.6Mo0.4O9 (y = 0–2, in steps of 0.2) under 350 nm excitation. | |
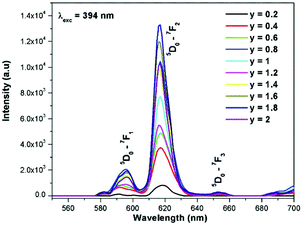 |
| | Fig. 13 The emission spectra of La2−yEuyW1.6Mo0.4O9 (y = 0–2, in steps of 0.2) under 394 nm excitation. | |
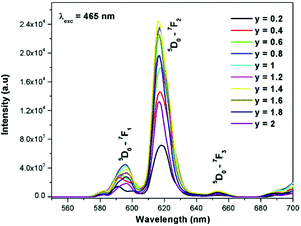 |
| | Fig. 14 The emission spectra of La2−yEuyW1.6Mo0.4O9 (y = 0–2, in steps of 0.2) under 465 nm excitation. | |
The various 4f–4f electronic transitions of Eu3+ emission intensity are highly dependent on the local environment of the europium ion. As mentioned earlier, the electric dipole transition is a hypersensitive transition. Therefore, it is possible to gain more insight into the change of the Eu3+ structural surroundings by calculating the ratio of integrated emission intensities of ED and MD transitions.28 The ratio between the ED and MD [(5D0/7F2)/(5D0/7F1)] is called the asymmetric ratio and gives a measure of the degree of distortion from the inversion symmetry of the local environment of the Eu3+ ion in the lattice.29 The asymmetry ratios as a function of Eu3+ concentration are shown in Fig. 15 (tabulated values available in the ESI,† ST1 and ST2). The asymmetry ratio increased from 5.4 to 7.0, when the Eu concentration increases from 0.2 to 2, in steps of 0.2.
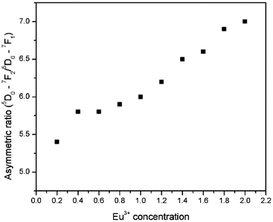 |
| | Fig. 15 The asymmetry ratios as a function of Eu3+ concentration (x = 0.2 to 2, in steps of 0.2). | |
In general, there are two types of energy transfer process which are expected and lead to concentration quenching; energy migration between the same ions (activator) to the killer sites (such as crystalline defects) and resonant or phonon-assisted cross-relaxations via matched energy levels between two adjacent centers in the host lattice.30a,b There are no matched energy levels available to quench the emissions from 5D0 level of Eu3+. Hence, the concentration quenching cannot be attributed to cross relaxation. As the concentration of Eu3+ (the luminescent centers) increases, the distance between the Eu3+ ions becomes small enough to allow a resonant energy transfer. The energy from one Eu3+ to another Eu3+ ion can easily be transferred and these energy-transfer chains trigger energy migration to crystalline defects. Therefore, beyond the optimum concentration of the activator ion (Eu3+), one can expect concentration quenching.
A rough estimate of the critical distance of energy transfer (Rc), the distance at which the probability of transfer is equal to the probability of radiative emission, can be calculated using the relation:31a,b
| |  | (2) |
where
xc is the critical concentration,
N is the number of host cations in the unit cell and
V is the volume of the unit cell (in this case 364.12 Å
3). Since a high emission intensity is observed for the
x = 1.4 concentration, this value is used as the critical concentration,
xc. Using the above
eqn (2), the critical distance is determined to be ∼6.21 Å, at which point the energy transfer among the adjacent ions becomes so significant that the radiative transitions become dominant over the non-radiative transitions.
A theoretical description was developed by Huang for the doping concentration vs. the luminescence intensity32 and this has been verified by many researchers by their experimental results.33a–c The luminescence intensity (I) vs. doping concentration (C) could be expressed by the following eqn (3) and (4) (according to Huang's description)
| |  | (3) |
| |  | (4) |
where
A and
X0 are constants, and
Γ(1 +
s/
d) is a
Γ function,
γ is the intrinsic transition probability of the sensitizer,
s is the index of electric multipole, for the electric dipole–dipole (D–D), electric dipole–quadrupole (D–Q), and electric quadrupole–quadrupole (Q–Q) interactions;
s = 6, 8 and 10, respectively. If
s = 3, the interaction type is an exchange interaction.
d is a dimension of the sample; here
d = 3, since the energy transfer between Eu
3+ ions inside the particles is considered. From the above equation one can derive the following
eqn (5)| |  | (5) |
In the above equation, f is independent of the doping concentration. Fig. 16 shows the log(I/C) vs. log(C) plot for the electric dipole transitions (5D0–7F2) of the Eu3+ ions in the Eu1.4La0.6W1.6Mo0.4O9 red phosphors. The experimental data was fitted using linear fittings and the slope parameter −s/d was obtained to be −0.66 which is close to 1 (corresponding to s = 3). The obtained slope parameter and its corresponding s value clearly indicate that the energy transfer among activator (Eu3+) ions occurs in the Eu1.4La0.6W1.6Mo0.4O9 phosphor through a dominant exchange interaction mechanism. The intensities of the 5D0 → 7F2 emission lines of all the compositions (Table ST2, ESI†) were compared with that of the Y2O2S:Eu3+ commercial red phosphor (Nichia) and the relative emission intensity of the La0.6Eu1.4W1.6Mo0.4O9 composition is found to be ∼8.24 times higher than that of the commercial one under 465 nm excitation.
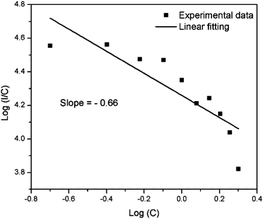 |
| | Fig. 16 The relationship between the doping concentration (Eu3+) (log![[thin space (1/6-em)]](https://www.rsc.org/images/entities/char_2009.gif) C) and log(I/C) for the 5D0–7F2 transition in Eu1.4La0.6W1.6Mo0.4O9. C) and log(I/C) for the 5D0–7F2 transition in Eu1.4La0.6W1.6Mo0.4O9. | |
Temperature dependent luminescence and thermal quenching
Thermal quenching is one of the most important parameters for phosphors used in white LEDs, because it has a great impact on the light output and CRI. The temperature-dependent photoluminescence properties were measured at temperatures in the range of 25–200 °C under 465 nm excitation and the results are shown in Fig. 17. The relative PL intensity vs. temperature plots of the Eu1.6La0.4W1.6Mo0.4O9 and CaS:Eu2+ phosphors are shown in Fig. 18. Temperature dependent photoluminescence studies reveal that the Eu1.4La0.6W1.6Mo0.4O9 composition loses 30% of its efficiency up to 400 K (compared to ∼80% for CaS:Eu2+) and the results demonstrate that the investigated phosphor has a relatively good thermal quenching effect. Although a decrease in the PL intensity of the phosphor was observed as the temperature rose, the position of the emission band did not shift, which indicates that the color coordinates of the phosphor are stable with increases in temperature. Indeed, there was little change in the CIE color coordinates of the phosphor while varying the temperature. The phenomenon of thermal quenching can be explained based on a configurational coordinate diagram (Fig. 19). The electron–phonon interaction is expected to be dominant in the high temperature environment. The luminescence center [Eu3+] in the excited state is activated by phonon communications initially, which are released through a crossover between the excited state [5D0] and ground state [7FJ (J = 1, 2, 3, 4)],34 as a result, the emission intensity decreases as the temperature increases. In order to elucidate the thermal quenching phenomena and to determine the activation energy for thermal quenching, the Arrhenius equation was fitted to the thermal quenching data of the red emitting LaEuMoWO9 phosphor and CaS:Eu2+ commercial phosphor as shown in Fig. 18.
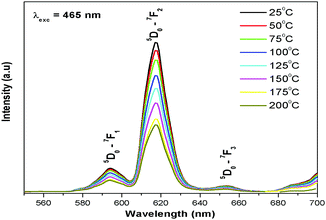 |
| | Fig. 17 Temperature dependent emission spectrum of Eu1.4La0.6W1.6Mo0.4O9 under 465 nm excitation. | |
 |
| | Fig. 18 Relative PL intensity vs. temperature and plots of ln[(I0/I) − 1] vs. 1/kT for the Eu1.4La0.6W1.6Mo0.4O9 and CaS:Eu2+ phosphors. | |
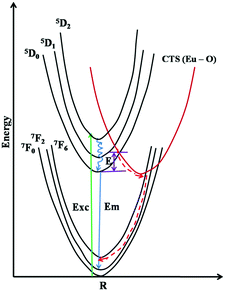 |
| | Fig. 19 A configurational diagram given to explain the crossover process. | |
According to the classical theory of thermal quenching, the temperature dependent luminescence intensity can be described by the following expression (eqn (6)), where I0 is the initial PL intensity, IT is the PL intensity at a given temperature T, A is a constant and k is Boltzmann's constant.35a–dFig. 18 shows the plot of ln[(I0/I) − 1] vs. 1/kT and gives straight line. The best fit was observed for the activation energies E = 0.27 and 0.33 eV for the LaEuMoWO9 phosphor and CaS:Eu2+ commercial phosphor, respectively.
| |  | (6) |
CIE color coordinates
The Commission International del'Eclairage (CIE) chromaticity coordinates of the synthesized phosphor and the corresponding emission intensity are tabulated in Tables ST1 and ST2, ESI.† The CIE chromaticity coordinates (x and y) of the optimized red phosphor, Eu1.6La0.4W1.6Mo0.4O9, are (0.67 and 0.33) and are very close to the NTSC (National Television System Committee) standard color coordinate values (0.67, 0.33). The CIE color coordinates of a commercial yellow phosphor (YAG:Ce3+) are also included with the synthesized red phosphor in Fig. 20. The CIE color coordinates of the currently synthesized phosphor show higher color saturation, which is better than that of the commercial Eu3+ doped oxysulfide phosphor (x = 0.64, y = 0.34). In addition, as evidenced by the excitation spectrum, the currently studied phosphor can absorb not only the emissions from LED based UV radiation but also blue LEDs. Hence it can be used to compensate for the red emission in the white LED based on the blue LED + YAG:Ce3+ phosphor or combined with the blue LED + green phosphor to create white light.
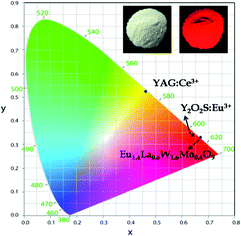 |
| | Fig. 20 CIE color coordinate diagram (inset shows the Eu1.4La0.6W1.6Mo0.4O9 phosphor in daylight and under 365 nm). | |
Comparative photoluminescence study of the Eu1.4La0.6W1.6Mo0.4O9 phosphor (solid state (SS) vs. co-precipitation (COP) technique)
In general, heating at high temperature and the wet reaction times are vital factors which affect crystallization and luminescence intensity. In case of the co-precipitation method with an increase of reaction time which involves nothing but stirring the reactants for a prolonged period, a promising phosphor with high intensity is acquired. In order to have a comparative study of the luminescence behaviour, two different methods were adopted to synthesise the Eu1.4La0.6W1.6Mo0.4O9 phosphors and PL studies were performed. The obtained results shows that there is a prominent increase in the luminescence intensity of the phosphor synthesized via the co-precipitation technique compared with the solid state one. The comparative excitation spectrum of Eu1.4La0.6W1.6Mo0.4O9 (prepared by SS versus COP) is shown in Fig. 21. The excitation spectrum shows both LMCT (due to M–O charge transfer band M = W/Mo) and Eu3+ f–f electronic transitions. However, the absorption strength is greater for the phosphor which is synthesized by the COP method, which clearly indicates that the synthesis technique plays a role in improving the absorption. Similarly the emission spectrum also shows an electric dipole transition which is due to the Eu3+ ion (Fig. 22 and 23). However the emission intensity varies and it is found to be higher for the phosphors that are synthesized by the COP method. We can clearly observe that the intensity has almost doubled. The reason behind this is due to the proper mixing of the starting materials at the molecular level when stirred for a long time (homogenous product formation). It is noted that the synthesis process for obtaining particles with a non-agglomerated shape as well as high crystallization plays an important role in the enhancement of luminescence efficiency. The calculated CIE color chromaticity values are well matched with NTSC standard values.
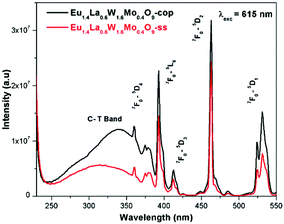 |
| | Fig. 21 The comparative excitation spectra of Eu1.4La0.6W1.6Mo0.4O9 under 615 nm excitation. | |
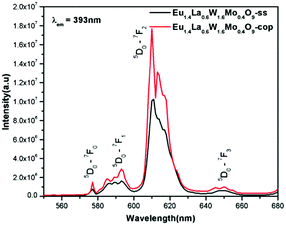 |
| | Fig. 22 The comparative emission spectra of Eu1.4La0.6W1.6Mo0.4O9 under 393 nm excitation. | |
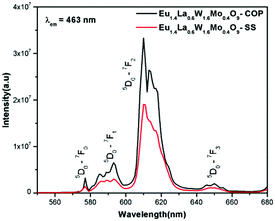 |
| | Fig. 23 The comparative emission spectra of Eu1.4La0.6W1.6Mo0.4O9 under 463 nm excitation. | |
Phonon sideband spectrum and calculation of the Huang–Rhys factor
Fig. 24a and b shows the phonon sideband spectrum (PSB) of Eu3+ activated La2M2O9 (M = W and Mo) under an emission wavelength of 616 nm (5D0–7F2). From the spectrum it is clearly shown that the PSB lies in the spectral range from 420 to 480 nm is linked with the 7F0–5D2 transition. The highest two peaks are around 427.4 nm and 449.6 nm (corresponding phonon energy of 1901 and 746 cm−1) for La2W2O9 and 427 and 447 nm (corresponding phonon energy of 1867 and 819 cm−1) for La2Mo2O9 were experiential. They are attributed to the symmetric vibration of O–M–O and asymmetric vibration of O–M where M = W and Mo respectively. Based on the above results it can be concluded that the presently studied host La2M2O9 has a higher phonon energy than other oxides. In addition, the Huang–Rhys factor can be calculated according to eqn (7).| |  | (7) |
where I1P and IZP are the integral intensity of the one-phonon line and zero-phonon line, respectively. S is the Huang–Rhys factor.
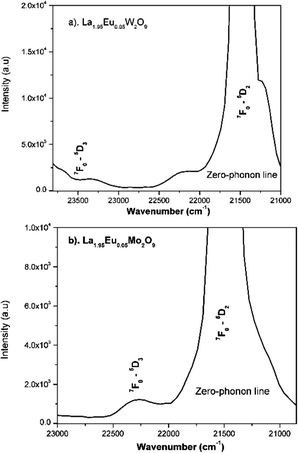 |
| | Fig. 24 (a and b) Phonon sideband spectrum of the La1.95Eu0.05M2O9 (M = W or Mo) phosphor monitoring the 5D0–7F2 emission at 616 nm excitation. | |
The transition selection rules state that, for the 7F0–5D2 transition, the zerophonon line is purely an electric dipole transition and the multiphonon sideband is located on the higher energy side of the zero-phonon line. Through this process a phonon can be produced and therefore p ≥ 0 in eqn (7). Raman scattering spectra of the sample have a similar spectral outline to the phonon sideband spectra, so IPSB = I1P. Furthermore, 〈1 + m〉 can also be approximately assumed as 1 because of the higher phonon energy at room temperature. According to the above statement, the derived Huang–Rhys factor can be rewritten as
where
IPSB is the integral intensity of the one-phonon line and
IZP is zero-phonon line. Based on
eqn (8), the calculated Huang–Rhys factor is found to be 0.031 and 0.023 for La
2W
2O
9 and La
2Mo
2O
9, respectively.
Judd–Ofelt parameters calculation
The effect of the chemical environment has a strong and phenomenal influence on the intensity of the Eu3+ ion. To study this change and the variation in intensity, the Judd–Ofelt theory is one best tools ever used.36a,b By using the photoluminescence emission spectra of the Eu3+ ion, it is easy to determine the Ωλ values where λ = 2, 4, 6. Calculation of the experimental intensity parameters Ωλ (J = 2 and 4) was done for the 5D0 →7F2 and 5D0 → 7F4 transitions by keeping 5D0 → 7F1 as a reference. The Ω6 intensity parameter could not be projected for the 5D0 → 7F6 transition, since this emission was not being observed due to instrumental limitations. The relation between the radiative emission rate and integrated emission intensity is given by| |  | (9) |
where I0–J is the area under the spectral curve and hϑ0–J is the energy corresponding to the 5D0 → 7FJ (J = 1, 2, 4) transition of Eu3+. The magnetic dipole radiative transition rate, A0–1, was taken to be 50 s−1. Hence the electric dipole transition probability can be obtained from the above relation. The forced electric dipole transitions 5D0 → 7F2 and 5D0 → 7F4 as a function of the Judd–Ofelt intensity parameter are formulated as| |  | (10) |
where ϑ is the Lorentz local field correction factor which is a function of the refractive index, n = 2.02, of the host and is given by the relation χ = n(n2 + 9)2/9. 〈5D0|UJ|7F2〉2 are the square reduced matrix elements, independent of the chemical environment of the Eu3+ ion. Values of the non zero square reduced matrix, 〈5D0|UJ|7F2〉2 = 0.0032 for the 5D0 → 7F2 transition and 〈5D0|UJ|7F4〉2 = 0.0023 for the 5D0 → 7F4 transition, were taken for the present calculations. The calculated Judd–Ofelt parameters were tabulated in Table 1. The uncertainty for this calculation is estimated to be around 5%. It is also noteworthy that in most of the molybdate/tungstate phosphors the Ω6 values are unknown due to the lack of 5D0–7F6 transition data; the Ω2 value changes greatly from host lattice to host lattice since Ω2 is very sensitive to the crystal field around the central metal ion (Eu3+).37
Table 1 Judd–Ofelt parameters for La2−yEuyW1.6Mo0.4O9 (y = 0–2, in steps of 0.2)
| Concentration of Eu3+ ion |
Judd–Ofelt intensity parameter Ω2 (10−20 cm2) |
A
0−1 in S−1 |
A
0−2
|
| 0.2 |
3.9241 |
50 |
381.286 |
| 0.4 |
3.3231 |
50 |
270.98 |
| 0.6 |
3.4176 |
50 |
278.970 |
| 0.8 |
3.0331 |
50 |
247.432 |
| 1 |
2.9551 |
50 |
241.020 |
| 1.2 |
3.6677 |
50 |
299.94 |
| 1.4 |
3.8306 |
50 |
314.095 |
| 1.6 |
3.9640 |
50 |
325.103 |
| 1.8 |
4.0926 |
50 |
334.689 |
| 2 |
4.1950 |
50 |
342.988 |
Conclusions
In summary, we have successfully synthesized the red emitting phosphors La1.95Eu0.05W2−xMoxO9 (x = 0–2, in steps of 0.1) and La2−yEuyW1.6Mo0.4O9 (y = 0–2, in steps of 0.2) and studied their optical properties. In La1.95Eu0.05W2−xMoxO9 (x = 0–2, in steps of 0.1), when x ≥ 0.2 it crystallizes in a triclinic structure, and upon further increasing x, the system undergoes a compositionally induced phase transition from a triclinic to cubic structure (x > 0.2). All the compositions of La1.95Eu0.05W2−xMoxO9 (x = 0–2, in steps of 0.1) and La2−yEuyW1.6Mo0.4O9 (y = 0–2 in steps of 0.2) show red emission under NUV or blue ray excitation. The relative emission intensity was found to be at its maximum when y = 0.3 and these were compared with a commercial red phosphor (showing an emission intensity ∼ 8.24 times higher than that of the commercial one) under blue ray excitation. In addition, the selected compositions which were prepared by the co-precipitation technique show a much better emission intensity (almost two times) than that of the phosphor synthesized by a solid state reaction. Calculation of the spectral parameters was done through Judd–Ofelt theory from the emission spectra. The phonon sideband was also observed in the systems La2W2O9 and La2Mo2O9 and this indicates that these phosphors have a higher phonon energy. Therefore, the newly developed red phosphors can combine with a yellow phosphor and a blue LED to generate warm white LEDs.
Acknowledgements
The authors thank NRB, DRDO for the financial support and Prof. Duk Young Jeon, Department of Materials Science and Engineering, Korea Advanced Institute of Science and Technology, Deajeon 305-701, Republic of Korea for the temperature dependent PL emission study. S. Kasturi acknowledges the DST for the research fellowship.
References
- The Promise of Solid State Lighting for General Illumination Light Emitting Diodes (LEDs) and Organic Light Emitting Diodes (OLEDs); Optoelectronics Industry Development Association, Washington, DC, http://www.netl.doe.gov/ssl/PDFs/oida_led-oled_rpt.pdf, 2010.
-
(a) C. C. Lin and R.-S. Liu, J. Phys. Chem. Lett., 2011, 2, 1268–1277 CrossRef CAS PubMed;
(b) P. F. Smet, A. B. Parmentier and D. Poelman, J. Electrochem. Soc., 2011, 158, R37–R54 CrossRef CAS.
-
G. Fasol and S. Nakamura, Laser Diode: GaN Based Blue Light Emitters and Lasers, Springer, Berlin, 1997 Search PubMed.
- S. Nakamura, T. Mukai and M. Senoh, J. Appl. Phys., 1994, 76, 8189–8191 CrossRef CAS.
- R. Muller-Mach and G. O. Mueller, IEEE J. Sel. Top. Quantum Electron., 2002, 8, 339–345 CrossRef.
-
A. M. Srivastava and H. A. Comanzo, U.S. Pat. 6 2002, 501100 Search PubMed.
- G. Blasse, Prog. Solid State Chem., 1968, 2, 79 Search PubMed.
-
(a) S. Neeraj, N. Kijima and A. K. Cheetham, Chem. Phys. Lett., 2004, 387, 2–6 CrossRef CAS;
(b) V. Sivakumar and U. V. Varadaraju, J. Electrochem. Soc., 2005, 152, H168–H171 CrossRef CAS.
-
(a) H. Zhu, C. C. Lin, W. Luo, S. Shu, Z. Liu, Y. Liu, J. Kong, E. Ma, Y. Cao, R. Liu and X. Chen, Nat. Commun., 2014, 5(4312), 1–10 Search PubMed;
(b) K. Uheda, N. Hirosaki, Y. Yamamoto, A. Naito, T. Nakajima and H. Yamamotoa, Electrochem. Solid-State Lett., 2006, 9, H22–H25 CrossRef CAS;
(c) X. Piao, K. Machida, T. Horikawa, H. Hanzawa, Y. Shimomura and N. Kijima, Chem. Mater., 2007, 19, 4592–4599 CrossRef CAS;
(d) S. T. Tan, X. W. Sun, H. V. Demir and S. P. DenBaars, IEEE Photonics J., 2012, 4, 613–619 CrossRef.
-
(a) V. Sivakumar and U. V. Varadaraju, J. Electrochem. Soc., 2006, 152, H54–H57 CrossRef;
(b) V. Sivakumar and U. V. Varadaraju, Electrochem. Solid-State Lett., 2006, 9, H35–H38 CrossRef CAS;
(c) V. Sivakumar and U. V. Varadaraju, J. Electrochem. Soc., 2007, 154, J28–J31 CrossRef CAS.
-
(a) V. A. Morozov, A. Bertha, K. W. Meert, S. Van Rompaey, D. Batuk, G. T. Martinez, S. Van Aert, P. F. Smet, M. V. Raskina, D. Poelman, A. M. Abakumov and J. Hadermann, Chem. Mater., 2013, 25, 4387–4395 CrossRef CAS;
(b) A. M. Abakumov, V. A. Morozov, A. A. Tsirlin, V. Johan and H. Joke, Inorg. Chem., 2014, 53, 9407–9415 CrossRef CAS PubMed;
(c) P. Shi, Z. Xia, M. S. Molokeev and V. V. Atuchin, Dalton Trans., 2014, 43, 9669–9676 RSC.
- S. Vaidyanathan and D. Y. Jeon, Int. J. Appl. Ceram. Technol., 2009, 6, 453–458 CrossRef CAS.
- J. K. Hana, J. I. Choia, A. Piquetteb, M. Hannahb, M. Ancb, M. Galvezb, J. B. Talbota and J. McKittricka, ECS J. Solid State Sci. Technol., 2013, 2, R3138–R3147 CrossRef.
- L.-T. Chen, I.-L. Shoon, C.-S. Hwang and S.-J. Chang, J. Lumin., 2006, 118, 293–300 CrossRef CAS.
- F. Yuan and H. Ryu, Mater. Sci. Eng., B, 2004, 107, 14–18 CrossRef.
- Y. Pan, M. Wu and Q. Su, Mater. Sci. Eng., B, 2004, 106, 251–256 CrossRef.
-
(a) Y. Tian, X. Qi, X. Wu, R. Hua and B. Chen, J. Phys. Chem. C, 2009, 113, 10767–10772 CrossRef CAS;
(b) Y. Tian, B. Chen, R. Hua, N. Yu, B. Liu, J. Sun, L. Cheng, H. Zhong, X. Li, J. Zhang, B. Tian and H. Zhong, CrystEngComm, 2012, 14, 1760–1769 RSC.
- Y. Laligant, A. Le Bail and F. Goutenoire, J. Solid State Chem., 2001, 159, 223–227 CrossRef CAS.
-
(a) R. A. Rocha and E. N. S. Muccillo, Chem. Mater., 2003, 15, 4268–4272 CrossRef CAS;
(b) F. Lei, B. Yan, H. H. Chen and J. T. Zhao, Inorg. Chem., 2009, 48, 7576–7584 CrossRef CAS PubMed;
(c) F. Lei and B. Yan, J. Solid State Chem., 2008, 181, 855–862 CrossRef CAS.
-
R. Reisfeld and C. K. Jørgensen, Lasers and Excited States of RareEarth[M], Springer, Berlin, 1977, p. 45 Search PubMed.
- V. Dimitrov and T. Komatsu, J. Solid State Chem., 2012, 196, 574–578 CrossRef CAS.
- X. L. Gao, Y. H. Wang, D. Wang and B. T. Liu, J. Lumin., 2009, 129, 840–843 CrossRef CAS.
- R. D. Shannon and C. T. Prewitt, Effective Ionic Radii in Oxides and Fluorides, Acta Crystallogr., Sect. B: Struct. Crystallogr. Cryst. Chem., 1969, 25, 925–945 CrossRef CAS.
- H. W. Eng, P. W. Barnes, B. M. Auer and P. M. Woodward, J. Solid State Chem., 2003, 175, 94–109 CrossRef CAS.
- K. W. Huang, W. T. Chen, C. I. Chu, S.-F. Hu, H. S. Sheu, B. M. Cheng, J. M. Chen and R.-S. Liu, Chem. Mater., 2012, 24, 2220–2227 CrossRef CAS.
- L. I. Katzin, Inorg. Chem., 1969, 8, 1649–1654 CrossRef CAS.
-
G. Blasse and B. C. Grabmaier, Luminescent Materials, Springer-Verlag, Berlin, 1994 Search PubMed.
- A. Dulda, D. S. Jo, L. S. PU, T. Masaki and D. H. Yoon, J. Ceram. Soc. Jpn., 2010, 118, 568–570 CrossRef CAS.
-
W. M. Yen, S. Shionoya and H. Yamamoto, Phosphor Handbook, CRC Press, Taylor and Francis, Boca Raton, 2007 Search PubMed.
-
(a) Y. C. Li, Y. H. Chang, Y. F. Lin, Y. J. Lin and Y. S. Chang, Appl. Phys. Lett., 2006, 89, 081110 CrossRef;
(b) Y. C. Li, Y. H. Chang, Y. F. Lin, Y. S. Chang and Y. J. Lin, Electrochem. Solid-State Lett., 2006, 9, H74–H77 CrossRef CAS.
-
(a) S. H. M. Poort, W. P. Blokpoel and G. Blasse, Chem. Mater., 1995, 7, 1547–1551 CrossRef CAS;
(b) G. Blasse, Philips Res. Rep., 1969, 24, 131–144 CAS.
- S. H. Huang and L. R. Lou, Chin. J. Lumin., 1990, 11, 1–7 Search PubMed.
-
(a) F. P. Ouyang and B. Tang, Rare Met. Mater. Eng., 2003, 32, 522–525 CAS;
(b) D. Li, S. Z. Lu, H. Y. Wang, B. J. Chen, J. H. E. S. L. Zhang and S. H. Huang, Chin. J. Lumin., 2001, 22, 227–231 CrossRef CAS;
(c) Q. Y. Meng, B. J. Chen, W. Xu, Y. M. Yang, X. X. Zhao, W. H. Di, S. Z. Lu, X. J. Wang, J. S. Sun, L. H. Cheng, T. Yu and Y. Peng, J. Appl. Phys., 2007, 102, 093505 CrossRef.
- G. Y. Lee, J. H. Han, W. B. Im, S. H. Cheong and D. Y. Jeon, Inorg. Chem., 2012, 51, 10688–10694 CrossRef CAS PubMed.
-
(a) S. Bhushan and M. V. Chukichev, J. Mater. Sci. Lett., 1988, 7, 319–321 CrossRef CAS;
(b) V. Bachmann, C. Ronda, O. Oeckler, W. Schinck and A. Meinjerick, Chem. Mater., 2009, 21, 316–325 CrossRef CAS;
(c) Z. Xia, X. Wang, Y. Wang, L. Liao and X. Jing, Inorg. Chem., 2011, 50, 10134–10142 CrossRef CAS PubMed;
(d) H. S. Jang, H. Kim, Y. S. Kim and D. K. Jeon, Opt. Express, 2012, 20, 2761–2771 CrossRef CAS PubMed.
-
(a) G. S. Oflet, J. Chem. Phys., 1962, 37, 511–520 CrossRef;
(b) B. R. Judd, Phys. Rev., 1962, 127, 750–761 CrossRef CAS.
- Y. Tian, B. Chen, R. Hua, J. Sun, L. Cheng, H. Zhong, X. Li, J. Zhang, Y. Zheng, T. Yu, L. Huang and H. Yu, J. Appl. Phys., 2011, 109, 053511 CrossRef.
Footnote |
| † Electronic supplementary information (ESI) available. See DOI: 10.1039/c6qm00118a |
|
| This journal is © the Partner Organisations 2017 |
Click here to see how this site uses Cookies. View our privacy policy here. ![[thin space (1/6-em)]](https://www.rsc.org/images/entities/char_2009.gif) :
:![[thin space (1/6-em)]](https://www.rsc.org/images/entities/char_2009.gif) 1). Then, the resultant solutions were dried and white powders of Eu(NO3)3·6H2O and La(NO3)3·6H2O were obtained. The white powders were dissolved in 10 ml of deionized water (labelled solution A), and MoO3 (99.99%, Sigma Aldrich) and WO3 (99.99%, Sigma Aldrich) were dissolved in liquid ammonia (labelled solution B). Solution A was slowly dropped into solution B under magnetic stirring, and subsequently a greenish white precipitate was formed. After reacting for 1 hour, the precursor solution was filtered and the resultant precipitate was washed several times with deionized water and acetone. Then the powder was dried under vacuum overnight and finally, the La0.6Eu1.4W1.6Mo0.4O9 red phosphor was obtained and calcined at 1000 °C for 2 h.
1). Then, the resultant solutions were dried and white powders of Eu(NO3)3·6H2O and La(NO3)3·6H2O were obtained. The white powders were dissolved in 10 ml of deionized water (labelled solution A), and MoO3 (99.99%, Sigma Aldrich) and WO3 (99.99%, Sigma Aldrich) were dissolved in liquid ammonia (labelled solution B). Solution A was slowly dropped into solution B under magnetic stirring, and subsequently a greenish white precipitate was formed. After reacting for 1 hour, the precursor solution was filtered and the resultant precipitate was washed several times with deionized water and acetone. Then the powder was dried under vacuum overnight and finally, the La0.6Eu1.4W1.6Mo0.4O9 red phosphor was obtained and calcined at 1000 °C for 2 h.

![[thin space (1/6-em)]](https://www.rsc.org/images/entities/char_2009.gif) :
:![[thin space (1/6-em)]](https://www.rsc.org/images/entities/char_2009.gif) 2.33.
2.33.


![[thin space (1/6-em)]](https://www.rsc.org/images/entities/char_2009.gif) 000 cm−1
000 cm−1


![[thin space (1/6-em)]](https://www.rsc.org/images/entities/char_2009.gif) C) and log(I/C) for the 5D0–7F2 transition in Eu1.4La0.6W1.6Mo0.4O9.
C) and log(I/C) for the 5D0–7F2 transition in Eu1.4La0.6W1.6Mo0.4O9.


