
An anthracenecarboximide fluorescent probe for in vitro and in vivo ratiometric imaging of endogenous alpha-L-fucosidase for hepatocellular carcinoma diagnosis†
Xianfeng
Hou
,
Jin
Peng
,
Fang
Zeng
*,
Changmin
Yu
and
Shuizhu
Wu
*
College of Materials Science & Engineering, State Key Lab of Luminescent Materials & Devices, South China University of Technology, Guangzhou 510640, P. R. China. E-mail: shzhwu@scut.edu.cn; mcfzeng@scut.edu.cn; Tel: +86 20 22236262
First published on 28th September 2016
Abstract
Alpha-L-fucosidase (AFU) plays vital roles in some physiological processes that closely relate to several diseases. Herein, a ratiometric fluorescent probe for the alpha-L-fucosidase (AFU) assay based on a single fluorophore has been developed by functionalizing a new fluorophore platform (6-bromo-anthracenecarboximide) with an α-L-fucose group. AFU cleaves the α-L-fucose group from the probe molecule and remarkably alters its photophysical properties, thus realizing ratiometric detection of AFU. Due to the specificity and high efficiency of the enzymatic reaction, this probe can sensitively and selectively detect AFU in aqueous media and biological milieus with a detection limit of 0.0033 U mL−1. Moreover, the probe can be employed to monitor and spatially map endogenous AFU levels in a hepatocellular carcinoma (HCC) model of zebrafish. Hence, the probe holds significant promise for conducting pathological research on AFU-involved diseases.
Introduction
Alpha-L-fucosidase (AFU), which is a lysosomal enzyme present in all mammalian cells at low concentrations, catalyzes the hydrolytic removal of L-fucose residues from glycoconjugates with an optimal activity between pH 4 and 6.5.1,2 AFU levels are closely related to several human diseases, such as fucosidosis3 and carcinoma.4,5 For instance, AFU has been found to be overexpressed in hepatocellular carcinoma (HCC),6 and has been a specific and sensitive indicator for early HCC diagnosis.7 A number of methods have been employed for detecting AFU.8–12 Among them, fluorescence sensing techniques offer distinct advantages including convenient operation, real-time assay, noninvasive monitoring capability and usability in live organisms.13–30 To date, only a few fluorescent probes for AFU have been reported.31–33 However, these probes all employ a single sensing signal (turn-on or turn-off mode), which may easily be interfered by many factors, such as excitation intensity, probe concentration and emission collection efficiency.34,35 In addition, a fluorescent probe, which can detect endogenous AFU in vivo, is still lacking. Hence, in an effort to overcome these shortcomings we aimed to develop a novel ratiometric fluorescent probe capable of in vivo detection of AFU. Ratiometric fluorescent probes based on the ratio of fluorescence intensities at two wavelengths, can minimize most of the above interfering factors.36,37 To achieve ratiometric fluorescent sensing, usually two fluorophores have to be incorporated simultaneously into the sensing system, which increases synthetic complexities. Compared to a two-fluorophore-based ratiometric fluorescent sensing system, a single-fluorophore-based ratiometric fluorescent probe is simple to prepare and easy to functionalize. As a typical representative, many probes based on 1,8-naphthalimide derivatives have received great attention.38,39 However, these probes possess relatively short excitation (usually in the UV range) and emission (blue or green) wavelengths, which are unfavourable for in vivo imaging and detection. Therefore, as for the development of single-fluorophore-based ratiometric fluorescent probes, those with relatively long excitation and emission wavelengths are much sought-after.We postulate that by extending the conjugation length of the aromatic donor part (e.g. by replacing the naphthalene ring with an anthracene ring), a single-fluorophore-based ratiometric fluorescent probe with long excitation and emission wavelengths could be obtained. To substantiate our idea, herein we demonstrate a new fluorophore platform (6-bromo-anthracenecarboximide) as a single-fluorophore ratiometric fluorescent probe with long analytical wavelengths. Similar to 1,8-naphthalimde derivatives, the photophysical properties of fluorophores based on l,2-anthracenecarboximide depend on the electron-donating capability of the substituent at the 6th position of the anthracene ring. Therefore, with different substituent groups at the 6th position, the adsorption and emission of l,2-anthracenecarboximide derivatives can be readily manipulated and hopefully be exploited in a variety of sensing applications. Herein a new fluorophore was designed to serve as a ratiometric fluorescent probe for AFU, as shown in Fig. 1A. The fluorescent probe is a l,2-anthracenecarboximide derivative with an α-L-fucose group at the 6-position; when the α-L-fucose group is cleaved by AFU, the substituent at the 6-position transforms into a hydroxy group, thus remarkably altering the probe's photophysical properties and achieving ratiometric detection for AFU. Based on a single fluorophore, this probe exhibits multiple advantages, such as low cytotoxicity, ratiometric sensing and facile preparation. It can image endogenous AFU in 293T cells, and can also be used for real-time tracking of overexpressed hepatic AFU levels in an HCC model of zebrafish. This approach provides a potentially strong new tool for detecting AFU, as well as further investigating the mechanism and functions of AFU.
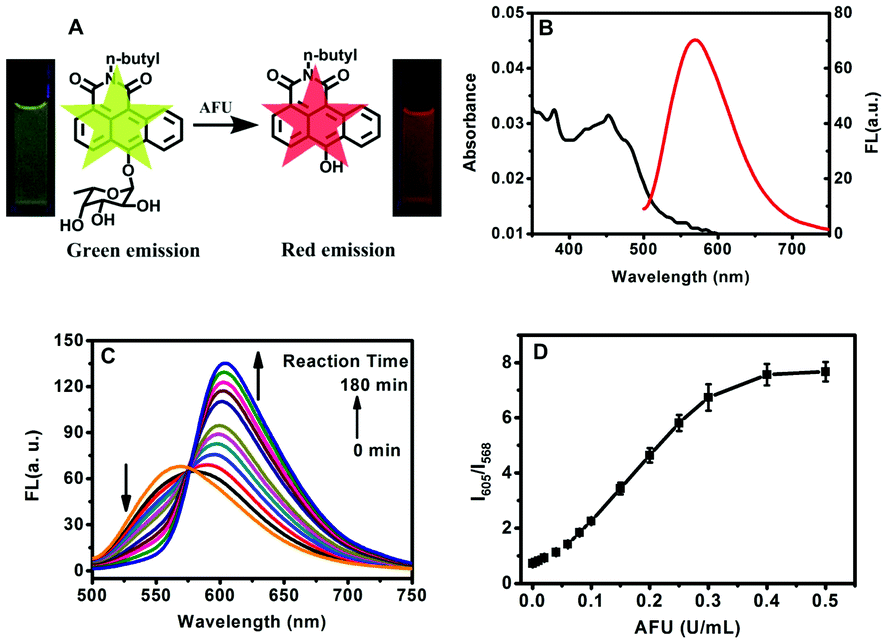 | ||
| Fig. 1 (A) Schematic illustration of the probe's structure and ratiometric response toward AFU; (B) UV-vis absorption (black curve) and fluorescence emission spectra (red curve) of the probe (10 μM) in PBS-buffered (pH 6.0) water; (C) time course of the fluorescence spectra for the probe (10 μM) upon the addition of 0.4 U mL−1 AFU; (D) intensity ratio as a function of AFU level. Fluorescence spectra were recorded in PBS buffered (pH 6.0, 10 mM) water at 37 °C with an excitation wavelength of 480 nm. | ||
Results and discussion
The synthetic route for the probe (compound 9) is shown in Scheme S1 (ESI†). Firstly, a new fluorophore platform, 6-bromo-l,2-anthracenecarboximide (compound 3), was synthesized. And then, to develop the ratiometric fluorescent probe for AFU, n-butylamine and an α-L-fucose group were incorporated in the N- and 6-positions of the fluorophore, respectively, whose photophysical properties strongly depend on the electron-donating capability of the substituent at the 6th position of the anthracene ring. The intermediate products and the probe were characterized using 1H/13C nuclear magnetic resonance spectroscopy (1H/13C NMR), Fourier transform infrared spectroscopy (FTIR) and mass spectrometry (MS) (Fig. S1–S18, ESI†). As displayed in Fig. 1B, the probe's aqueous solution shows an absorption band at around 460 nm and an emission band around 570 nm when excited at 460 nm. Upon cleavage of the α-L-fucose group, an absorption band centering around 550 nm emerges (Fig. S19, ESI†) with an emission band at 605 nm when excited at 480 nm (Fig. 1C). These results indicate that this probe is appropriate for working as a ratiometric sensing system for AFU detection. As shown in Fig. S20 (ESI†), the lifetime of the probe in aqueous solution (measured at 568 nm) was 9.69 ns. Using quinine sulfate (quantum yield = 54%) as a standard, the quantum yield of this probe was measured to be 25.5% at the excitation wavelength of 460 nm (Fig. S21, ESI†). In addition, the probe exhibits excellent emission stability in a wide pH range from 4.0 to 10.0 (Fig. S22, ESI†), which covers physiological conditions. It demonstrates that the ratiometric fluorescent probe holds great potential for applications in bio-systems.As shown in Fig. 1C, the fluorescence spectra of the probe were periodically recorded during incubation of the probe with AFU (0.4 U mL−1) at 37 °C in PBS buffered water (pH 6.0, 10 mM). In the absence of AFU, the probe solution displays emission centering at 568 nm. Upon reaction with AFU, a new emission peak at about 605 nm appears, meanwhile the emission centering at 568 nm decreases gradually. In addition, Fig. S19 (ESI†) shows a similar change in the UV-vis absorption spectra of the probe solution: with extension of reaction time, the absorption band centering around 460 nm decreases, while the band centering around 550 nm increases. The time course experiments show that the enzymatic reaction is almost completed in 180 minutes (Fig. S23A, ESI†). The fluorescence spectra of the probe incubated with different AFU concentrations for 180 min were also recorded (Fig. S23B, ESI†). A working curve was established by plotting the emission intensity ratio I605/I568versus AFU levels, as displayed in Fig. 1D. Moreover, in the lower AFU concentration range of 0–0.04 U mL−1, there is a good linear relationship between the I605/I568 value and the AFU level, and the detection limit was calculated to be 0.0033 U mL−1 (Fig. S24, ESI†).
The kinetics of the enzymatic hydrolysis reaction was determined, as shown in Fig. S25 (ESI†). The data for the enzyme kinetics follow the Michaelis–Menten equation v = Vmax[S]/(Km + [S]), and the kinetic parameters have been calculated: Vmax = 0.381 μM min−1 and Km = 186.824 μM. In addition, the selectivity of the probe was evaluated by measuring the fluorescence response of the probe solution in the presence of different biological substances. As Fig. S26A (ESI†) shows, only AFU induces a prominent enhancement of the I605/I568 value, other species (biologically relevant) do not have an obvious influence, which include ions (such as Na+, K+, Mg2+, Al3+, NO3−, CO32− and PO43−), small biological molecules (such as α-L-fucose, glucose, and cysteine) and protein enzymes (such as alkaline phosphatase, carboxylesterase, deacetylase and γ-glutamyltranspeptidase). The results of the interference experiment concerning these biologically relevant substances are shown in Fig. S26B (ESI†). It can be seen that, these substances do not interfere with the fluorescence response of the probe towards AFU. The probe herein can specifically respond towards AFU, because of the fact that AFU can specifically catalyze the cleavage of the α-L-fucose group. With good selectivity and anti-interference, the sensing system is potentially highly capable of detecting AFU in living cells and in vivo.
AFU is known to catalyze the hydrolysis reaction of various compounds containing an α-L-fucose group. To confirm the reaction mechanism between the probe molecule and AFU, the probe solution mixed with AFU at 37 °C for 2 hour was used for mass spectrometric measurements. As Fig. 2C shows, the peak at 484.4 m/z ([M + H2O]−) is quite weak, which corresponds to the probe molecule. While the product's peak at 317.0 m/z is dominant, which is the same as the compound N-(n-butyl)-6-hydroxy-anthracene carboximide. In addition, the fluorescence spectrum of the product (probe solution upon complete reaction) is consistent with that of the compound N-(n-butyl)-6-hydroxy-anthracene carboximide, and the UV-vis absorption spectra show a similar pattern (Fig. S27, ESI†). To further prove the reaction mechanism, we also obtained high performance liquid chromatography (HPLC) measurements for the compound N-(n-butyl)-6-hydroxy-anthracenecarboximide, the probe and the reaction probe solution, and the results are shown in Fig. 2B. It can be seen that the probe solution ((a) in Fig. 2B) shows a single peak at 2.23 min, which can be observed from the 460 nm channel, and for the methanol solution containing the compound N-(n-butyl)-6-hydroxy-anthracene carboximide only ((b) in Fig. 2B), a single peak at 0.89 min can be observed from both the 460 nm channel and the 550 nm channel (Fig. 2B and Fig. S28, ESI†). When the probe solution (c in Fig. 2B) is incubated with AFU at 37 °C for 1 hour, a peak at 0.89 min appears, corresponding to the compound N-(n-butyl)-6-hydroxy-anthracenecarboximide. With the extension in reaction time, the probe's peak at 2.23 min decreases gradually. Meanwhile, it can be observed from the 550 nm channel that the product peak at 0.89 min increases (Fig. S28, ESI†). These results indicate that AFU catalyzes the cleavage of the α-L-fucose group from the probe molecule, resulting in a change in the photophysical properties.
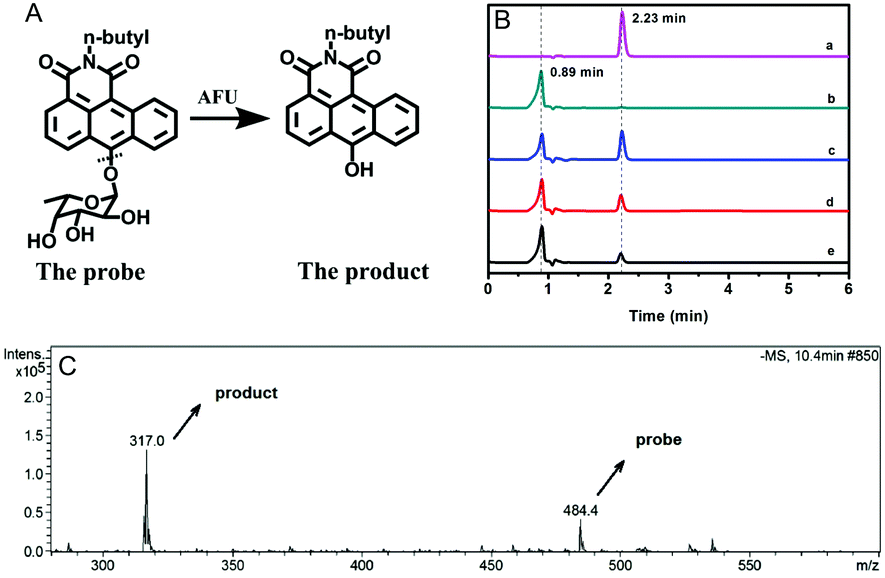 | ||
| Fig. 2 (A) Schematic illustration for the reaction mechanism between the probe molecule and AFU; (B) HPLC data for the probe (a), the compound N-(n-butyl)-6-hydroxy-anthracenecarboximide (b), and the reaction product solution after the reaction between the probe and AFU for 1 hour (c), 2 hours (d) and 3 hours (e) from the 460 nm channel. The mobile phase is methanol. (C) Mass spectrum of the reaction probe solution after the reaction between the probe and AFU for 2 hours. | ||
For intracellular imaging applications, we tested in vitro the cytotoxicity of the probe. The cytotoxicity of the probe was measured using an MTT assay with L929 and HeLa cell lines in accordance with ISO 10993-5, and the results are shown in Fig. S29 (ESI†). This probe shows little cytotoxicity. As such these results indicate that the probe is suitable for fluorescence imaging of AFU in live cells. And then we used the probe for AFU imaging in 293T cells, in which AFU is overexpressed. The imaging of endogenous AFU in the cells is shown in Fig. 3A. The green fluorescence in the probe-loaded 293T cells gradually decreases with incubation time. Meanwhile, the red fluorescence increases gradually, and a plateau emerges after about 2 hours (Fig. 3B). For comparison, we also applied the probe to cellular imaging in L929 cells that do not have overexpression of AFU. As shown in Fig. S30 (ESI†), the green fluorescence of the L929 cells loaded with the probe does not change in 3 hours and no red fluorescence can be observed. This is probably because, due to the lack of AFU in the L929 cells, the intracellular probes couldn't undergo an enzymatic reaction, and only green emission corresponding to the probe can be observed.
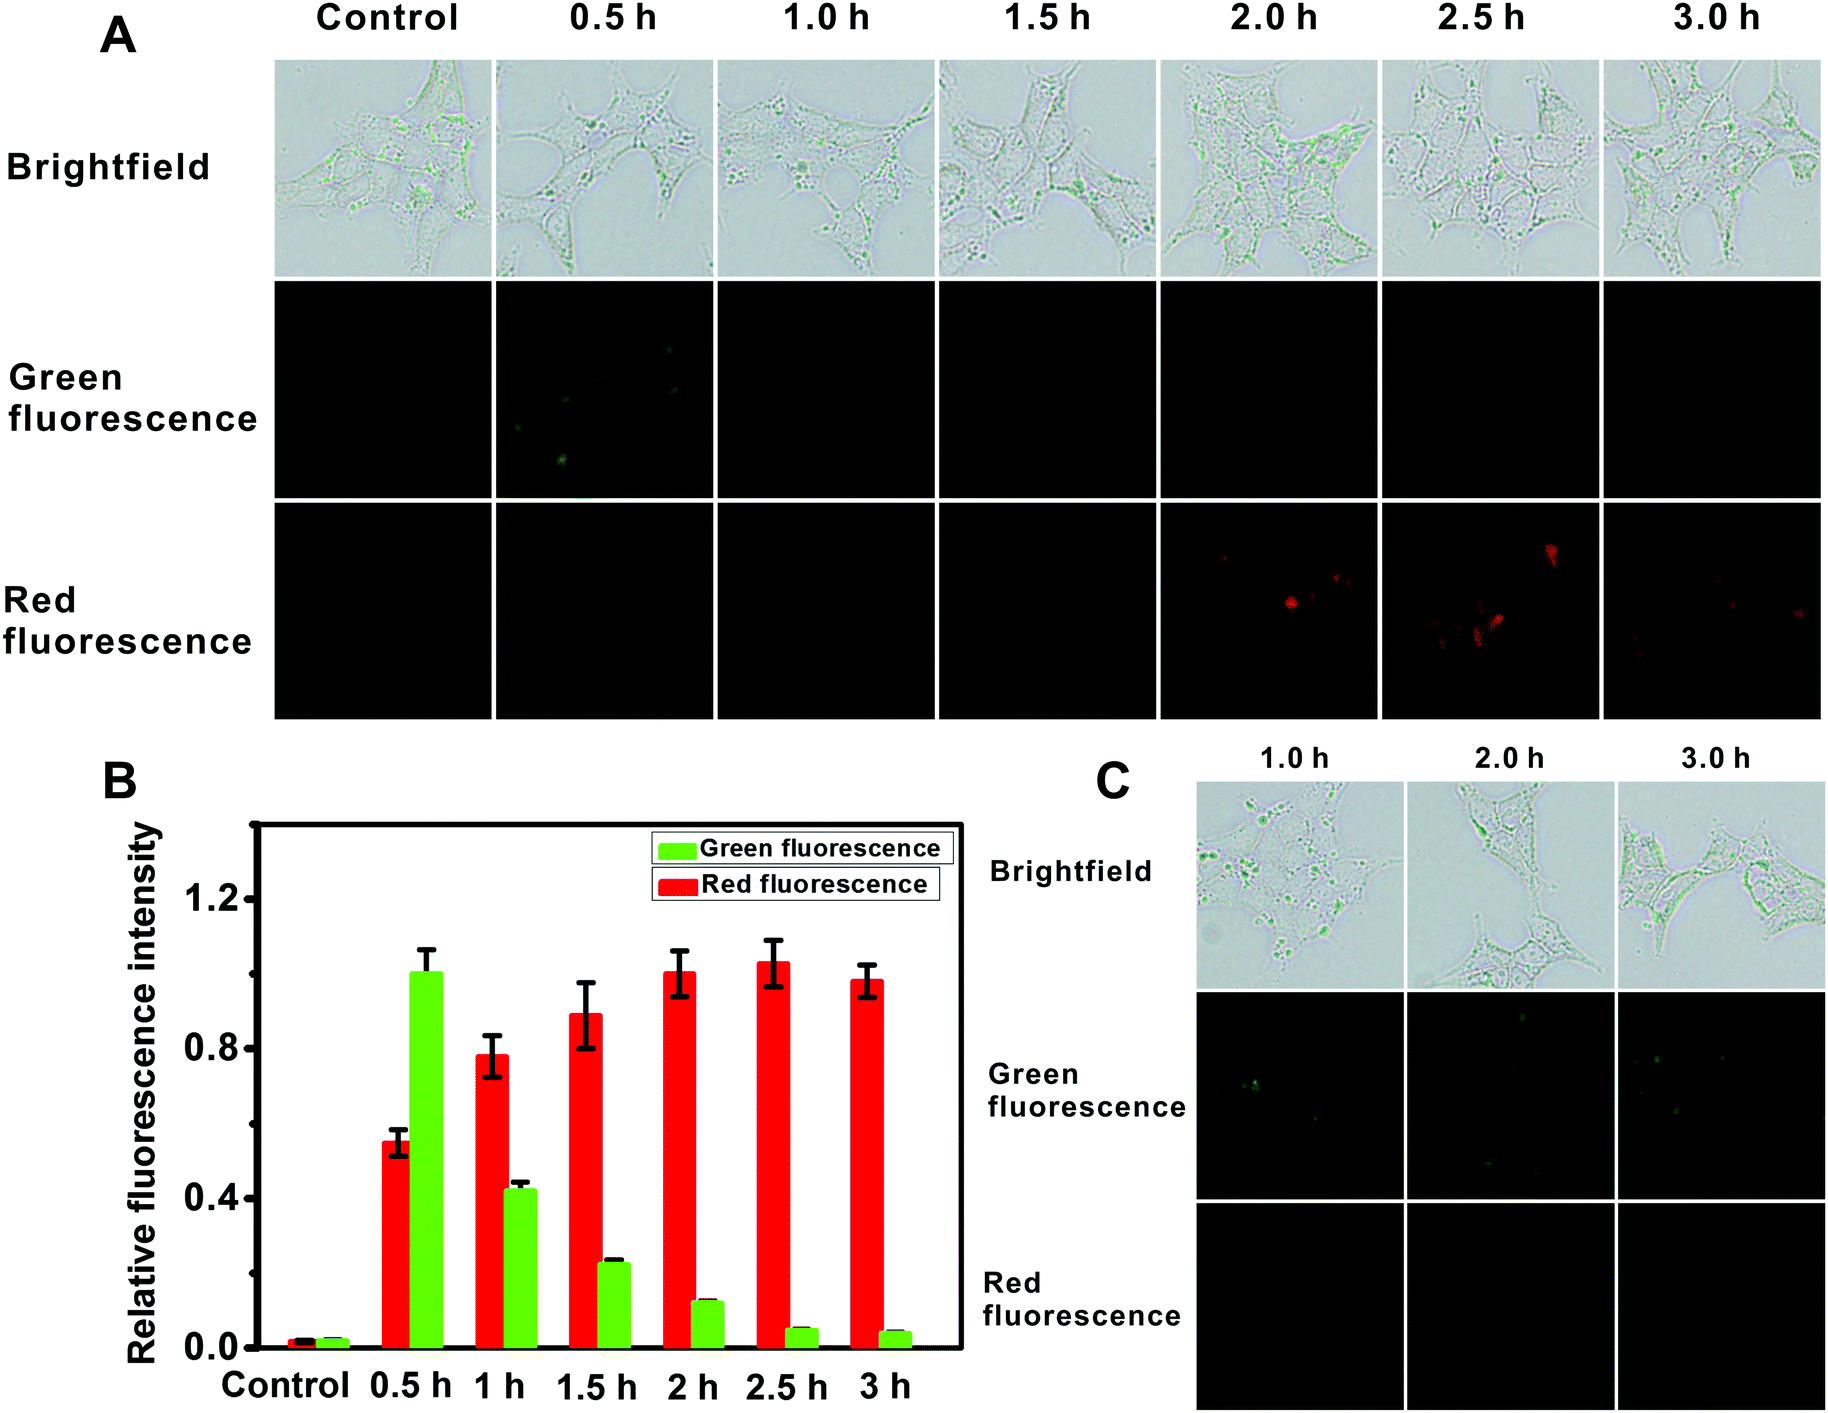 | ||
| Fig. 3 (A) Fluorescence microscopy images for the 293T cells treated with the probe (10 μM) for different time periods; (B) relative fluorescence intensity of the corresponding fluorescence images in panel A (the green fluorescence intensity from image of 0.5 h is defined as 1.0 and the red of 2.5 h as 1.0). The results are the mean ± standard deviation of three separate measurements. (C) 293T cells treated with the inhibitor deoxynojirimycin hydrochloride (5 μM) for 1 hour and then the probe (10 μM) for different time periods. | ||
For further demonstration, the 293T cells were pretreated with the AFU inhibitor deoxynojirimycin hydrochloride (5 μM) for 1 hour, and then incubated with the probe for different time periods. As shown in Fig. 3C, green fluorescence is obvious as always, while no red fluorescence emerges. The result suggests that fluorescence changes in the 293T cells are indeed triggered by AFU. The above results demonstrate that the probe has a strong potential to be a powerful tool for detecting endogenous AFU in live cells, which is important for clarifying the physiological roles of AFU.
AFU is a sensitive and selective indicator for early HCC diagnosis, and the AFU levels in liver tissue is of vital importance. First, the uptake of the probe by zebrafish larvae was observed. As shown in Fig. 4A, upon 1 hour of incubation with the probe, strong green fluorescence in the zebrafish liver can be observed. It indicates that the probe can be easily ingested by zebrafish from the water, and most of the probe molecules accumulate in the liver via metabolism. With an extended incubation time, the averaged green fluorescence intensity in the zebrafish liver first increases and then reaches a plateau when the incubation time reaches 1.0 h (Fig. 4B and Fig. S31, ESI†). To study the excretion of the probe in zebrafish, zebrafish pretreated with the probe were then incubated with E3 media containing 20 μM probe for 1 h, and then transferred into fresh E3 media for different time periods. It is obvious that the green fluorescence intensity decreases with increasing incubation time, and after 36 hours the green fluorescence becomes almost invisible (Fig. S32, ESI†). Fig. 4C shows that the averaged intensity of fluorescence in the zebrafish liver decreases and levels off after about 36 hours. These results indicate that the probe molecules are gradually excreted by the zebrafish with little long-term accumulation. In addition, the zebrafish larvae continued to live after probe treatment.
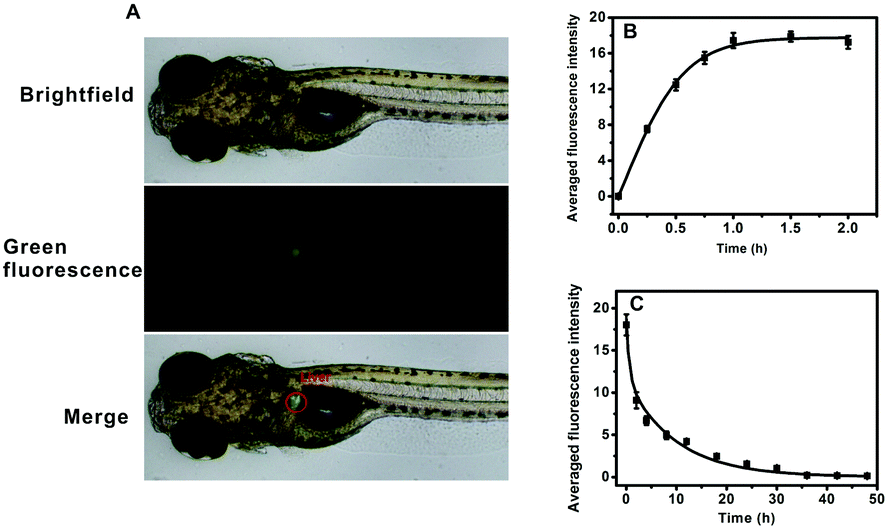 | ||
| Fig. 4 (A) Fluorescence microscopy images of zebrafish right after being incubated with the probe (20 μM) for 1.0 h at 28 °C. (B) Averaged green fluorescence intensity of the zebrafish liver right after being incubated with the probe (20 μM) for different time periods at 28 °C. (C) Averaged green fluorescence intensity of the zebrafish liver at different time periods upon being treated with the probe for 1 h and then incubated with E3 embryo media. Data were analysed using ImagePro software. | ||
To investigate the probe's capability of tracking AFU level variation in vivo, a zebrafish model of HCC was established according to literature reports.40 For in vivo imaging of AFU, DEN (diethylnitrosamine) can induce the formation of HCC in rodents and zebrafish,40 and we used it to induce formation of HCC in zebrafish. In HCC tissue, AFU has been found to be overexpressed, but in normal tissues it is present in very low levels.6,35 As shown in Fig. 5I, a zebrafish larva was treated with 200 μM of DEN for 12 d, and then incubated with the 20 μM probe for 1 h. The green fluorescence in its liver is weak (Fig. 5I(B)), which corresponds to the emission of this probe. Meanwhile, strong red fluorescence arises (Fig. 5I(C)), which corresponds to the emission of the enzymatic reaction product of this probe. The ratio of red fluorescence intensity to green fluorescence intensity was mapped, as shown in Fig. 5I(D) with a pseudo-color ratio image. It can be seen that in the HCC tissue, the AFU level of different positions is varied. Moreover, the fluorescence variation for zebrafish larvae upon being treated with DEN at different concentrations for different time periods is demonstrated in Fig. 5II (pseudo-color ratio images) and Fig. S33 (ESI†) (original fluorescence images). For the control sample (without treatment of DEN), only green fluorescence can be observed; while as the DEN concentration or incubation time is increased, the green fluorescence weakens gradually, which is concomitant with the increase in red fluorescence (Fig. S33, ESI†). In addition, the obvious increase in the ratio (Ired/Igreen) (Fig. 5II) with increasing incubation time or DEN concentration gives a clear indication that the AFU level elevates in the HCC tissue, which is a biomarker for HCC diagnosis. The above results suggest that the probe can detect AFU in vivo and it would be helpful for investigating the roles of AFU in related diseases, as well as the early diagnosis of hepatocellular carcinoma (HCC).
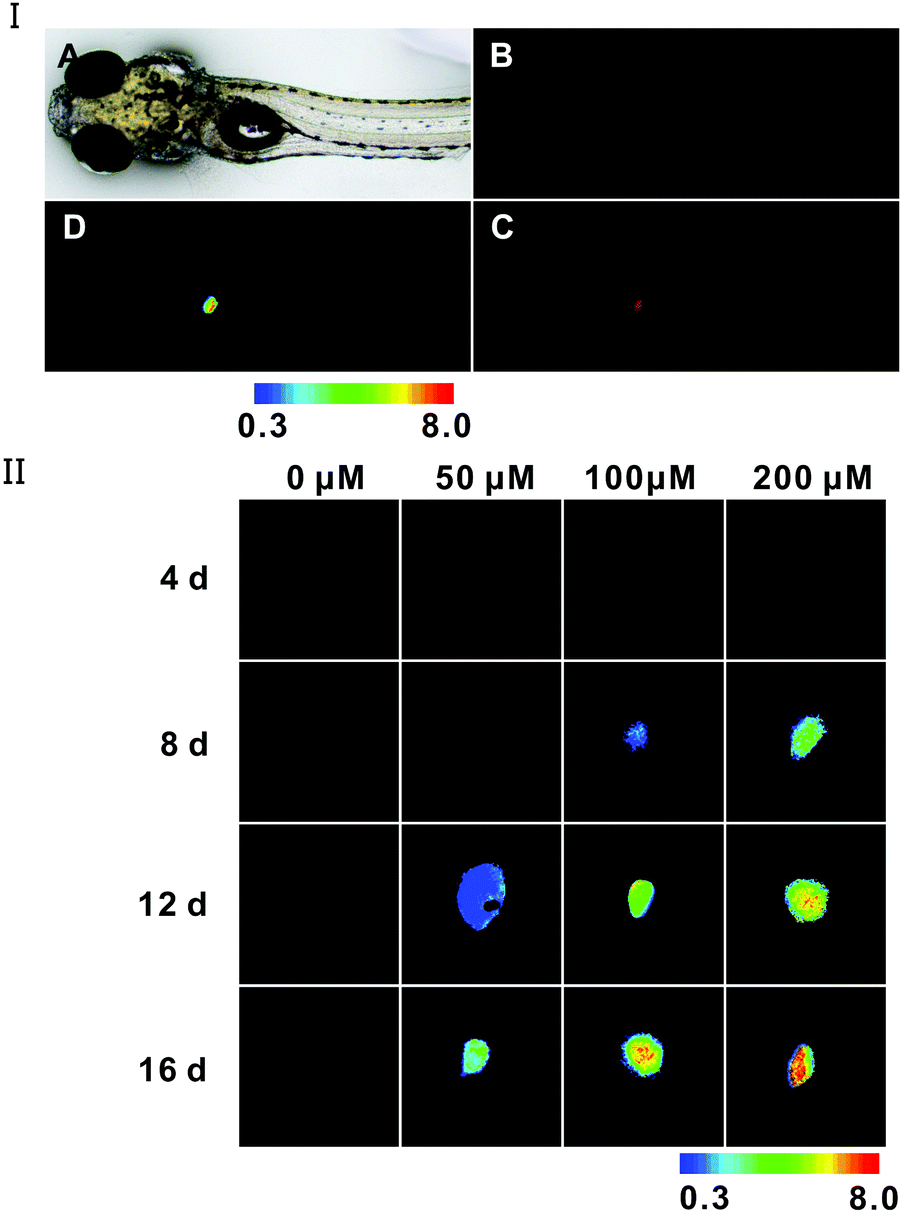 | ||
| Fig. 5 Imaging of the AFU level variation in the zebrafish model of HCC. (I) Fluorescence microscopy images of zebrafish treated with DEN for 12 d. (A) Bright field. (B) Fluorescence image collected from the green channel. (C) Fluorescence image collected from the red channel. (D) Pseudo-color images representing the fluorescence ratio (Ired/Igreen). (II) Pseudo-color images representing the fluorescence ratio (Ired/Igreen) for the liver of zebrafish larvae treated with different DEN concentrations for different time periods. | ||
Experimental section
Chemicals and materials
N,N-Dimethylethylenediamine, 9-bromoanthracene, α-L-fucose, DMAP, hydrogenbromide in acetic acid, acetic anhydride, oxalyl chloride, n-butylamine, oxone, diethylnitrosamine (DEN), sodium methylate, CuSO4·5H2O, HI aqueous solution, K2CO3, DMSO and MeOH were purchased from Aladdin Reagents. Alpha-L-fucosidase (AFU) was purchased from Sigma Aldrich. Deoxynojirimycin hydrochloride was purchased from J&K Scientific Ltd. The ethyl alcohol, ethyl acetate, methanol, dichloromethane, hexane, carbondisulfide (CS2), anhydrous sodium sulfate, AlC13, sodium chloride and sodium hydroxide reagents were of analytical grade. In the experiments, triple-distilled water was used which was further treated using ion exchange columns. Wild-type zebrafish were provided by Southern Medical University. All animal experiments were performed in full compliance with international ethics guidelines.![[thin space (1/6-em)]](https://www.rsc.org/images/entities/char_2009.gif) :hexane = 2:3 in v/v) to obtain compound 3 as a brown powder (0.46 g, 60%). 1H NMR (CDCl3, 600 MHz, ppm): 1.02 (t, J = 5.4 Hz, 3H), 1.50 (m, 2H), 1.78 (m, 2H), 4.24 (t, J = 6.0 Hz, 2H), 7.67 (t, J = 6.6 Hz, 1H), 7.74 (t, J = 6.6 Hz, 1H), 7.78 (t, J = 7.2 Hz, 1H), 8.61 (d, J = 7.2 Hz, 1H), 8.71 (d, J = 6.6 Hz, 1H), 8.80 (d, J = 7.2 Hz, 1H), 10.0 (d, J = 7.8 Hz, 1H). MS(ESI): m/z = 381.2 [M]−.
:dichloromethane = 1:10 in v/v) to obtain compound 4 as a yellow powder (0.32 g, 81%). 1H NMR (CDCl3, 600 MHz, ppm): 1.01 (t, J = 6.0 Hz, 3H), 1.51 (m, 2H), 1.78 (m, 2H), 4.25 (s, 3H), 4.29 (t, J = 6.0 Hz, 2H), 7.65 (t, J = 6.6 Hz, 1H), 7.76 (t, J = 7.2 Hz, 1H), 7.84 (t, J = 6.6 Hz, 1H), 8.45 (d, J = 7.2 Hz, 1H), 8.67 (d, J = 6.0 Hz, 1H), 8.77 (d, J = 6.6 Hz, 1H), 10.08 (d, J = 7.2 Hz, 1H). MS(ESI): m/z = 334.95 [M + H]+.
:dichloromethane = 1:10 in v/v) to obtain compound 5 as a red powder (0.19 g, 60%). 1H NMR (CDCl3, 600 MHz, ppm): 1.01 (t, J = 6.0 Hz, 3H), 1.50 (m, 2H), 1.79 (m, 2H), 4.27 (t, J = 4.8 Hz, 2H), 7.73 (t, J = 6.6 Hz, 1H), 7.80–7.85 (m, J = 5.2 Hz, 2H), 8.70 (d, J = 7.2 Hz, 1H), 8.80 (d, J = 6.0 Hz, 1H), 8.91 (d, J = 6.6 Hz, 1H), 10.09 (d, J = 7.2 Hz, 1H). MS(ESI): m/z = 317.0 [M − H]−.
:dichloromethane = 1:10 in v/v) to obtain compound 6 as white powder (1.42 g, 85%). 1H NMR (CDCl3, 600 MHz, ppm): 1.17 (d, J = 6.6 Hz, 3H), 2.01 (s, 3H), 2.02 (s, 3H), 2.15 (s, 3H), 2.19 (s, 3H), 4.28 (m, 1H), 5.31–5.38 (m, 3H), 6.34 (d, J = 3.0 Hz, 1H). MS(ESI): m/z = 332.95 [M]−.
:dichloromethane = 1:10 in v/v) to obtain compound 7 as a white powder (1.42 g, 85%). 1H NMR (CDCl3, 600 MHz, ppm): 1.21 (d, J = 6.6 Hz, 3H), 2.01 (s, 3H), 2.11 (s, 3H), 2.17 (s, 3H), 4.40 (m, 1H), 5.04 (m, 1H), 5.36 (m, 1H), 5.40 (m, 1H), 6.69 (d, J = 4.2 Hz, 1H). MS(ESI): m/z = 353.95 [M + H]+.
:dichloromethane = 1:20 in v/v) to obtain N-(n-butyl)-6-(2,3,4-tri-O-acetyl-β-L-fucose)-anthracenecarboximide.
:hexane = 2:3 in v/v) to obtain compound 3 as a brown powder (0.46 g, 60%). 1H NMR (CDCl3, 600 MHz, ppm): 1.02 (t, J = 5.4 Hz, 3H), 1.50 (m, 2H), 1.78 (m, 2H), 4.24 (t, J = 6.0 Hz, 2H), 7.67 (t, J = 6.6 Hz, 1H), 7.74 (t, J = 6.6 Hz, 1H), 7.78 (t, J = 7.2 Hz, 1H), 8.61 (d, J = 7.2 Hz, 1H), 8.71 (d, J = 6.6 Hz, 1H), 8.80 (d, J = 7.2 Hz, 1H), 10.0 (d, J = 7.8 Hz, 1H). MS(ESI): m/z = 381.2 [M]−.
:dichloromethane = 1:10 in v/v) to obtain compound 4 as a yellow powder (0.32 g, 81%). 1H NMR (CDCl3, 600 MHz, ppm): 1.01 (t, J = 6.0 Hz, 3H), 1.51 (m, 2H), 1.78 (m, 2H), 4.25 (s, 3H), 4.29 (t, J = 6.0 Hz, 2H), 7.65 (t, J = 6.6 Hz, 1H), 7.76 (t, J = 7.2 Hz, 1H), 7.84 (t, J = 6.6 Hz, 1H), 8.45 (d, J = 7.2 Hz, 1H), 8.67 (d, J = 6.0 Hz, 1H), 8.77 (d, J = 6.6 Hz, 1H), 10.08 (d, J = 7.2 Hz, 1H). MS(ESI): m/z = 334.95 [M + H]+.
:dichloromethane = 1:10 in v/v) to obtain compound 5 as a red powder (0.19 g, 60%). 1H NMR (CDCl3, 600 MHz, ppm): 1.01 (t, J = 6.0 Hz, 3H), 1.50 (m, 2H), 1.79 (m, 2H), 4.27 (t, J = 4.8 Hz, 2H), 7.73 (t, J = 6.6 Hz, 1H), 7.80–7.85 (m, J = 5.2 Hz, 2H), 8.70 (d, J = 7.2 Hz, 1H), 8.80 (d, J = 6.0 Hz, 1H), 8.91 (d, J = 6.6 Hz, 1H), 10.09 (d, J = 7.2 Hz, 1H). MS(ESI): m/z = 317.0 [M − H]−.
:dichloromethane = 1:10 in v/v) to obtain compound 6 as white powder (1.42 g, 85%). 1H NMR (CDCl3, 600 MHz, ppm): 1.17 (d, J = 6.6 Hz, 3H), 2.01 (s, 3H), 2.02 (s, 3H), 2.15 (s, 3H), 2.19 (s, 3H), 4.28 (m, 1H), 5.31–5.38 (m, 3H), 6.34 (d, J = 3.0 Hz, 1H). MS(ESI): m/z = 332.95 [M]−.
:dichloromethane = 1:10 in v/v) to obtain compound 7 as a white powder (1.42 g, 85%). 1H NMR (CDCl3, 600 MHz, ppm): 1.21 (d, J = 6.6 Hz, 3H), 2.01 (s, 3H), 2.11 (s, 3H), 2.17 (s, 3H), 4.40 (m, 1H), 5.04 (m, 1H), 5.36 (m, 1H), 5.40 (m, 1H), 6.69 (d, J = 4.2 Hz, 1H). MS(ESI): m/z = 353.95 [M + H]+.
:dichloromethane = 1:20 in v/v) to obtain N-(n-butyl)-6-(2,3,4-tri-O-acetyl-β-L-fucose)-anthracenecarboximide.
Then 4 mL of anhydrous DMSO was added dropwise into a mixture of the above product (0.29 g, 0.5 mmol), 3 Å molecular sieve (trace amount), and K2CO3 (0.69 g, 5 mmol), and stirred for 48 h at room temperature under a nitrogen atmosphere. Subsequently, the reaction mixture was diluted with 50 mL of CHCl3, and washed with 5% NaHCO3, 5% citric acid and brine, respectively. After the removal of the solvent, the residue was purified using a silica gel column (ethyl acetate:dichloromethane = 1:10 in v/v) to obtain compound 8 as a light yellow solid (0.14 g, 38%). 1H NMR (CDCl3, 600 MHz, ppm): 1.02 (m, 6H), 1.49 (m, 2H), 1.78 (m, 2H), 2.01 (m, 3H), 2.13–2.25 (m, 6H), 4.27 (t, J = 6.0 Hz, 2H), 5.14–5.37 (m, 4H), 5.84 (m, 1H), 7.64 (t, J = 6.6 Hz, 1H), 7.73 (t, J = 6.0 Hz, 1H), 7.82 (t, J = 6.6 Hz, 1H), 8.55–8.94 (m, 3H), 10.07 (d, J = 7.8 Hz, 1H). MS(ESI): m/z = 634.7 [M + HCOO]−.
:dichloromethane = 1:10 in v/v) to obtain the product as a light yellow solid (0.07 g, 61%). 1H NMR (CDCl3, 600 MHz, ppm): 0.96 (m, 6H), 1.99 (m, 4H), 3.97 (m, 1H), 4.15 (t, J = 6.6 Hz, 2H), 4.25 (m, 1H), 5.30–5.36 (m, 2H), 5.62 (d, J = 6.0 Hz, 1H), 7.76–7.83 (m, 1H), 7.89–7.97 (m, 2H), 8.49–8.60 (m, 1H), 8.70 (d, J = 6.0 Hz, 1H), 8.75–8.84 (m, 1H), 9.99 (d, J = 7.2 Hz, 1H). 13C NMR (CDCl3, 600 MHz, ppm): 14.0, 23.0, 23.8, 28.9, 38.8, 68.2, 71.2, 71.5, 72.2, 109.7, 118.3, 118.6, 128.8, 129.8, 129.9, 130.9, 132.5, 167.8, 175.7. IR: 3396, 3190, 2923, 2851, 1731, 1647, 1468, 1274, 1123, 1073 cm−1. MS(ESI): m/z = 484.5 [M + H2O]−.
Instrumentation
1H NMR spectra were obtained using a Bruker Avance III HD 600 MHz NMR spectrometer. Mass spectra were recorded on a Bruker Esquire HCT Plus mass spectrometer. UV-vis spectra were measured using a Hitachi U-3010 UV-vis spectrophotometer. Fluorescence spectra were recorded using a Hitachi F-4600 fluorescence spectrophotometer. HPLC data were acquired from an Agilent 1260 Infinity liquid chromatograph (Diode Array Detector). Fluorescence lifetime measurements were obtained using an Edinburgh Instrument FLS920 fluorescence spectrometer. Fluorescence images were obtained using an Olympus IX 71 with a DP72 color CCD.Cell viability assay
In the experiment, L929 cells (murine aneuploidfibrosarcoma cell) and HeLa cells (human cervical cancer cell) were used to examine the toxicity of the probe. The two cell lines were incubated in DMEM medium (with 10% fetal bovine serum) for 24 h at 37 °C with 5% CO2. And then the former medium was discarded; the cells were treated with media containing different probe concentrations and incubated for 24 h. According to ISO 10993-5, an MTT assay was used to evaluate the cytotoxicity of the probe against the two cell lines. In the tests, the assays of each independent experiment were performed in eight replicates. And the statistical mean and standard deviation were used to estimate the cell viability.Cell incubation and imaging
Two cell lines, HEK-293T (human embryonic kidney 293T cell) and L929 (murine aneuploidfibrosarcoma cell) cells, were incubated in DMEM medium supplemented with 10% fetal bovine serum at 37 °C with 5% CO2. Before imaging, the cells were put in glass culture dishes and allowed to grow to 50–70% confluence. And then the former medium was discarded, the cells were treated with the DMEM medium containing the probe for different time periods. Some 293T cells were incubated in DMEM medium containing deoxynojirimycin hydrochloride (the AFU inhibitor) for 1 h, and then treated with medium containing the probe for different time periods. The control samples were incubated in DMEM medium only. Before imaging, the culture dishes were washed with 10 mM PBS three times, and images were obtained using an Olympus IX71 fluorescence microscope.Zebrafish imaging
Zebrafish were maintained under suitable conditions (pH 7.5, 28 °C), and fed with paramecium aqueous solution. To evaluate the uptake, distribution and excretion of the probes in zebrafish, 5 day-old zebrafish larvae were incubated with 5 mL of E3 media (15 mM NaCl, 0.5 mM KCl, 1 mM MgSO4, 1 mM CaCl2, 0.15 mM KH2PO4, 0.05 mM Na2HPO4, 0.7 mM NaHCO3; pH 7.5) containing 20 μM of the probe for different time periods (for uptake) and for 1 h (for excretion); then the media was replaced with fresh E3 media twice an hour. The larvae were incubated for varied time periods at 28 °C. Before imaging, the zebrafish were transferred into a 96-well microplate, the media solution was removed and zebrafish were washed three times with E3 media.For the tracking of endogenous hepatic AFU, a HCC model of zebrafish was used. 5 day-old larvae were incubated in a 6-well microplate with different concentrations of DEN. The larvae were continuously treated with DEN solution for different time periods, respectively, and fed with paramecium aqueous solution once a day. Before being transferred into E3 media containing a 20 μM probe, the fish were washed three times with E3 media to remove the remaining DEN. After 1 h, the fish were washed three times with E3 media to remove the remaining probe, and then imaged using an Olympus IX71 fluorescence microscope.
Conclusions
In summary, we have successfully developed a robust fluorescent ratiometric probe based on a new fluorophore, which shows long absorption (550 nm) and emission (605 nm). This probe can sensitively and selectively detect AFU in aqueous media and biological milieus. The reaction mechanism confirmed that AFU catalyzes the cleavage of the α-L-fucose group of the probe molecule. Furthermore, the probe can be applied in live cells and in vivo. The probe used here is the first ratiometric fluorescent probe shown to image AFU in vivo. Moreover, the probe can be employed to detect and spatially map the endogenous AFU level elevation in a HCC model of zebrafish. This strategy may provide an effective approach for in vivo tracking of AFU, which is of great importance for pathological analysis.Acknowledgements
We gratefully acknowledge the financial support by the Science and Technology Planning Project of Guangzhou (Project No. 201607020015), NSFC (21474031, 21574044 and 51673066), the National Key Basic Research Program of China (Project No. 2013CB834702), the Natural Science Foundation of Guangdong Province (2016A030312002) and the Fundamental Research Funds for the Central Universities (2015ZY013).Notes and references
- G. Sulzenbacher, C. Bignon, T. Nishimura, C. A. Tarling, S. G. Withers, B. Henrissat and Y. Bourne, J. Biol. Chem., 2004, 279, 13119–13128 CrossRef CAS PubMed.
- O. J. Cordero, A. Merino, M. P. dela Cadena, B. Bugía, M. Nogueira, J. E. Viñuela, V. S. Martínez-Zorzano, A. deCarlos and F. J. Rodríguez-Berrocal, Eur. J. Biochem., 2001, 268, 3321–3331 CrossRef CAS PubMed.
- B. G. Winchester, Subcell. Biochem., 1996, 27, 191–238 CAS.
- H. Abdel-Aleem, A. Ahmed, A. M. Sabra, M. Zakhari, M. Soliman and H. Hamed, Int. J. Gynecol. Obstet., 1996, 55, 273–279 CrossRef CAS PubMed.
- T. F. Scanlin and M. C. Glick, Biochim. Biophys. Acta, Mol. Basis Dis., 1999, 1455, 241–253 CrossRef CAS.
- E. Waidely, A.-R. O. Al-Yuobi, A. S. Bashammakh, M. S. El-Shahawi and R. M. Leblanc, Analyst, 2016, 141, 36–44 RSC.
- Y. Deugnier, V. David and P. Brissot, J. Hepatol., 1984, 4, 889–892 CrossRef CAS; S. W. Johnson and J. A. Alhadeff, Comp. Biochem. Physiol., Part B: Biochem. Mol. Biol., 1991, 99, 479–488 CrossRef.
- C. Piga, P. P. Urgeghe, G. Piredda, M. F. Scintu and G. Sanna, Food Anal. Methods, 2010, 3, 17–21 CrossRef.
- M. S. Attia, A. M. Othman, M. M. Aboaly and M. S. A. Abdel-Mottaleb, Anal. Chem., 2010, 82, 6230–6236 CrossRef CAS PubMed.
- S. Blumbeig, J. Hildesheim, J. Yariv and K. Wilson, J. Biochim. Biophys. Acta, 1972, 264, 171–176 CrossRef.
- A. M. Othman, M. E. El-Houseini, M. S. El-Sofy and H. Y. Aboul-Enein, Anal. Bioanal. Chem., 2011, 400, 787–795 CrossRef CAS PubMed.
- Z. Chen, X. Ren, X. Meng, Y. Zhang, D. Chen and F. Tang, Anal. Chem., 2012, 84, 4077–4082 CrossRef CAS PubMed.
- D. Ding, K. Li, B. Liu and B. Z. Tang, Acc. Chem. Res., 2013, 46, 2441–2453 CrossRef CAS PubMed; J. Yang, J. Huang, N. Sun, Q. Peng, Q. Li, D. Ma and Z. Li, Chem. – Eur. J., 2015, 21, 6862–6868 CrossRef PubMed.
- Y. Gao, G. Feng, T. Jiang, C. Goh, L. Ng, B. Liu, B. Li, L. Yang, J. Hua and H. Tian, Adv. Funct. Mater., 2015, 25, 2857–2866 CrossRef CAS; X. Sun, Q. Xu, G. Kim, S. E. Flower, J. P. Lowe, J. S. Fossey, X. Qian, S. D. Bull and T. D. James, Chem. Sci., 2014, 5, 3368–3373 RSC.
- X. Wang, J. Hu, G. Zhang and S. Liu, J. Am. Chem. Soc., 2014, 136, 9890–9893 CrossRef CAS PubMed; K. Zheng, W. Lin, L. Tan, H. Chen and H. Cui, Chem. Sci., 2014, 5, 3439–3448 RSC.
- S. Chen, Y. Hong, Y. Liu, J. Liu, C. W. T. Leung, M. Li, R. T. K. Kwok, R. T. K. Zhao, J. W. Y. Lam, Y. Yu and B. Z. Tang, J. Am. Chem. Soc., 2013, 135, 4926–4929 CrossRef CAS PubMed; L. Zong, Y. Song, Q. Li and Z. Li, Sens. Actuators, B, 2016, 226, 239–244 CrossRef.
- Y. Hang, J. Wang, T. Jiang, N. Lu and J. Hua, Anal. Chem., 2016, 88, 1696–1703 CrossRef CAS PubMed; X. Hou, Q. Yu, Q. Zeng, C. Yu and S. Wu, Chem. Commun., 2014, 50, 3417–3420 RSC.
- W. Zhang, Y. Chen, T. Shao and L.-J. Fan, J. Mater. Chem. B, 2014, 2, 5249–5255 RSC; X.-D. Wang, O. S. Wolfbeis and R. J. Meier, Chem. Soc. Rev., 2013, 42, 7834–7869 RSC.
- A. Barba-Bon, A. M. Costero, S. Gil, M. Parra, J. Soto, R. Martinez-Manez and F. Sancenon, Chem. Commun., 2012, 48, 3000–3002 RSC; T. Kim, H. Kim, Y. Choi and Y. Kim, Chem. Commun., 2011, 47, 9825–9827 RSC.
- F. Todescato, A. Antognoli, A. Meneghello, E. Cretaio, R. Signorini and R. Bozio, Biosens. Bioelectron., 2014, 57, 125–132 CrossRef CAS PubMed.
- L. E. Santos-Figueroa, M. E. Moragues, E. Climent, A. Agostini, R. Martinez-Manez and F. Sancenon, Chem. Soc. Rev., 2013, 42, 3489–3613 RSC.
- A. Barba-Bon, A. M. Costero, S. Gil, A. Harriman and F. Sancenon, Chem. – Eur. J., 2014, 20, 6339–9347 CrossRef CAS PubMed.
- A. Minotto, F. Todescato, I. Fortunati, R. Signorini, J. J. Jasieniak and R. Bozio, J. Phys. Chem. C, 2014, 118, 24117–24126 CAS.
- M. Hirai and F. P. Gabbai, Chem. Sci., 2014, 5, 1886–1893 RSC.
- J. K. G. Karlsson and A. Harriman, J. Phys. Chem. A, 2016, 120, 2537–2546 CrossRef CAS PubMed.
- B. C. Dickinson, V. S. Lin and C. J. Chang, Nat. Protoc., 2013, 8, 1249–1259 CrossRef PubMed.
- F. Hu, Y. Huang, G. Zhang, R. Zhao, H. Yang and D. Zhang, Anal. Chem., 2014, 86, 7987–7995 CrossRef CAS PubMed; X. Dong, F. Hu, Z. Liu, G. Zhang and D. Zhang, Chem. Commun., 2015, 51, 3892–3895 RSC; H. Zhang, J. Fan, J. Wang, B. Dou, F. Zhou, J. Cao, J. Qu, Z. Cao, W. Zhao and X. Peng, J. Am. Chem. Soc., 2013, 135, 17469–17475 CrossRef PubMed.
- F. Du, Y. Min, F. Zeng, C. Yu and S. Wu, Small, 2014, 10, 964–972 CrossRef CAS PubMed.
- M. Kamiya, Y. Urano, N. Ebata, M. Yamamoto, J. Kosuge and T. Nagano, Angew. Chem., Int. Ed., 2005, 44, 5439–5441 CrossRef CAS PubMed.
- H. N. Kim, W. X. Ren, J. S. Kim and J. Yoon, Chem. Soc. Rev., 2012, 41, 3210–3244 RSC; D. Buccella, J. A. Horowitz and S. J. Lippard, J. Am. Chem. Soc., 2011, 133, 4101–4114 CrossRef CAS PubMed.
- X. Ren, Z. Chen, X. Meng, D. Chen and F. Tang, Chem. Commun., 2012, 48, 9504–9506 RSC.
- M. S. El-Shahawia, A. M. Othman, M. E. El-Houseini, B. Nashed and M. S. Elsofy, Talanta, 2009, 80, 19–23 CrossRef PubMed.
- M. S. Attia, A. M. Othman, M. M. Aboaly and M. S. A. Abdel-Mottaleb, Anal. Chem., 2010, 82, 6230–6236 CrossRef CAS PubMed.
- Q. Chen, N. Bian, C. Cao, X. L. Qiu, A. D. Qi and B. H. Han, Chem. Commun., 2010, 46, 4067–4069 RSC.
- H. Gong, G. Little, M. Gradduck, D. R. Draney, N. Padhye and D. M. Olive, Talanta, 2011, 84, 941–946 CrossRef CAS PubMed.
- J. Hu, X. Zhang, D. Wang, X. Hu, T. Liu, G. Zhang and S. Liu, J. Mater. Chem., 2011, 21, 19030–19038 RSC.
- C. Yu, X. Li, F. Zeng, F. Zheng and S. Wu, Chem. Commun., 2013, 49, 403–405 RSC.
- L. Zhang, D. Duan, Y. Liu, C. Ge, X. Cui, J. Sun and J. Fang, J. Am. Chem. Soc., 2014, 136, 226–233 CrossRef CAS PubMed.
- D.-T. Shi, D. Zhou, Y. Zang, J. Li, G.-R. Chen, T. D. James, X.-P. He and H. Tian, Chem. Commun., 2015, 51, 3653–3655 RSC.
- I. Mizgirev and S. Revskoy, Nat. Protoc., 2010, 5, 383–394 CrossRef CAS PubMed; I. V. Mizgirev and S. Y. Revskoy, Cancer Res., 2006, 66, 3120–3125 CrossRef PubMed.
Footnote |
| † Electronic supplementary information (ESI) available: A synthetic scheme, 1H NMR spectra, mass spectra, absorption spectra, fluorescence decay curves, quantum yields, pH effect on stability, fluorescence intensity versus reaction time and concentration, detection limit, selectivity and anti-interference, HPLC data, cytotoxicity, fluorescence microscopy images and comparison of the probe with other reported ones. See DOI: 10.1039/c6qm00112b |
| This journal is © the Partner Organisations 2017 |