Facile fabrication of ternary nanocomposites with selective dispersion of multi-walled carbon nanotubes to access multi-stimuli-responsive shape-memory effects†
Man-Jie
He
,
Wen-Xia
Xiao
,
Hui
Xie
,
Cheng-Jie
Fan
,
Lan
Du
,
Xiao-Ying
Deng
,
Ke-Ke
Yang
* and
Yu-Zhong
Wang
*
Center for Degradable and Flame-Retardant Polymeric Materials (ERCEPM-MoE), National Engineering Laboratory of Eco-Friendly Polymeric Materials (Sichuan), State Key Laboratory of Polymer Materials Engineering, Sichuan University, Chengdu, Sichuan 610064, China. E-mail: kkyangscu@126.com; yzwang@scu.edu.cn; Fax: +86-28-85410755; Tel: +86-28-85410755
First published on 15th August 2016
Abstract
How to realize the multi-stimuli-response of shape-memory polymers in a simple system is a big challenge for researchers. In this study, a facile approach to produce a series of ternary nanocomposites made of a poly(butylene succinate)–poly(ε-caprolactone) (PBSPCL) multiblock copolymer matrix and multi-walled carbon nanotubes (MWCNTs) is described. MWCNTs were easily introduced into the double-crystalline copolymer matrix using solution mixing and solvent casting processes, successively. As a consequence of the immiscibility between these two polymeric segments, the spontaneous selective dispersion of MWCNTs is realized in the matrix with refined microphase separation morphology. The different affinity of MWCNTs for the PBS or PCL segment drove the MWCNTs to be localized in the PBS domain preferentially, as demonstrated by TEM analysis. This elaborate design leads to a significant reduction of percolation thresholds with the optimized composition of the nanocomposites. Moreover, the selective dispersion of MWCNTs in the hard PBS segment improved the strength of the material without deteriorating its ductility. Dynamic thermomechanical tests revealed that the PBSPCL copolymers exhibit an excellent dual-shape memory effect, as attested by the fix ratio (Rf) and recovery ratio (Rr) of 98%. After incorporation of MWCNTs into the matrix, the electro- and NIR-induced shape-memory effects have been realized, and the sample containing 40% PBS segment and 1 wt% MWCNTs exhibits optimal structure and performance.
Introduction
Shape-memory polymer (SMP) materials can be deformed into predefined temporary shapes and recover their permanent (initial) shape upon exposure to appropriate external stimuli,1–5 such as heat,6–19 cold,20 and light,21–25 and chemo-responsive stimuli such as moisture26 and solvent.27 Due to their unique nature, SMPs could find a large range of potential applications, including deployable structures, morphing structures, biomedical devices, actuators, sensors and others.27–32Among the various stimuli used to trigger the shape-memory effect (SME), thermal actuation has been extensively applied due to its easy tailoring and programming. Besides the direct thermo-inducement,6–11 SMPs can be now indirectly triggered by electricity,12–15 infrared (IR) absorption,16–18 and magnetic field,19via joule/inductive heating effects. This indirect heating provides an innovative approach to fulfil the growing requirement in the case where direct heating cannot be realized, such as actuators, self-deployable aerospace structures, and implanted biomedical devices. Among them, conductive nanocomposites have been attracting increasing attention due to their convenient manipulation and wide range of applications over the past few decades.15–17,33–40 Various conductive fillers, including carbon black (CB),33 carbon nanofibers (CNFs),34 carbon nanotubes (CNTs),15 graphene oxide (GO),35 metallic powders,36etc., have been successfully introduced into SMP matrices to realize the remote control and improve their mechanical properties and recovery stress and rate. Herein, carbon conductive fillers such as CNTs12,22 and GO41 have been highly appreciated by researchers. Indeed the electrical conductivity, strength and thermal stability of SMPs are improved, and in addition, the fillers can also absorb the near-infrared (NIR) light and then transform it into thermal energy to access multi-responsive shape-memory effects.
It is worth mentioning that the dispersion state of the conductive fillers in the polymer matrix plays an important role in its properties such as conductivity and mechanical performance. It has been proved that the uniform dispersion is not the best way to achieve the lowest percolation threshold of conductive fillers. Recent reports revealed that adding conductive fillers like multi-walled carbon nanotubes (MWCNTs) into immiscible polymer blends allowed the formation of selective dispersion morphology, such as localization into the interphase or the continuous phase,42–46 which highly depended on the interfacial energy, affinity of conductive fillers for each polymer, viscosity of the two polymers as well as the mixing mode.
Multiblock copolymers have been identified as typically mature systems in the design of dual-shape materials.6,47,48 If the polymer pairs are immiscible, they would exhibit a much refined microphase separation structure than their corresponding binary blends, which leads to a better SME. Inspired by the approach of incorporating conductive fillers into immiscible polymer blends showing a selective location and a low percolation threshold, we attempt to mix MWCNTs into an immiscible multiblock copolymer to realize a multi-responsive shape-memory effect with low filler loading by selective dispersion. Here, a double-crystalline poly(butylene succinate)–poly(ε-caprolactone) (PBSPCL) multiblock copolymer was chosen as the matrix, due to the following reasons: (1) the two segments have a strong crystallization tendency, allowing them to serve as a fixing phase and a reversible phase; (2) the immiscibility49 of the two segments with different affinity for MWCNTs makes it possible to achieve a selective dispersion structure in the matrix; (3) the theoretical prediction of MWCNTs preferring to localize in the hard PBS segment may ensure the enhancement of the strength of the material without deteriorating its ductility. In the present work, a series of PBSPCL/MWCNT nanocomposites with different compositions were prepared. The morphology, conductivity, thermal behaviours and mechanical performance of the nanocomposites are described. Finally, the thermo-, electro- and NIR-induced shape-memory effects of these materials have been realized successfully.
Experimental section
Materials
ε-Caprolactone (ε-CL) was purchased from Alfa Aesar (UK), dried over CaH2 and distilled under reduced pressure before use. 1,4-Butanediol (BD, AR grade) and succinic acid (SA, AR grade) were supplied by Kelong Reagent Corp. (Chengdu, China) and used without any further purification. Tetrabutyl ortho-titanate (TBOT, AR grade) and chloroform (CH3Cl, AR grade) were supplied by Kelong Reagent Corp. (Chengdu, China). They were refluxed and dehydrated by phosphorus pentoxide for 24 h and distilled before use. Stannous octoate (SnOct2, AR grade) (≥95%) was bought from Sigma-Aldrich Corporation (USA) and used without any further purification. Before use, SnOct2 and TBOT were diluted with dry toluene and stored in a glass volumetric flask under argon. 1,6-Hexamethylene diisocyanate (HDI, AR grade) was purchased from Sinopharm Chemical Reagent Co. Multi-walled carbon nanotubes (MWCNTs, NC7000) were supplied by Nanocyl, Belgium.Synthesis of PBS-diol
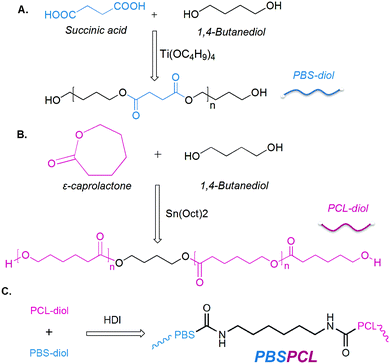
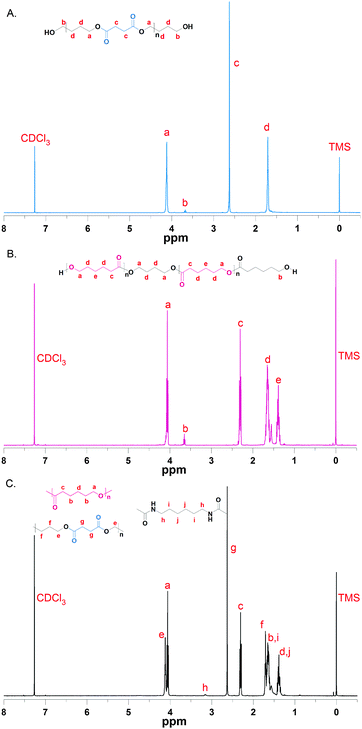
PBS-diol precursors were synthesized by a two-step esterification and successive polycondensation reactions (Scheme 1A). First of all, the esterification of BD (108 g, 1.2 mol) with SA (118 g, 1.0 mol) was carried out in an oil bath at 180 °C in the presence of TBOT as the catalyst in a 500 mL three-necked flask fitted with a Dean–Stark water separator, a mechanical stirrer, and an inlet of dry nitrogen until the theoretical amount of water was separated to give the PBS-diol oligomer. Then the temperature was increased to 220 °C to maintain polycondensation for 30 to 60 min in the reaction system and the pressure was gradually dropped to 40–70 Pa to obtain PBS-diol, which was characterized by the 1H-NMR spectrum.PBS-diol precursors: 1H-NMR (400 MHz, CDCl3, δ): 1.67 (δHd, m, –CH2–CH2–CH2–O–CO–), 2.63 (δHc, t, –CH2–CH2–CO–), 3.68 (δHb, t, –CH2–CH2–OH), 4.07 (δHa, t, –CH2–CH2–O–CO–).
Synthesis of PCL-diol
PCL-diol precursors were prepared by the typical bulk ring-opening polymerization (ROP) of ε-CL using BD as an initiator and SnOct2 as a catalyst (Scheme 1B). In detail, the ε-CL (168 g, 1.5 mol) was poured into a 150 mL flame-dried round-bottom flask, which was evacuated and purged with nitrogen three times. Then, the flask was immersed into an oil bath at 120 °C. BD (3.20 g, 0.0356 mol) was injected into the flask via a syringe with vigorous stirring for about 10 min. Afterward, SnOct2 (0.90 mL, 0.0005 mol) was added into the mixture kept under stirring for 24 h under nitrogen. The crude product was purified by precipitation of a chloroform solution in cold ether or methanol and dried in a 40 °C vacuum oven for 24 h to give the PCL-diol, which was characterized by the 1H-NMR spectrum.PCL-diol precursors: 1H-NMR (400 MHz, CDCl3, δ): 1.37 (δHe, m, –CH2–CH2–CH2–CH2–CH2–), 1.50–1.80 (δHd, m, –O–CH2–CH2–CH2–CH2–O–), 2.30 (δHc, t, –CH2–CH2–CO–), 3.50–3.70 (δHb, t, –CH2–CH2–OH), 4.06 (δHa, t, –CH2–CH2–O–).
Synthesis of PBSPCL multiblock copolymers
The multiblock copolymers were prepared by coupling PBS and PCL diol with HDI (Scheme 1C) in bulk under a nitrogen atmosphere, and the molar ratio of diisocyanate/polyester-diols was fixed at 1.05/1. For a typical sample, PBS-diol (14 g) and PCL-diol (6 g) were charged into a 100 mL reactor and immersed in a silicone oil bath at 150 °C with the protection of a nitrogen atmosphere. After the polyester-diols were completely molten, HDI (0.75 g) was added to the reactor by dripping with vigorous mechanical stirring maintained for 1 h to complete the chain-extension reaction. All the products were purified by reprecipitation with methanol from the chloroform solutions, dried for 12 h at 30 °C and then were transferred to the vacuum drying oven for 1 day to remove the residual solvent before the measurements of 1H-NMR and GPC. The feed compositions of homopolymers and copolymers are shown in Table 1. All copolymers and homopolymers were named PBSxaPCLyb, where the subscripts ‘x’ and ‘y’ stand for the molecular weight of PBS-diol and PCL-diol, and the subscripts ‘a’ and ‘b’ denote the weight fractions of PBS-diol and PCL-diol, respectively. The extended products with only one component were designated as PBSx and PCLy, respectively.| Sample | f (wt%) | F (wt%) | M n (×104) | M w (×104) | PDIc | ||||
|---|---|---|---|---|---|---|---|---|---|
| f PBS | f PCL | f HDI | F PBS | F PCL | F HDI | (g mol−1) | (g mol−1) | ||
| a Weight fraction in feed ratio. b Weight fraction in the resulting multiblock PBSxaPCLyb obtained by NMR calculations. c Obtained by GPC using CHCl3 and polystyrene as an eluent and standard, respectively. | |||||||||
| PBS-diol | — | — | — | — | — | — | 0.42 | 0.86 | 1.71 |
| PCL-diol | — | — | — | — | — | — | 0.63 | 1.12 | 1.32 |
| PBS4.2 | 96.16 | 0 | 3.84 | 97.01 | 0 | 2.99 | — | 7.45 | 2.33 |
| PBS4.26PCL6.34 | 57.99 | 38.66 | 3.35 | 59.38 | 38.15 | 2.47 | — | 8.45 | 2.43 |
| PBS4.25PCL6.35 | 48.39 | 48.39 | 3.22 | 51.06 | 46.27 | 2.67 | — | 7.54 | 2.33 |
| PBS4.24PCL6.36 | 38.76 | 58.14 | 3.10 | 39.95 | 56.98 | 3.07 | — | 6.88 | 2.49 |
| PBS4.23PCL6.37 | 29.11 | 67.91 | 2.98 | 28.30 | 68.71 | 2.99 | — | 5.89 | 2.23 |
| PBS4.22PCL6.38 | 19.43 | 77.71 | 2.86 | 20.17 | 77.60 | 2.23 | — | 9.23 | 2.18 |
| PCL6.3 | 0 | 97.40 | 2.60 | 0 | 97.16 | 2.84 | — | 5.93 | 2.10 |
PBSPCL copolymer: 1H-NMR (400 MHz, CDCl3, δ): 1.37 (δHd+j, m, –CH2–CH2–CH2–CH2–CH2–), 1.50–1.80 (δHb+i, m, –CH2–CH2–CH2–CH2–), 2.30 (δHc, t, –CH2–CH2–CO–), 4.06 (δHa, t, –CH2–CH2–O–), 1.67 (δHf, m, –CH2–CH2–CH2–O–CO–), 2.63 (δHg, t, –CH2–CH2–CO–), 4.07 (δHe, t, –CH2–CH2–O–CO–), 3.17 (δHh, m, –CO–NH–CH2–CH2–).
Preparation of PBSPCL/MWCNT films
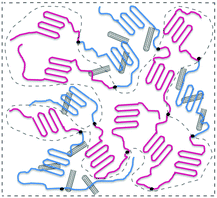
A series of PBS-PCL/MWCNT blend films were prepared by solvent casting from a mixed solution of PBSPCL multiblock copolymers and MWCNTs in dry chloroform. The detailed process is as follows: the desired amount of MWCNTs was placed in a suitable mixture of PBSPCL and chloroform and the dispersion solution was treated by strong ultrasonication for 30 min. Subsequently, the mixture was poured into a horizontal Teflon mold, and dried at room temperature in the fume hood for 2–3 days to produce the film. Then, the film was transferred to the vacuum drying oven to remove the residual solvent. Finally, the cured nanocomposite was taken out of the mold for subsequent tests. All the nanocomposites were recorded as PBSxaPCLyb/MWCNTsz, where the subscript z is the weight fraction of MWCNTs based on the PBSPCL copolymer (Scheme 2).Characterization and measurements
Results and discussion
Synthesis of PBSPCL copolymers
In this work, a series of PBSPCL copolymers with different compositions were prepared by coupling two precursors PBS-diol and PCL-diol with HDI (Scheme 1). The 1H-NMR (CDCl3, 400 MHz) spectra of PBS-diol, PCL-diol and PBSPCL are illustrated in Fig. 1. The typical resonance signals demonstrate that the precursors and copolymers were successfully synthesized.Moreover, the weight fraction of the resultant multiblock copolymers PBSPCL can be calculated based on the integral areas from 1H-NMR spectra according to the following equations:
 | (1) |
 | (2) |
 | (3) |
Preparation and morphology of PBSPCL/MWCNT nanocomposites
The PBSPCL/MWCNT nanocomposite films were easily produced by solution mixing and casting. From the view of the molecular design, the PBS segment acts as a netpoint and the PCL segment acts as a molecular switch, allowing a directly thermo-induced dual-shape memory effect. Based on this matrix, the incorporation of conductive fillers like MWCNTs allows the material to respond to electricity and NIR light stimuli. Although PBS and PCL are immiscible, the covalent bonding between the two segments in the PBSPCL copolymer will reduce the interfacial tension resulting in a refined microphase separation structure. It cannot be ignored that the composition and the segment chain length have an effect on the micromorphology even more than shape-memory performance. Moreover, the dispersion state of MWCNTs in the matrix will also dominantly impact the mechanical properties as well as shape-memory performance. Therefore, it is essential to explore the micromorphology of the nanocomposites comprehensively.Here, TEM was employed to observe the micromorphology of the nanocomposites. Unfortunately, it was hard to observe by staining one phase since PBS and PCL have a very similar chemical structure. As reported in previous works, the selective localization of MWCNTs can be formed spontaneously in an immiscible blend owing to the large difference in the affinity between the fillers and the two matrix components. Inspired by these reports, we wondered if the selective localization of MWCNTs will occur in the present system because of the immiscible nature of the two segments in the PBSPCL copolymer. In order to confirm this expectation, theory was employed for prediction.
Generally, the selective distribution of fillers in an immiscible polymer pair is caused by a large difference in the affinity between the filler and the two matrix components, which is related to the interfacial energies of the systems.50 Wetting coefficient ωa is proposed to define the selective distribution of MWCNTs according to the following relationship:51
 | (4) |
Harmonic-mean equation:
 | (5) |
 | (6) |
This equation is applied to evaluate this binary copolymer; the surface energy data (Table S1 in the ESI†) and interfacial tensions (Table S2 in the ESI†) between components were calculated accordingly. Finally, the wetting coefficient data for MWCNTs introduced into the binary copolymer can be calculated as 1.74 (harmonic-mean equation) or −3.43 (geometric-mean equation), both predicting that MWCNTs tend to selectively distribute in the PBS phase.
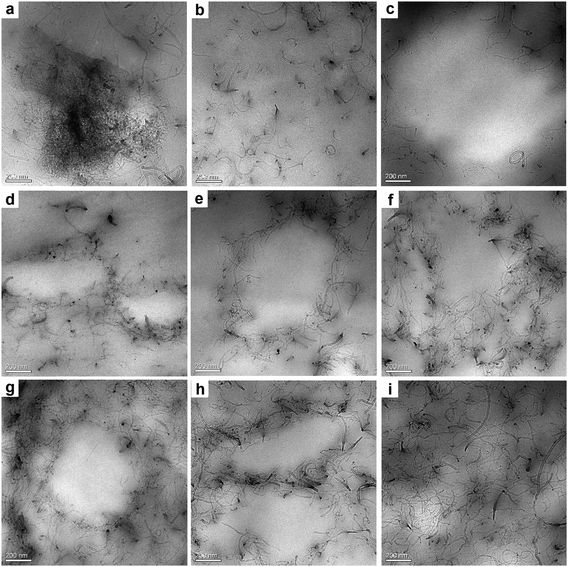
The morphologies of the resulting PBSPCL/MWCNT nanocomposites of different compositions are visualized in a series of TEM images, as shown in Fig. 2 (the corresponding TEM images at low magnification are shown in Fig. S1 in the ESI†). The phase morphologies of MWCNT incorporated binary systems with only one polymer (PBS/MWCNTs, PCL/MWCNTs) and their ternary blends (PBS/PCL/MWCNTs) are displayed for comparison. Distinctly, MWCNTs exhibited a much finer dispersion morphology in the PBS/MWCNT nanocomposite (Fig. 2b) than in the PCL/MWCNT nanocomposite (Fig. 2a). In the ternary PBS/PCL/MWCNT system, a selective dispersion morphology was formed. We can assume that the blank area in light color is the PCL-enriched domain while the MWCNT located area is the PBS-enriched domain. Compared to these corresponding blends, the immiscible multiblock copolymers have a refined microphase separation structure. In the case of PBSPCL-based nanocomposites, the situation is much complex due to the impact of the composition and the MWCNT charge capacity. When 1 wt% MWCNTs are loaded, varying the PBS content results in different dispersing states. When PBS content is 20 wt% (Fig. 2d), the blank area in light color is dominant and MWCNTs distribute sporadically. It may indicate that this sample displays a sea-island morphology consisting of a PCL continuous phase and a PBS dispersing phase. Upon increasing PBS content to 30 wt% (Fig. 2e), it is found that the area which MWCNTs occupied is increased while the blank area is reduced. It is worth mentioning that the MWCNTs can form a conductive network when PBS content reaches 40 wt% (Fig. 2f). It reveals a co-continuous phase structure formed in the matrix and the selective location of MWCNTs enables us to prepare the nanocomposites with significantly lower percolation thresholds of nanofillers, which has been proved by the following conductivity test. When the loading capacity of MWCNTs increases to 3 wt% (Fig. 2g–i), the advantage of the selective dispersion has been weakened because a part of MWCNTs spread to the PCL-enriched domain when the PBS-enriched domain is saturated, especially in the sample of PBS4.24PCL6.36/CNTs3.0 (Fig. 2i).
Conductivity of PBSPCL/MWCNT nanocomposites
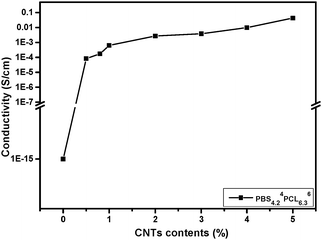
The conductivity of PBSPCL/MWCNT nanocomposites is a key factor determining whether the material could respond to the electricity. Table 2 lists the test results of nanocomposites with different compositions and MWCNT loading. As mentioned above, the MWCNTs prefer to disperse into the PBS domain, sequentially, whether the PBS domain could form a continuous phase will affect the conductivity of the material obviously even when the same amount of MWCNTs is loaded. The most appropriate situation is when MWCNTs just form a percolation network in the continuous PBS phase with lowest content, which may evidently reduce the MWCNT load compared with the homogenous system. As a result, this optimal state was found in the sample PBS4.24PCL6.36/MWCNTs1.0. Fig. 3 illustrates the curve of PBS4.24PCL6.36/MWCNTs with different MWCNT contents. As shown, the pristine copolymer PBS4.24PCL6.36 belongs to a typical insulator due to the fact that its conductivity is only about 10−15 S cm−1. By introducing 0.5 wt% MWCNTs, the conductivity of the PBS4.24PCL6.36/MWCNTs is significantly improved to 5.78 × 10⁻⁵ S cm−1. When the MWCNT loading reaches 1.0 wt%, the electrical conductivity of the corresponding sample further increases to 6.25 × 10⁻⁴ S cm−1, so that the nanocomposites with an electrical conductivity network are achieved, and an insulator transforms into a conductor. For comparison, the conductivity of PBS4.2/MWCNTs1.0 was evaluated as 9.79 × 10⁻⁵ S cm−1, which is lower than that of PBS4.24PCL6.36/MWCNTs1.0. This could be further proof of the selective dispersion of MWCNTs in the PBS domain.| Samples | Conductivity (S cm−1) | |||
|---|---|---|---|---|
| 1.0% MWCNTs | 1.5% MWCNTs | 2.0% MWCNTs | 3.0% MWCNTs | |
| PBS4.22PCL6.38/MWCNTs | <10−8 | (9.15 ± 0.46) × 10−6 | (1.23 ± 0.11) × 10−3 | (1.04 ± 0.19) × 10−3 |
| PBS4.23PCL6.37/MWCNTs | (1.14 ± 0.22) × 10−6 | (8.80 ± 0.35) × 10−4 | (3.64 ± 0.13) × 10−3 | (3.74 ± 0.27) × 10−3 |
| PBS4.24PCL6.36/MWCNTs | (6.25 ± 0.14) × 10−4 | (1.30 ± 0.07) × 10−3 | (4.45 ± 0.19) × 10−3 | (3.06 ± 0.08) × 10−2 |
| PBS4.25PCL6.35/MWCNTs | (9.46 ± 0.75) × 10−5 | (1.40 ± 0.19) × 10−3 | (3.67 ± 0.23) × 10−3 | (3.42 ± 0.06) × 10−2 |
| PBS4.26PCL6.34/MWCNTs | (8.30 ± 0.45) × 10−5 | (1.48 ± 0.13) × 10−3 | (3.20 ± 0.37) × 10−3 | (3.33 ± 0.04) × 10−2 |
Thermal behavior of PBSPCL copolymers and PBSPCL/MWCNT nanocomposites
For the double-crystalline PBSPCL copolymers, the crystallites of the PBS segment acted as a netpoint determining the permanent shape, while the crystallization of the PCL segment is responsible for the fixing of the temporary shape. Indeed, the immiscible nature of the two segments in copolymers influences their thermal behavior, and after incorporating MWCNTs into the PBSPCL matrix, the effect of its loading capacity and the dispersion state will also be taken into account. Here, DSC was employed to assess the thermal crystallization behavior of the PBSPCL copolymers and their nanocomposites. Fig. 4 displays the standard curves for PBSPCL copolymers (a and b) and their corresponding nanocomposites (c and d) in the cooling scan (a and c) followed by the heating scan (b and d). Detailed data are summarized in Table 3.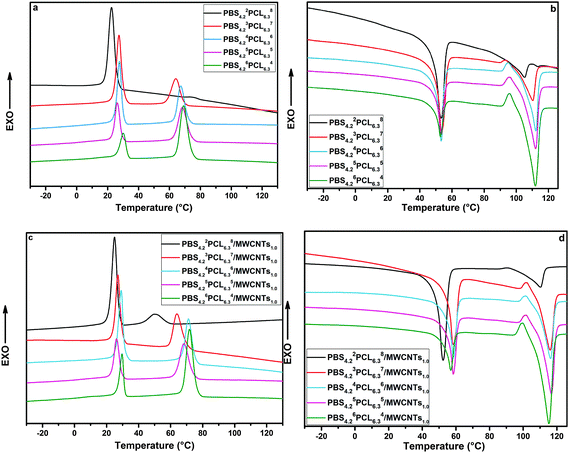 | ||
| Fig. 4 DSC curves of PBSPCL with various feed ratios in cooling scans (a) and heating scans (b), and PBSPCL/MWCNTs with various feed ratios in cooling scans (c) and heating scans (d). | ||
| Samples | PBS | PCL | ||||||||
|---|---|---|---|---|---|---|---|---|---|---|
| T c (°C) | T m (°C) | ΔHca (J g−1) | ΔHmb (J g−1) | X c (%) | T c (°C) | T m (°C) | ΔHca (J g−1) | ΔHmb (J g−1) | X c (%) | |
a Obtained from the cooling scans.
b Cold crystallization temperature and enthalpy obtained from the heating scans.
c The mass crystallinity Xc was determined from ΔHm assuming that the enthalpy of melting  of perfectly crystalline PBS and PCL is 10253 and 136 J g−1,54 respectively. of perfectly crystalline PBS and PCL is 10253 and 136 J g−1,54 respectively.
|
||||||||||
| PBS4.22PCL6.38 | — | 104.8 | — | 11.3 | 53.1 | 22.7 | 53.2 | 48.0 | 42.3 | 38.9 |
| PBS4.23PCL6.37 | 64.4 | 110.3 | 20.2 | 20.8 | 67.8 | 27.3 | 53.6 | 34.8 | 36.9 | 38.8 |
| PBS4.24PCL6.36 | 65.8 | 110.4 | 28.0 | 28.9 | 70.7 | 27.2 | 52.7 | 30.2 | 31.1 | 38.1 |
| PBS4.25PCL6.35 | 68.2 | 110.9 | 30.6 | 31.5 | 61.7 | 26.2 | 52.7 | 22.4 | 26.8 | 36.5 |
| PBS4.26PCL6.34 | 67.9 | 110.3 | 39.8 | 43.8 | 71.5 | 29.0 | 53.5 | 16.3 | 18.7 | 34.4 |
| PBS4.22PCL6.38/MWCNTs1.0 | 49.7 | 110.4 | 12.7 | 12.9 | 63.2 | 25.0 | 52.9 | 44.2 | 45.5 | 41.8 |
| PBS4.23PCL6.37/MWCNTs1.0 | 64.2 | 112.2 | 21.5 | 22.6 | 72.8 | 27.7 | 54.2 | 33.4 | 39.1 | 41.1 |
| PBS4.24PCL6.36/MWCNTs1.0 | 67.4 | 112.0 | 27.0 | 30.7 | 75.1 | 27.6 | 53.3 | 33.1 | 34.8 | 42.6 |
| PBS4.25PCL6.35/MWCNTs1.0 | 67.7 | 111.8 | 32.7 | 34.6 | 67.9 | 27.2 | 53.2 | 26.0 | 29.2 | 42.9 |
| PBS4.26PCL6.34/MWCNTs1.0 | 69.2 | 111.9 | 40.3 | 44.4 | 72.5 | 30.1 | 53.2 | 25.0 | 25.0 | 46.0 |
For a double-crystalline system, almost all samples exhibit two crystalline peaks in the cooling scan and two melting peaks in the following heating scan. In our previous work, we have found that PBS has a very strong crystalline tendency. In the present system, the crystallinity of the PBS segment still remains 53% even in the sample PBS4.22PCL6.38 whose PBS content is quite low. For all samples, the variation of the composition has no obvious effect on the melting temperature but increasing the content of one segment will benefit its own crystallinity attested by the increase of its crystallinity. The incorporation of 1 wt% MWCNTs has no obvious effect on the melting temperatures of two segments, but increases the crystallinity to some extent. For PBS4.22PCL6.38/MWCNTs1.0 with lowest PBS content, the crystallinity of the PBS segment enhanced evidently while a slight change was found in the PCL segment.
This phenomenon can be attributed to the nucleating effects of a high local concentration of MWCNTs in the PBS domain. This effect became minor when PBS content decreased. In turn, it was enlarged in the PCL segment due to the formation of a refined co-continuous phase structure.
For all samples, the two segments in PBSPCL copolymers exhibited good crystallinity over a wide composition range, enabling them to act as good candidates as dual-shape materials; moreover, benefitted by the shape-memory performance, the incorporation of MWCNTs increased the crystallinity of the two segments to some extent.
Tensile properties
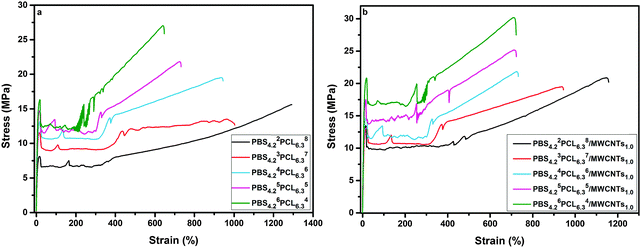
Typical engineering stress–strain curves for PBSPCL copolymers and their PBSPCL/MWCNT nanocomposites are shown in Fig. 5. The detailed data including tensile strength at the yield point (σy), tensile strength at break (σb), elongation at break (εb), and the Young's modulus (E) are listed in Table 4. Obviously, the PBSPCL copolymers are very ductile materials as shown by εb varying from 647% to 1294% which gradually increased with the FPCL. Generally, incorporating MWCNTs into a polymer matrix uniformly reinforced the material but with a negative effect on its ductility. In this work, the characteristic of selectively dispersed MWCNTs in the hard PBS segment endows the nanocomposite with a good mechanical performance. On one hand, the increase of E and σy indicated that the reinforcement of the material has been achieved; on the other hand, the values of εb did not decrease, demonstrating the maintenance of the ductility property. For example, when the PBS4.22PCL6.38 matrix is loaded with 1.0% MWCNTs, the σy and E increased from 8.12 MPa to 13.28 MPa and from 221 MPa to 256 MPa, respectively. Meanwhile, the value of εb slightly decreased from 1294% to 1158%. Therefore, it can be assumed that the selective dispersion of MWCNTs led to nanocomposites having a good compromise between strength and flexibility.| Samples | σ y (MPa) | σ b (MPa) | ε (%) | E (MPa) |
|---|---|---|---|---|
| PBS4.22PCL6.38 | 8.12 ± 0.80 | 18.57 ± 2.12 | 1294 ± 38 | 221 ± 7 |
| PBS4.23PCL6.37 | 11.52 ± 1.96 | 19.47 ± 0.76 | 1004 ± 94 | 234 ± 5 |
| PBS4.24PCL6.36 | 13.58 ± 3.87 | 23.73 ± 1.23 | 892 ± 95 | 237 ± 18 |
| PBS4.25PCL6.35 | 14.89 ± 2.49 | 27.41 ± 3.54 | 746 ± 67 | 376 ± 15 |
| PBS4.26PCL6.34 | 16.32 ± 1.39 | 36.51 ± 5.26 | 647 ± 56 | 406 ± 37 |
| PBS4.22PCL6.38/MWCNTs1.0 | 13.28 ± 1.02 | 18.90 ± 1.08 | 1158 ± 22 | 256 ± 22 |
| PBS4.23PCL6.37/MWCNTs1.0 | 13.37 ± 4.03 | 19.54 ± 2.64 | 945 ± 125 | 285 ± 13 |
| PBS4.24PCL6.36/MWCNTs1.0 | 14.70 ± 2.93 | 20.80 ± 2.49 | 733 ± 59 | 380 ± 20 |
| PBS4.25PCL6.35/MWCNTs1.0 | 17.52 ± 1.24 | 24.14 ± 1.33 | 723 ± 94 | 417 ± 11 |
| PBS4.26PCL6.34/MWCNTs1.0 | 20.84 ± 1.20 | 26.88 ± 2.27 | 708 ± 39 | 424 ± 24 |
Shape-memory properties of PBSPCL copolymers and PBSPCL/MWCNT nanocomposites
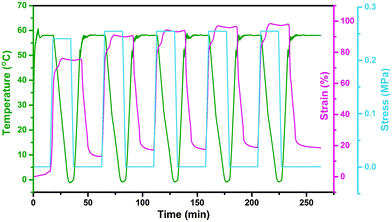
In this study, the electro- and NIR-induced SME of the nanocomposite was designed by the introduction of conducting medium MWCNTs into the thermo-induced PBSPCL copolymers. Therefore, the thermo-induced SME of PBSPCL using DMA in controlled-force mode was first determined, employing the Tm of PCL segments as the Ttrans. The program for the cyclic thermomechanical analysis is described detailed in the ESI.†Fig. 6 presents the programmed cyclic thermomechanical curves for the PBS4.22PCL6.38 as a typical sample (the others are shown in the ESI†).The fixed ratio (Rf) and the recovery ratio (Rr) were calculated according to the following equations. The results recorded in the first cycle were strongly influenced by the residual stress from the processing history of the samples, as for the other thermo-induced SMPs. Thus, Rf and Rr were determined on the results of cycles 2–4, and all data are listed in Table 5.
 | (7) |
 | (8) |
| Samples | R f (%) | R r (%) |
|---|---|---|
| PBS4.22PCL6.38 | 99.43 ± 0.06 | 98.25 ± 1.37 |
| PBS4.23PCL6.37 | 95.20 ± 0.15 | 95.31 ± 1.72 |
| PBS4.24PCL6.36 | 96.66 ± 0.44 | 87.66 ± 9.55 |
| PBS4.25PCL6.35 | 93.51 ± 1.55 | 82.54 ± 20.11 |
| PBS4.26PCL6.34 | 87.57 ± 0.56 | 84.06 ± 16.39 |
Accordingly, the composition of the network affected the Rf and Rr ratios to a certain extent. In this work, shape fixing is related to the crystalline phase of the PCL segment. As a consequence, the Rf increased with PCL content which has higher absolute crystallinity. Rf increased from 87.57% to 99.43% when the content of the PCL segment increased from 40% to 80%. However, for the recovery property, increasing PBS segment did not result in the increase of Rr. As above mentioned, the PBS has strong crystallization ability, the physical crosslinking formed by the crystalline PBS segment of 20% content was enough to act as the netpoint of the SMP (Rr is about 98.25%). High content of the PBS segment in the continuous phase could form a rigid framework and it was probably destroyed when external forces were applied during the programming process. Thus, the slippage of crystal lamella and the deformation occurred. Another possible reason may be attributed to the dual-step recovery phenomenon which was put forward by Huang WM et al.55,56 It can be confirmed that the pristine copolymers exhibit desirable dual-shape memory performance with suitable composition.
In this work, the highlight is principally related to the SME of the nanocomposites triggered by electricity and NIR light after incorporating the MWCNTs into this matrix. To achieve the electro-induced SME, the most important prerequisite is that the nanocomposites possess suitable conductivity, ensuring that the generated Joule heat could increase the temperature of the matrix above Ttrans. Like the conductivity of nanocomposites evaluated above, the relationship between the surface temperature of samples and different voltages was established, allowing us to choose a suitable intensity of voltage to trigger the recovery for a certain sample (over the Ttrans but below Tm,PBS). Fig. 7 illustrates the surface temperature of nanocomposites at different voltages, showing a high dependence on its conductivity. For PBS4.22PCL6.38/MWCNT series, when the content of MWCNTs is about 1.0 wt% or 1.5 wt%, no Joule heating was generated in the film since they remained at their original temperature, even if the applied voltage was 120 V or higher. With the MWCNT content increased to 2 wt%, the temperature of the film reached 42 °C under 120 V but it was still lower than its Ttrans. Only in the case of the 3.0 wt% MWCNT loaded sample, the temperature could reach 55 °C within 50 seconds for an application of 30 V voltage. For PBS4.24PCL6.36/MWCNT series, all of the PBS4.24PCL6.36/MWCNTs met the demand of electric drive even when the MWCNT content is only 1%. This result highly coincides with the TEM observation and the evaluation of conductivity. Following this, the electro-induced SME of the nanocomposites was conducted under a suitable voltage. Undoubtedly, the recovery process could only be triggered in the samples whose attainable temperature meets the demand after electric heat conversion, and the Rf and Rr are summarized in Table 6. All PBS4.24PCL6.36/MWCNT series could be activated even when 1% nanofiller is loaded, the optimal sample predicted by TEM observation. When 3.0 wt% MWCNTs are incorporated, the recovery of all samples could be triggered by 30 V voltage. This phenomenon further proved that the selective dispersion of MWCNTs in the continuous PBS phase of the matrix can significantly reduce the percolation thresholds of nanofillers. Varying the composition, the electro-induced SME of nanocomposites followed a similar trend to the thermo-induced SME of the corresponding copolymers. The recovery process of the typical sample PBS4.24PCL6.36/MWCNTs1.0 was recorded using a camera under 75 V (Fig. 8). As conducting fillers, MWCNTs may not only convert the electric energy to thermal energy by generating Joule heat, but they also can serve as nanoscale heat sources and in conduction of heat channels through efficiently absorbing and transforming NIR light into thermal energy. So, besides the electro-induced SME, the nanocomposites designed in this work can also realize NIR-response when they are exposed to NIR light. The optimal sample PBS4.24PCL6.36/MWCNT1.0 (black spiral) was selected to evaluate the NIR-induced SME, using its corresponding pristine copolymer PBS4.24PCL6.36 (white spiral) as a reference. Fig. 9 shows the recovery process of this pair when the NIR laser is switched on. The temperature of the nanocomposite film increased once the NIR laser is turned on due to the effective heat conversion rate of MWCNTs and the recovery process could be finished within 52 s. For comparison, the pristine sample has no change under the same conditions.
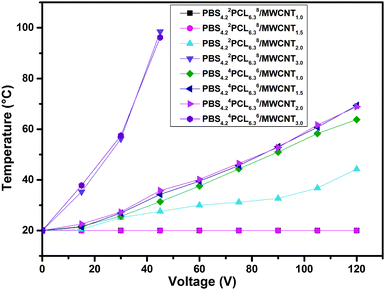 | ||
| Fig. 7 The surface temperature of PBS4.22PCL6.38/MWCNTs and PBS4.24PCL6.36/MWCNTs varies with the content of MWCNTs at different voltages. | ||
| Samples | 1% MWCNTs | 1.5% MWCNTs | 2% MWCNTs | 3% MWCNTs | ||||
|---|---|---|---|---|---|---|---|---|
| R r (%) | R f (%) | R r (%) | R f (%) | R r (%) | R f (%) | R r (%) | R f (%) | |
| PBS4.22PCL6.38/MWCNTs | — | — | — | — | — | — | 98.46 ± 0.14 | 99.24 ± 0.09 |
| PBS4.23PCL6.37/MWCNTs | — | — | — | — | 97.69 ± 0.39 | 98.11 ± 0.43 | 97.25 ± 0.32 | 98.89 ± 0.17 |
| PBS4.24PCL6.36/MWCNTs | 95.73 ± 0.77 | 97.28 ± 0.43 | 96.12 ± 0.56 | 97.94 ± 0.38 | 96.52 ± 0.61 | 98.25 ± 0.27 | 96.40 ± 0.12 | 98.33 ± 0.31 |
| PBS4.25PCL6.35/MWCNTs | — | — | 95.49 ± 0.34 | 93.57 ± 0.54 | 95.93 ± 0.43 | 94.07 ± 0.63 | 96.23 ± 0.29 | 93.46 ± 0.48 |
| PBS4.26PCL6.34/MWCNTs | — | — | 93.38 ± 0.87 | 89.92 ± 1.02 | 92.67 ± 0.71 | 90.28 ± 0.87 | 93.17 ± 0.53 | 90.57 ± 0.36 |
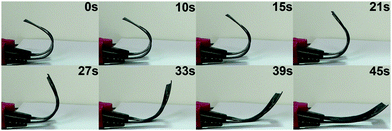 | ||
| Fig. 8 The electro-induced recovery process of PBS4.24PCL6.36/MWCNTs1.0 under 75 V voltage recorded using a digital camera. | ||
 | ||
| Fig. 9 The NIR-induced recovery process of PBS4.24PCL6.36/MWCNTs1.0 recorded using a digital camera. | ||
Conclusions
In this work, a series of immiscible double-crystalline multiblock copolymers were firstly synthesized via chain-extension of PBS-diol and PCL-diol precursors by HDI. The structures of all the precursors and multiblock copolymers were confirmed by 1H-NMR. Then, multi-stimuli-responsive shape-memory PBSPCL/MWCNT nanocomposites were prepared simply by adding MWCNTs into PBSPCL multiblock copolymer matrices via solution mixing and casting processes. MWCNTs were predicted to be distributed in PBS domains by thermodynamic theoretical calculations, which perfectly matched with TEM observations. As expected, a significant reduction of percolation thresholds was achieved by optimizing the composition of the nanocomposites. Moreover, the mechanical test revealed that the feature of selectively dispersed MWCNTs in the hard PBS segment endows the nanocomposite with good mechanical performance and that the reinforcement of the material can be achieved without deteriorating its ductility. The results of cyclic photomechanical tests by DMA revealed that the PBSPCL copolymers exhibit an excellent dual-shape memory effect. After the incorporation of MWCNTs into the matrices, the electro- and NIR-induced SMEs were realized, and the optimized sample was found to be PBS4.24PCL6.36/MWCNTs1.0, which exhibits optimal structure and performance.Acknowledgements
This work was supported financially by the National Science Foundation of China (51473096 and 51421061), and the Program for Changjiang Scholars and Innovative Research Team in the University of Ministry of Education of China (IRT1026).Notes and references
- A. Lendlein and S. Kelch, Angew. Chem., Int. Ed., 2002, 41, 2034–2057 CrossRef CAS.
- W. Huang, Z. Ding, C. Wang, J. Wei, Y. Zhao and H. Purnawali, Mater. Today, 2010, 13, 54–61 CrossRef CAS.
- M. Behl, M. Y. Razzaq and A. Lendlein, Adv. Mater., 2010, 22, 3388–3410 CrossRef CAS PubMed.
- W. Huang, C. Song, Y. Fu, C. Wang, Y. Zhao, H. Purnawali, H. Lu, C. Tang, Z. Ding and J. Zhang, Adv. Drug Delivery Rev., 2013, 65, 515–535 CrossRef CAS PubMed.
- M. Ahmad, J. Luo, H. Purnawali, W. M. Huang, P. King, P. Chalker, M. Mireftab and J. Geng, J. Mater. Chem., 2012, 22, 8192–8194 RSC.
- C. Huang, L. Jiao, J. Zhang, J. Zeng, K. Yang and Y. Wang, Polym. Chem., 2012, 3, 800–808 RSC.
- R. Weiss, E. Izzo and S. Mandelbaum, Macromolecules, 2008, 41, 2978–2980 CrossRef CAS.
- J. Zhou, A. M. Schmidt and H. Ritter, Macromolecules, 2009, 43, 939–942 CrossRef.
- A. Beilvert, F. Faure, A. Meddahi-Pellé, L. Chaunier, S. Guilois, F. Chaubet, D. Lourdin and A. Bizeau, Laryngoscope, 2014, 124, 875–881 CrossRef PubMed.
- T. Zhang, Z. Wen, Y. Hui, M. Yang, K. Yang, Q. Zhou and Y. Wang, Polym. Chem., 2015, 6, 4177 RSC.
- Z. Wen, T. Zhang, Y. Hui, W. Wang, K. Yang, Q. Zhou and Y. Wang, J. Mater. Chem. A, 2015, 3, 13435 CAS.
- H. Koerner, G. Price, N. A. Pearce, M. Alexander and R. A. Vaia, Nat. Mater., 2004, 3, 115–120 CrossRef CAS PubMed.
- Y. Liu, H. Lv, X. Lan, J. Leng and S. Du, Compos. Sci. Technol., 2009, 69, 2064–2068 CrossRef CAS.
- Y. Xiao, S. Zhou, L. Wang and T. Gong, ACS Appl. Mater. Interfaces, 2010, 2, 3506–3514 CAS.
- C. Huang, M. He, M. Huo, L. Du, C. Zhan, K. Yang and Y. Wang, Polym. Chem., 2013, 4, 3987–3997 RSC.
- X. Sun, Z. Liu, K. Welsher, J. Robinson, A. Goodwin, S. Zaric and H. Dai, Nano Res., 2008, 1, 203 CrossRef CAS PubMed.
- H. Becerril, J. Mao, Z. Liu, R. Stoltenberg, Z. Bao and Y. Chen, ACS Nano, 2008, 2, 463 CrossRef CAS PubMed.
- A. Balandin, S. Ghosh, W. Bao, I. Calizo, D. Teweldebrhan, F. Miao and C. Lau, Nano Lett., 2008, 8, 902 CrossRef CAS PubMed.
- R. Mohr, K. Kratz, T. Weigel, M. Lucka-Gabor, M. Moneke and A. Lendlein, Proc. Natl. Acad. Sci. U. S. A., 2006, 103, 3540–3545 CrossRef CAS PubMed.
- C. Wang, W. Huang, Z. Ding, Y. Zhao and H. Pumawali, Compos. Sci. Technol., 2012, 72, 1178–1182 CrossRef CAS.
- F. Pilate, R. Mincheva, J. Winter, P. Gerbaux, L. Wu, R. Todd, J. Raquez and P. Dubois, Chem. Mater., 2014, 26, 5860–5867 CrossRef CAS.
- H. Xie, M. He, X. Deng, L. Du, C. Fan, K. Yang and Y. Wang, ACS Appl. Mater. Interfaces, 2016, 8, 9431–9439 CAS.
- H. Jiang, S. Kelch and A. Lendlein, Adv. Mater., 2006, 18, 1471–1475 CrossRef CAS.
- L. Wang, X. Yang, H. Chen, T. Gong, W. Li, G. Yang and S. Zhou, ACS Appl. Mater. Interfaces, 2013, 5, 10520–10528 CAS.
- L. Wang, S. Di, W. Wang, H. Chen, X. Yang, T. Gong and S. Zhou, Macromolecules, 2014, 47, 1828–1836 CrossRef CAS.
- W. Huang, B. Yang, L. An, C. Li and Y. Chan, Appl. Phys. Lett., 2005, 86, 114105 CrossRef.
- H. Du and J. Zhang, Soft Matter, 2010, 6, 3370–3376 RSC.
- Y. Xiao, S. Zhou, L. Wang, X. Zheng and T. Gong, Composites, Part B, 2010, 41, 537–542 CrossRef.
- A. Metcalfe, A.-C. Desfaits, I. Salazkin, L. H. Yahia, W. M. Sokolowski and J. Raymond, Biomaterials, 2003, 24, 491–497 CrossRef CAS PubMed.
- A. Lendlein and S. Kelch, Clin. Hemorheol. Microcirc., 2005, 32, 105–116 CAS.
- I. Ward Small, P. Singhal, T. S. Wilson and D. J. Maitland, J. Mater. Chem., 2010, 20, 3356–3366 RSC.
- W. Small IV, T. Wilson, W. Benett, J. Loge and D. Maitland, Opt. Express, 2005, 13, 8204–8213 Search PubMed.
- F. Li, L. Qi, J. Yang, M. Xu, X. Luo and D. Ma, J. Appl. Polym. Sci., 2000, 75, 68–77 CrossRef CAS.
- X. Luo and P. Mather, Soft Matter, 2010, 6, 2146–2149 RSC.
- M. Yoonessi, Y. Shi, D. Scheiman, M. Lebron-Colon, D. Tigelaar, R. Weiss and M. Meador, ACS Nano, 2012, 6, 7644–7655 CrossRef CAS PubMed.
- J. Leng, X. Lan, Y. J. Liu, S. Y. Du, W. M. Huang, N. Liu, S. J. Phee and Q. Yuan, Appl. Phys. Lett., 2008, 92, 014104 CrossRef.
- J. Cho, J. Kim, Y. Jung and N. Goo, Macromol. Rapid Commun., 2005, 26, 412–416 CrossRef CAS.
- J. Alam, M. Alam, L. Dass, A. Shanmugharaj and M. Raja, Polym. Compos., 2014, 35, 2129–2136 CrossRef CAS.
- H. Luo, Z. Li, G. Yi, X. Zu, H. Wang, Y. Wang, H. Huang, J. Hu, Z. Liang and B. Zhong, Mater. Lett., 2014, 134, 172–175 CrossRef CAS.
- F. Du, E. Ye, W. Yang, T. Shen, C. Tang, X. Xie, X. Zhou and W. Law, Composites, Part B, 2015, 68, 170–175 CrossRef CAS.
- J. Liang, Y. Xu, Y. Huang, L. Zhang, Y. Wang and Y. Chen, J. Phys. Chem. C, 2009, 113, 9921–9927 CAS.
- J. Huang, C. Mao, Y. Zhu, W. Jiang and X. Yang, Carbon, 2014, 73, 267–274 CrossRef CAS.
- D. Wu, Y. Zhang and W. Yu, Biomacromolecules, 2009, 10, 417–424 CrossRef CAS PubMed.
- D. Wu, D. Lin, J. Zhang, W. Zhou, M. Zhang, Y. Zhang, D. Wang and B. Lin, Macromol. Chem. Phys., 2011, 212, 613–626 CrossRef CAS.
- A. Goldel, G. Kasaliwal and P. Potschke, Macromol. Rapid Commun., 2009, 30, 423–429 CrossRef PubMed.
- A. Baudouin, J. Devaux and C. Bailly, Polymer, 2010, 51, 1341–1354 CrossRef CAS.
- J. Zhang, G. Wu, C. Huang, Y. Niu, C. Chen, Z. Chen, K. Yang and Y. Wang, J. Phys. Chem. C, 2012, 116, 5835–5845 CAS.
- M. Zhan, K. Yang and Y. Wang, Chin. Chem. Lett., 2015, 26, 1221–1224 CrossRef CAS.
- L. Zheng, C. Li, Z. Wang, J. Wang, Y. Xiao, D. Zhang and G. Guan, Ind. Eng. Chem. Res., 2012, 51, 7264–7272 CrossRef CAS.
- J. Chen, Y. Shi, J. Yang, N. Zhang, T. Huang, C. Chen, Y. Wang and Z. Zhou, J. Mater. Chem., 2012, 22, 22398–22404 RSC.
- M. Sumita, K. Sakata, S. Asai, K. Miyasaka and H. Nakagawa, Polym. Bull., 1991, 25, 265 CrossRef CAS.
- S. Wu, Polymer Interface and Adhesion, Marcel Dekker, New York, 1982 Search PubMed.
- Y. He, B. Zhu, W. Kai and Y. Inoue, Macromolecules, 2004, 37, 3337–3345 CrossRef CAS.
- C. Pitt, F. Chasalow and Y. Hibionada, J. Appl. Polym. Sci., 1981, 26, 3779–3786 CrossRef CAS.
- W. Huang, Y. Zhao, C. Wang, Z. Ding, H. Purnawali, C. Tang and J. Zhang, J. Polym. Res., 2012, 19, 9952–9986 CrossRef.
- X. Wu, W. Huang, Z. Seow, W. Chin, W. Yang and K. Sun, Smart Mater. Struct., 2013, 22, 125023 CrossRef.
Footnote |
| † Electronic supplementary information (ESI) available: Experimental part, theoretical calculations, TEM, DMA, and videos. See DOI: 10.1039/c6qm00047a |
| This journal is © the Partner Organisations 2017 |

