 Open Access Article
Creative Commons Attribution 3.0 Unported Licence
Polymorphism of CsGaS2 – structural characterization of a new two-dimensional polymorph and study of the phase-transition kinetics†‡
D.
Friedrich
a,
M.
Schlosser
a,
R.
Weihrich
b and
A.
Pfitzner
 *a
*a
aInstitut für Anorganische Chemie, Universität Regensburg, 93040 Regensburg, Germany. E-mail: arno.pfitzner@chemie.uni-regensburg.de
bInstitut für Materials Resource Management, Universität Augsburg, 86135 Augsburg, Germany
First published on 28th December 2016
Abstract
CsGaS2-mC64 was obtained by reaction of CsN3 with stoichiometric amounts of Ga2S3 and S at elevated temperatures. The crystal structure of the air- and moisture stable compound was determined from single-crystal X-ray diffraction data. The colourless solid crystallizes in the monoclinic space group C2/c (no. 15) with the lattice parameters a = 10.5718(6) Å, b = 10.5708(6) Å, c = 16.0847(8) Å, β = 99.445(4)°, V = 1773.1(2) Å3, and Z = 16. The compound crystallizes in the TlGaSe2 structure type and features anionic layers 2∞[Ga4S84−] consisting of corner-sharing Ga4S10 supertetrahedra. At temperatures above 600 °C an irreversible phase-transition to CsGaS2-mC16 occurs. The phase-transition kinetics were studied using in situ high-temperature X-ray powder diffraction techniques. This transition can only be reversed by using high pressures (>5 GPa at 500 °C). The compound was further characterized using Raman- and diffuse reflectance spectroscopy. Chemical bonding was analysed by DFT calculations.
Introduction
Chalcogenometallates of Group 13 metals containing alkali metal cations MxTyQz (M = alkali metal, T = triel, Q = chalcogen) crystallize in a large variety of different structure types.1 Due to their semiconducting properties, these solids are interesting materials for technical applications, e.g. in gas sensors.2 The polymeric anions in these compounds are formed by TQ4 tetrahedra. Condensation of these building blocks leads to the formation of more complex oligomeric or polymeric anionic structures. The crystal structures of the resulting compounds contain these anionic chains, layers or networks embedded in a cationic surrounding of the alkali metal cations.1 Recently, we reported on the polymorphism of CsGaSe2.3 During the high-temperature phase-transition of this compound, a complete structural reconstruction of the anionic substructure from two-dimensional layers to one-dimensional chains takes place. Herein, we report on the discovery of CsGaS2-mC64, a new low-temperature polymorph of CsGaS2. Prior studies of this compound by Bronger et al.4 revealed CsGaS2-mC16 as the only polymorph of CsGaS2. At high temperatures CsGaS2-mC64 undergoes an irreversible phase-transition to CsGaS2-mC16. The low-temperature polymorph, however, can be restored by a high-pressure treatment. This behaviour is in contrast to the reversible phase-transition of CsGaSe2.3 The kinetics of the high-temperature phase-transition of CsGaS2-mC64 were studied by in situ high-temperature X-ray diffraction using the JMAK theory.5 We decided to redetermine the crystal structure of CsGaS2-mC16 to obtain state-of-the-art data for both modifications. Furthermore, both polymorphs were characterized by Raman- and UV/Vis-diffuse reflectance spectroscopy and quantum chemical calculations.Results and discussion
Crystal structures of both CsGaS2 polymorphs
Both polymorphs of CsGaS2 form air and moisture stable colourless crystals. The crystal structures were solved from single-crystal X-ray diffraction data collected at 20 °C. Both polymorphs crystallize in the monoclinic space group C2/c (no. 15) with a = 10.5718(6) Å, b = 10.5708(6) Å, c = 16.0847(8) Å, β = 99.445(4)°, V = 1773.1(2) Å3, and Z = 16 for CsGaS2-mC64 (single-crystal, 20 °C), and a = 7.3875(2) Å, b = 12.1282(4) Å, c = 5.8994(2) Å, β = 113.210(3)°, V = 485.79(3) Å3, and Z = 4 for CsGaS2-mC16 (single-crystal, 20 °C). The structures were solved by charge flipping methods using SUPERFLIP,6 implemented in Jana2006,7 and refined to R1 = 0.0397 and wR2 = 0.0578 (all data) for CsGaS2-mC64, and R1 = 0.0122 and wR2 = 0.0401 (all data) for CsGaS2-mC16 by full-matrix least squares methods using Jana2006.7 Details on the final crystallographic data are listed in Table 1. The atomic coordinates and isotropic displacement parameters are listed in Tables 2 and 3. Anisotropic displacement parameters, interatomic distances, and angles can be found in the ESI (Tables S1–S4‡).![[thin space (1/6-em)]](https://www.rsc.org/images/entities/char_2009.gif) a
a
| CsGaS2-mC64 | CsGaS2-mC16 | |
|---|---|---|
| a Details of the crystal structure investigations may also be obtained from the Fachinformationszentrum Karlsruhe, 76344 Eggenstein-Leopoldshafen, Germany (E-mail: crysDATA@fiz-karlsruhe.de), on quoting the depository numbers CSD 432322 (CsGaS2-mC64) and CSD 432321 (CsGaS2-mC16). Cif-files are included to the ESI. | ||
| Formula weight/g mol−1 | 266.76 | |
| Colour/shape | Colourless plate | Colourless rod |
| Crystal size/mm3 | 0.12 × 0.04 × 0.02 | 0.29 × 0.04 × 0.02 |
| Crystal system, space group | Monoclinic, C2/c | |
| Lattice constants from single crystals | ||
| a/Å | 10.5718(6) | 7.3875(2) |
| b/Å | 10.5708(6) | 12.1284(4) |
| c/Å | 16.0847(8) | 5.8994(2) |
| β/° | 99.445(4) | 113.210(3) |
| Volume V/Å3 | 1773.1(2) | 458.79(3) |
| Number of formula units Z | 16 | 4 |
| Calculated density ρcalc./g cm−3 | 3.997 | 3.647 |
| Temperature T/°C | 20 | |
| Diffractometer | Rigaku Supernova | |
| Wavelength λ/Å | 0.71073 | |
| Absorption coeff. μ(Mo-Kα)/mm−1 | 14.892 | 13.705 |
| θ range of data collection/° | 3.16–28.9 | 3.36–32.35 |
| Index range | −14 ≤ h ≤ 14 | −5 ≤ h ≤ 5 |
| −14 ≤ k ≤ 14 | −10 ≤ k ≤ 10 | |
| −21 ≤ l ≤ 20 | −14 ≤ l ≤ 14 | |
| Absorption correction | Analytical, CrysAlisPro11 | |
| No. of reflections collected | 10![[thin space (1/6-em)]](https://www.rsc.org/images/entities/char_2009.gif) 492 492 |
9633 |
| Independent reflections | 2137 | 844 |
| R int | 0.0328 | 0.0235 |
| Completeness to θ = 25° | 99.9% | 99.9% |
| Structure solution | Charge flipping, Superflip6 | |
| Structure refinement | Jana20067 | |
| Extinction coefficient Giso | 0.007(2) | 0.007(2) |
| No. of refined parameters | 75 | 21 |
| No. of constraints | 0 | 0 |
| GooF | 1.20 | 1.56 |
| R 1, wR2 [I > 3σ(I)] | 0.0223, 0.0482 | 0.0116, 0.0399 |
| R 1, wR2 [all data] | 0.0397, 0.0578 | 0.0122, 0.0401 |
| Largest diff. peak & hole/e Å−3 | 1.17, −0.75 | 0.45, −0.29 |
| Atom | Wyck. | x | y | z |
U
eq![[thin space (1/6-em)]](https://www.rsc.org/images/entities/char_2009.gif) a a |
|---|---|---|---|---|---|
| a U eq is defined as one third of the trace of the orthogonalized Uij tensor. | |||||
| Cs1 | 8f | 0.2871(1) | 0.0621(1) | 0.3997(1) | 0.0198(1) |
| Cs2 | 8f | 0.4629(1) | 0.3126(1) | 0.1026(1) | 0.0197(1) |
| Ga2 | 8f | 0.1039(1) | 0.1892(1) | 0.1719(1) | 0.0111(1) |
| Ga2 | 8f | 0.1427(1) | 0.4357(1) | 0.3283(1) | 0.0111(1) |
| S1 | 8f | 0.0407(1) | 0.3123(1) | 0.4151(1) | 0.0129(1) |
| S2 | 8f | 0.2097(1) | 0.0628(1) | 0.0890(1) | 0.0118(1) |
| S3 | 8f | 0.2527(1) | 0.3123(1) | 0.2503(1) | 0.0124(1) |
| S4 | 4e | 0 | 0.0598(1) | 1/4 | 0.0129(5) |
| S5 | 4e | 0 | 0.5649(1) | 1/4 | 0.0132(5) |
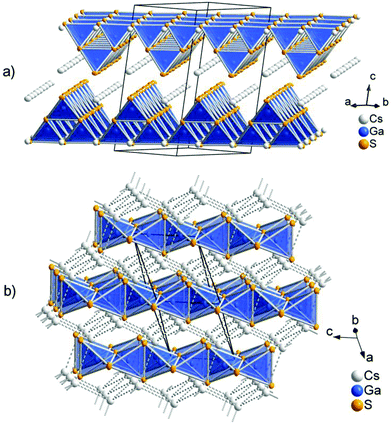
The low-temperature polymorph CsGaS2-mC64 crystallizes in the TlGaSe2 structure type8 like many related compounds MTQ2 (M = Na, K, Rb, Cs, Tl; T = Al, Ga, In; Q = S, Se, Te). The crystal structure of the layered compound features anionic layers 2∞[Ga4S84−], composed of corner-sharing Ga4S10 supertetrahedra. These layers are separated by Cs atoms (Fig. 1). The two independent trivalent gallium sites are tetrahedrally coordinated by the S atoms. The interatomic distances in these tetrahedra range from d(Ga–S) = 2.260(1) Å to d(Ga–S) = 2.308(1) Å. The angles ∠(S–Ga–S) range from 107.17(4)° to 113.35(4)°. These values are in good agreement with comparable compounds, like Cs2Ga2S5, CsGa3S5, CsGaS2-mC16, CsGaSe2, or CsGaTe2.3,4,9 The GaS4 tetrahedra are connected by common corners, forming so-called Ga4S10 supertetrahedra. These corner-sharing supertetrahedra are condensed to anionic layers 2∞[Ga4S84−], which are stacked along [001]. The layers are penetrated by a cationic caesium substructure, formed by two independent Cs sites. The Cs atoms are 6 + 2 coordinated by sulphur, resulting in bicapped trigonal prisms. The interatomic distances within the trigonal prisms range from d(Cs–S) = 3.488(1) Å to d(Cs–S) = 3.583(1) Å. The distances to the capping atoms in the range from d(Cs–S) = 3.741(1) Å to d(Cs–S) = 3.749(1) Å are significantly longer. The CsS8 polyhedra are connected by common edges (S3, S4; S3, S5) and the capping atoms (S1, S2). The caesium atoms form an irregular cationic substructure with distances d(Cs–Cs) below 5 Å in one layer and in the range between d(Cs–Cs) = 5.256(1) Å to d(Cs–Cs) = 5.297(1) Å between two adjacent layers.
The high-temperature polymorph CsGaS2-mC16 crystallizes in the KFeS2![[thin space (1/6-em)]](https://www.rsc.org/images/entities/char_2009.gif) 10 structure type like the isotypic compound CsGaSe2-mC16. The crystal structure was already described by Bronger et al. in 1975.4 In order to obtain state-of-the-art data, we decided to redetermine the crystal structure. The compound features anionic SiS2 analogous chains 1∞[GaS2−] embedded in a cationic Cs substructure (Fig. 1). Gallium has a tetrahedral coordination, formed by four sulphur atoms, with interatomic distances of d(Ga–S) = 2.2823(4) Å and d(Ga–S) = 2.2869(5) Å. These tetrahedra are connected by common edges, thus forming infinite chains along [001]. In the crystal structure, these chains are arranged in a hexagonal rod packing. Caesium is eightfold coordinated by sulphur with distances in the range of d(Cs–S) = 3.6200(5) and d(Cs–S) = 3.7025(4) Å. The Cs+ cations form a topological network similar to the cubic diamond. The interatomic distances range from d(Cs–Cs) = 4.5023(3) Å to d(Cs–Cs) = 4.5850(3) Å.
10 structure type like the isotypic compound CsGaSe2-mC16. The crystal structure was already described by Bronger et al. in 1975.4 In order to obtain state-of-the-art data, we decided to redetermine the crystal structure. The compound features anionic SiS2 analogous chains 1∞[GaS2−] embedded in a cationic Cs substructure (Fig. 1). Gallium has a tetrahedral coordination, formed by four sulphur atoms, with interatomic distances of d(Ga–S) = 2.2823(4) Å and d(Ga–S) = 2.2869(5) Å. These tetrahedra are connected by common edges, thus forming infinite chains along [001]. In the crystal structure, these chains are arranged in a hexagonal rod packing. Caesium is eightfold coordinated by sulphur with distances in the range of d(Cs–S) = 3.6200(5) and d(Cs–S) = 3.7025(4) Å. The Cs+ cations form a topological network similar to the cubic diamond. The interatomic distances range from d(Cs–Cs) = 4.5023(3) Å to d(Cs–Cs) = 4.5850(3) Å.
Thermal analysis
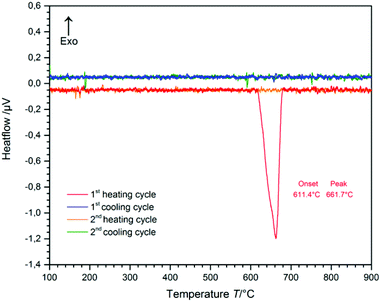
The temperature range of the phase-transition from CsGaS2-mC64 to the high-temperature phase CsGaS2-mC16 was determined by differential thermal analysis (DTA) (Fig. 2). The measurement (heating-/cooling rate 10 °C min−1, 2 cycles) revealed an irreversible transition starting at about 610 °C. After the measurement, the sample was identified as CsGaS2-mC16 by X-ray powder diffraction. The high-temperature phase CsGaS2-mC16 exhibits a melting point of about 1100 °C as shown in Fig. S1 of the ESI.‡Pressure-induced phase-transition
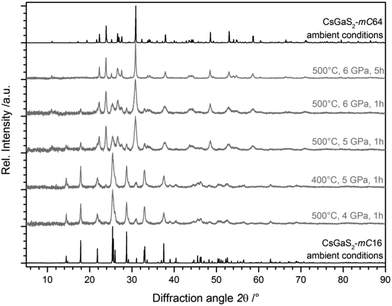
Due to the significant difference (∼10%) of the calculated densities of both polymorphs with ρ(CsGaS2-mC64) ≫ ρ(CsGaS2-mC16), the possibility of a pressure-induced phase-transition of CsGaS2-mC16 was investigated. High-pressure experiments were performed in a belt apparatus as described by Range et al.12 in the pressure region from 1–6 GPa. For the high pressure synthesis, a small pellet of the sample was placed in a graphite crucible. This crucible was placed in a pressure chamber made of pyrophyllite, surrounded by steel cuffs. High pressure was then applied by axial steel stamps. Heating of the samples is achieved by application of appropriate electric current to the graphite crucible. Pressure and temperature were determined by external calibration.The experiments revealed a pressure-induced phase-transition to the low-temperature phase CsGaS2-mC64 at pressures >5 GPa and a temperature of at least 500 °C (Fig. 3). The isotypic compound CsGaSe2![[thin space (1/6-em)]](https://www.rsc.org/images/entities/char_2009.gif) 3 shows a similar difference of the calculated densities of both polymorphs (∼8%). However, the temperature-induced phase-transition to CsGaSe2-mC16 can be reverted by annealing below the transition temperature (∼520 °C). High-pressure treatments of CsGaSe2-mC16 at 6 GPa and temperatures up to 500 °C did not induce a phase-transition. At 6 GPa and temperatures above 500 °C, a phase-transition to CsGaSe2-mC64 occurs. However, this change is most likely caused by the elevated temperature, rather than the high-pressure. No hints for a phase transition are known for the heavier homologous compound CsGaTe2,9f which crystallizes isotypic to CsGaQ2-mC64 (Q = S, Se). We cannot explain the different behaviour of CsGaQ2 (Q = S, Se, Te) at elevated temperatures in detail. However, we suppose that the high-pressure phase transition of CsGaS2-mC16 results from the differences of the crystallographic densities. The densities of the selenide polymorphs differ by 8.2%, whereas the sulphide polymorphs show a difference of 9.6%. Therefore, high pressure supports the formation of the high-density polymorph CsGaS2-mC64. In case of CsGaSe2-mC64 and CsGaSe2-mC16 pressure has a smaller influence and therefore the polymorphs can transform into each another without additional pressure.
3 shows a similar difference of the calculated densities of both polymorphs (∼8%). However, the temperature-induced phase-transition to CsGaSe2-mC16 can be reverted by annealing below the transition temperature (∼520 °C). High-pressure treatments of CsGaSe2-mC16 at 6 GPa and temperatures up to 500 °C did not induce a phase-transition. At 6 GPa and temperatures above 500 °C, a phase-transition to CsGaSe2-mC64 occurs. However, this change is most likely caused by the elevated temperature, rather than the high-pressure. No hints for a phase transition are known for the heavier homologous compound CsGaTe2,9f which crystallizes isotypic to CsGaQ2-mC64 (Q = S, Se). We cannot explain the different behaviour of CsGaQ2 (Q = S, Se, Te) at elevated temperatures in detail. However, we suppose that the high-pressure phase transition of CsGaS2-mC16 results from the differences of the crystallographic densities. The densities of the selenide polymorphs differ by 8.2%, whereas the sulphide polymorphs show a difference of 9.6%. Therefore, high pressure supports the formation of the high-density polymorph CsGaS2-mC64. In case of CsGaSe2-mC64 and CsGaSe2-mC16 pressure has a smaller influence and therefore the polymorphs can transform into each another without additional pressure.
Study of the high-temperature phase-transition kinetics
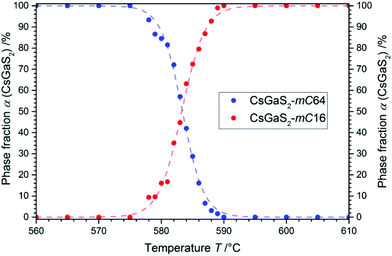
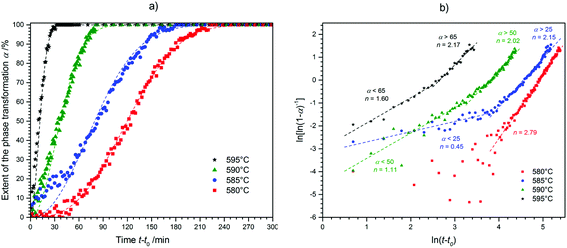
As the different polymorphs of CsGaS2 and CsGaSe2 are isotypic we decided to analyse the phase-transition kinetics similar to CsGaSe2.3 Due to the irreversibility of the thermally induced phase-transition, only the transformation from CsGaS2-mC64 to CsGaS2-mC16 was studied.![[thin space (1/6-em)]](https://www.rsc.org/images/entities/char_2009.gif) 3 on a STOE Stadi P diffractometer (monochromatic Mo-Kα1 radiation, λ = 0.70926 Å) equipped with a Dectris Mythen 1K detector and a high-temperature capillary furnace. The powdered samples were sieved using analytical sieves prior to the experiments. The smallest fraction (0.02–0.04 mm) was used for all measurements. The samples were loaded in quartz capillaries (diameter 0.3 mm). The 2θ-range of 4.55–23.420° (exposure time 60 s per pattern) was detected for all experiments. The powder patterns were analysed using the STOE WinXPOW software package.13 After fitting of the reflection profiles using a pseudo-Voigt peak shape, the phase fractions α were determined from the integrated intensities of the strongest reflections of both polymorphs (CsGaS2-mC64: 223, 14.5°, CsGas2-mC16: 130, 11.6°).
3 on a STOE Stadi P diffractometer (monochromatic Mo-Kα1 radiation, λ = 0.70926 Å) equipped with a Dectris Mythen 1K detector and a high-temperature capillary furnace. The powdered samples were sieved using analytical sieves prior to the experiments. The smallest fraction (0.02–0.04 mm) was used for all measurements. The samples were loaded in quartz capillaries (diameter 0.3 mm). The 2θ-range of 4.55–23.420° (exposure time 60 s per pattern) was detected for all experiments. The powder patterns were analysed using the STOE WinXPOW software package.13 After fitting of the reflection profiles using a pseudo-Voigt peak shape, the phase fractions α were determined from the integrated intensities of the strongest reflections of both polymorphs (CsGaS2-mC64: 223, 14.5°, CsGas2-mC16: 130, 11.6°).
![[thin space (1/6-em)]](https://www.rsc.org/images/entities/char_2009.gif) 5 with the Avrami exponent n and the kinetic rate constant K was used for all experiments as this equation is widely accepted for the study of crystallization kinetics.14 The kinetic parameters n and K were determined by plotting ln[ln(1 − α)−1] against ln(t) as seen in Fig. 5b, the Sharp–Hancock plot (2).15
5 with the Avrami exponent n and the kinetic rate constant K was used for all experiments as this equation is widely accepted for the study of crystallization kinetics.14 The kinetic parameters n and K were determined by plotting ln[ln(1 − α)−1] against ln(t) as seen in Fig. 5b, the Sharp–Hancock plot (2).15| α(t) = 1 − exp[−(Kt)n] | (1) |
| ln[ln(1 − α)−1] = n·ln(t) + n·ln(K) | (2) |
Prior to the determination of the kinetic parameters, the individual incubation times t0 were subtracted. The incubation time was defined as the time until a reflection of the growing phase was observed for the first time. The Avrami exponent n is obtained as the slope of this linear plot whereas K is determined by the intercept of the y-axis. A change in the crystallization mechanism is indicated by a changing slope in the Sharp–Hancock plot. The crystallization mechanisms were determined by comparing a plot of t/t0.5 against α with theoretical curves (Fig. 6).16
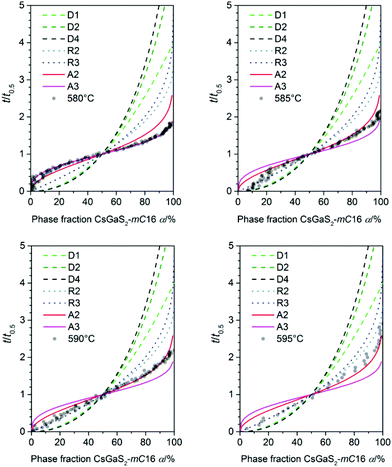 | ||
| Fig. 6 Plot of α against t/t0.5 for all measured temperatures (transparent dots) used for the determination of the crystallisation mechanism (lines) according to literature.16 | ||
The phase-transition to the high temperature phase CsGaS2-mC16 was studied in the temperature region from 580–595 °C with an irradiation time of 60 s (per pattern) for all temperatures. The obtained kinetic parameters and characteristic times are listed in Table 4. A trend of a decreasing time t − t0 for a complete phase-transition can be observed (Fig. 5) with increasing temperatures. This behaviour is in accordance with an increased crystal growth rate. The incubation time t0 decreases also significantly from 34(1) to 1(1) min.
| T/°C | t 0/min | t 0.5/min | Mechanism | Avrami exponent n | Rate constant K/min−1 |
|---|---|---|---|---|---|
| 580 | 34(1) | 109 | A3 | 2.79(3) | 1.1(1) × 10−6 |
| 585 (α < 25) | 20(1) | 84 | R2/R3 | 0.45(5) | 4.3(6) × 10−3 |
| 585 (α > 25) | A2 | 2.15(4) | 0.6(1) × 10−5 | ||
| 590 (α < 50) | 7(1) | 37 | R2/R3 | 1.11(7) | 1.1(2) × 10−2 |
| 590 (α > 50) | A2 | 2.02(5) | 4.8(9) × 10−4 | ||
| 595 (α < 65) | 1(1) | 17 | R2/R3 | 1.60(9) | 1.1(3) × 10−3 |
| 595 (α > 65) | A2 | 2.17(8) | 0.7(1) × 10−3 |
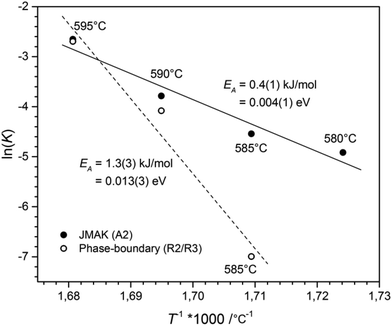
For all experiments in the temperature range from 595 to 585 °C, a dominating one dimensional growth mechanism (A2) with Avrami exponents in the range of 2.17(8) to 2.02(5) can be observed. This observation is in good agreement with the rod-shaped crystallites of CsGaS2-mC16. The initial stages of crystallization, however, are dominated by a phase-boundary controlled mechanism (R2/R3) with significantly smaller n. The extent of this region is subsequently decreasing from α < 65% at 595 °C to α < 25% at 585 °C. This change from a phase-boundary controlled mechanism towards a growth mechanism according to the JMAK theory was also observed for the phase-transition from CsGaSe2-mC64 to CsGaSe2-mC16. The slightly higher Avrami exponents n can probably be attributed to the longer transition times for CsGaS2 and the corresponding higher resolution of the obtained data. A further change in the crystallization mechanism can be observed at 580 °C. Thus, a two-dimensional growth mechanism (A3) with decreasing nucleation rate can be concluded with an Avrami exponent n of 2.79(3) at this temperature. We did not observe a similar change for CsGaSe2.3 The decreasing influence of the phase-boundary controlled growth could possibly result from the higher activation energy EA(R2/R3) for this process (see next paragraph, Fig. 7). At lower temperatures, the thermal energy does not suffice to induce a phase-boundary controlled growth, and only the slower growth mechanism according to the JMAK theory with a smaller activation energy progresses. Even though the experiments revealed the growth of rod-shaped crystallites of CsGaS2-mC16, no significant macroscopic change of the plate-shaped starting material CsGaS2-mC64 is observed. At the initial stage of crystallization, the surface of the plates is covered by a thin layer of the high-temperature polymorph (R2/R3). In the course of the phase-transition, the bulk phase is slowly transformed by growing nuclei. Due to the relatively low temperatures and short transformation times, no macroscopic rod-shaped crystals can grow, and the basic shape of the starting material remains unchanged.
The activation energy for the phase-transition was determined by the Arrhenius equation.17 The plot of T−1 against the logarithm of the rate constant ln(K), see Fig. 7, revealed an activation energy for the phase-boundary controlled process of EA = 1.3(3) kJ mol−1 and EA = 0.4(1) kJ mol−1 for nucleation and growth according to the JMAK theory. These values are in good agreement with the value of EA = 1.0(6) kJ mol−1, obtained for the transition from CsGaSe2-mC64 to CsGaSe2-mC16.3
Vibrational spectroscopy
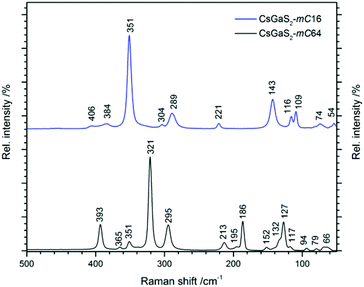
The Raman spectra of CsGaS2-mC64 and -mC16 are shown in Fig. 8. Vibrations in the range 400–290 cm−1 can be attributed to Ga–S stretching modes.9 The Ga–S deformation modes are observed in the region from 290–100 cm−1, whereas all lower vibrations are tentatively assigned to lattice vibrations.9Electronic properties
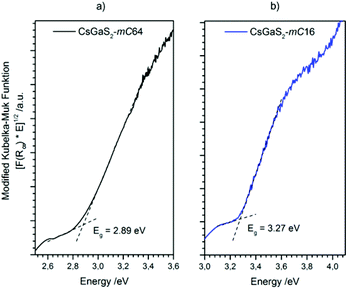
The optical band gaps of both CsGaS2 polymorphs were determined by using UV/Vis diffuse reflectance spectroscopy. A modified Kubelka–Munk function18,19 was used to calculate the absorption data. The extrapolation of the linear parts onto the baseline revealed wide band gaps of 2.89 eV and 3.27 eV for CsGaS2-mC64 and CsGaS2-mC16, respectively (Fig. 9).The electronic band structure of CsGaS2 was further analysed by relativistic DFT calculations using the generalized gradient approximation (GGA) according to Perdew–Burke–Enzerhof (PBE).20 The all electron full-potential local-orbital code FPLO14 was applied for total energy and band structure calculations using the experimentally obtained structures. The calculated direct band gaps of 2.72 eV and 3.34 eV are in good agreement with experimental data and the white powdered samples.
The bonding behaviour of Cs, Ga, and S in the title compound is revealed from the orbital projected density of states (PDOS, Fig. 10). The DOS panels refer to the atomic sites in mC64 (a) and mC16 (b) structures. Despite the fact that there is only one Cs, one Ga and one S site in the modification mC16, but 2 Cs, 2 Ga, and 5 S sites in the modification mC64, similar DOS features are found for equivalent atom types. Due to the similar chemical environment of equivalent atom types, chemical bonding can be discussed in general for the different elements in both structures. Accordingly, Ga–S interactions within the tetrahedra in both polymorphs cause a splitting into Ga-4s and -4p valence- and conduction band contributions. Valence band DOS maxima of Ga-4s are found in the energy range from −4 to −6 eV, and those of Ga-4p between 0 and −4 eV. In the antibonding region (conduction band) again 4s DOS maxima are found at lower energy than the 4p states. As a consequence, the conduction band minimum has to be attributed mainly to Ga-4s states. The DOS maxima for S-3s orbitals are situated around −15 eV (not shown in Fig. 10). Strong contributions of S-3p orbitals below the Fermi energy (0 to −2 eV) form the valence band maximum. They are estimated as non-bonding states. Smaller S-3p DOS peaks below −2 eV and above +3 eV are attributed to covalent gallium sulphur interactions. This observation is in line with the mainly covalent bonding between gallium and the chalcogen atoms as observed for Cs2Ga2S5.9a The larger band gap of CsGaS2-mC16 as compared to Cs2Ga2S5 and CsGaS3![[thin space (1/6-em)]](https://www.rsc.org/images/entities/char_2009.gif) 9b further confirms the assumption of a significant influence of S22− dumbbells on the band gaps of these compounds.9a The bonding character of Cs is mainly ionic, as concluded from unoccupied Cs-6s states.
9b further confirms the assumption of a significant influence of S22− dumbbells on the band gaps of these compounds.9a The bonding character of Cs is mainly ionic, as concluded from unoccupied Cs-6s states.
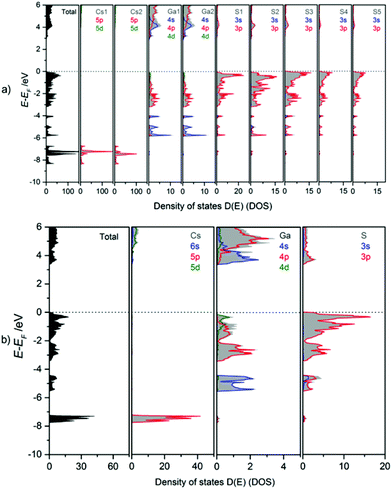 | ||
| Fig. 10 Calculated total (TDOS) and partial density of states (PDOS) for (a) CsGaS2-mC64 and (b) CsGaS2-mC16. | ||
Experimental
Synthesis of the starting materials
Gallium sulphide Ga2S3 was prepared by annealing of a stoichiometric mixture of Ga (Chempur 99.99%) and S (Chempur 99.999%) at 1000 °C for several days. CsN3 was obtained by passing hydrazoic acid (prepared by acidifying an aqueous solution of NaN3) (Sigma-Aldrich 99.0%) into an aqueous solution of Cs2CO3 (Rockwood Lithium 99.9%). Attention: Condensed HN3 is highly explosive. Tools made from transition metals must be avoided.Synthesis of CsGaS2
The title compound was obtained by slow thermal decomposition of CsN3 combined with a stoichiometric mixture of Ga2S3 and sulphur in a silica ampoule under dynamic vacuum conditions. The ampoule was flame sealed after complete decomposition of the azide, and the raw product was annealed at elevated temperatures to yield CsGaS2. Phase pure samples of white CsGaS2-mC64 were obtained after annealing at 500 °C. Phase pure white CsGaS2-mC16 was obtained by annealing at 700 °C. Quenching of the samples was not necessary. It should be noted that some samples of CsGaS2-mC16 had pink colour, like also reported in literature.4 This colour remained even after treatment of the air- and moisture stable samples with water or DMF.Single-crystal X-ray diffraction
Diffraction data of suitable single-crystals were collected on a Rigaku Supernova at ambient temperature using monochromatic Mo-Kα radiation (λ = 0.71073 Å). The obtained diffraction data were corrected for Lorentz- and polarization effects. Absorption was corrected by an analytical absorption correction using the CrysAlisPro software package.11 The resulting data sets had a completeness of 99.9% within 50° 2θ for both modifications. The crystal structures were solved by charge flipping methods using SUPERFLIP6 (implemented in Jana20067) and refined on F2 with Jana20067 using full-matrix least squares methods. The experimental parameters and details of the structure solution and refinement are summarized in Table 1.X-ray powder diffraction
The X-ray powder diffraction experiments were performed on a STOE STADI P diffractometer equipped with a Dectris Mythen 1K detector and a high-temperature capillary furnace. Monochromatic Mo-Kα1 radiation (λ = 0.70926 Å) was used for all experiments. The samples were flame sealed in a 0.3 mm quartz glass capillary and then placed in another 0.5 mm quartz glass capillary due to the furnace architecture. To ensure reproducible results all fine powdered samples were sieved under inert atmosphere using analytical sieves (Retsch GmbH) prior to the experiments (fraction 0.02–0.04 mm grain size). The WinXPOW software package from STOE & Cie13 was used for data collection and processing. The furnace temperature was controlled by a Eurotherm 24.16 controller (ΔT = ±1 °C).Differential thermal analysis
Differential thermal analysis of the compound was performed on a SETARAM TG-DTA 92 16.18 in an evacuated quartz glass ampoule using Al2O3 as reference material. The measurements were performed in the range of 25–1000 °C with a heating- and cooling rate of 10 °C min−1.Vibrational spectroscopy
Raman spectra were recorded on a DXR™ SmartRaman Spectrometer from Thermoscientific (excitation wavelength λ = 532 nm) in the range of 50–1000 cm−1 with a resolution of 0.5 cm−1.UV/Vis spectroscopy
Diffuse reflectance measurements were performed with a Bruins Omega 20 UV/Vis spectrometer using BaSO4 as a reference (100% reflectance). Absorption spectra were calculated thereof by using a modified Kubelka–Munk function.18,19DFT calculations
The first-principles calculations were carried out within the framework of density functional theory (DFT) with exchange–correlation functionals in the generalized gradient approximation (GGA) according to Perdew–Burke–Enzerhof (PBE).20 The full potential local orbital code FPLO1421 was applied for total energy and band structure calculations based on the experimentally obtained structures. FPLO14 applies all electron local basis sets that are described by core and valence functions as implemented in the code. It treats Cs (Z = 55) 1s22s22p63s23p63d104s24p64d10 as core and 5s25p66s15d06p06d07s0 as valence states, Ga (Z = 31) 1s22s22p6 as core and 3s23p63d104s24p14d05s05p0 as valence, S (Z = 16) 1s2 as core and 2s22p63s23p43d04s04p0 as valence states. Outer shells are automatically optimized for each SCF cycle by the code. A k-grid mesh of 12 × 12 × 12 was used. The calculations converged with a maximum divergence of <10−7 Hartree.Conclusions
A new low-temperature polymorph of CsGaS2 was characterized by single-crystal X-ray diffraction. The compound CsGaS2-mC64 shows an irreversible phase-transition to CsGaS2-mC16 at temperatures above 580 °C. Both modifications contain covalently bonded polymeric anions [GaS2−] consisting of condensed GaS4 tetrahedra. Kinetics of the reconstructive phase-transition were studied by in situ high-temperature X-ray diffraction experiments on powder samples. By means of these studies a dominating one-dimensional growth mechanism for the high-temperature modification is found. This is in good agreement with the results obtained for the parent compound CsGaSe2.3 Interestingly, the irreversible temperature-induced phase-transition to the high-temperature polymorph can be reverted by a high-pressure treatment (>5 GPa at 500 °C). The band gaps of both modifications are around 3 eV, which is in good accord with the colourless samples.Acknowledgements
The authors would like to thank Prof. Dr Manfred Scheer (University of Regensburg) for the Raman measurements. We would further like to thank Rockwood-Lithium GmbH for a generous gift of cesium carbonate.Notes and references
- B. Krebs, Angew. Chem., 1983, 95, 113–134 CrossRef CAS.
- (a) J.-J. Zony, F. Bielsa, A. Douillet, L. Hilico, O. Acef, V. Petrov, A. Yelisseyev, L. Isaenko and P. Krinitsin, Opt. Lett., 2007, 32, 1722–1724 CrossRef; (b) V. Pettrov, A. Yelisseyev, L. Isaenko, S. Lobanov, A. Titov and J.-J. Zondy, Appl. Phys. B: Lasers Opt., 2004, 78, 543–546 CrossRef.
- D. Friedrich, M. Schlosser and A. Pfitzner, Cryst. Growth Des., 2016, 16, 3983–3992 CAS.
- D. Schmitz and W. Bronger, Z. Naturforsch., B: Anorg. Chem. Org. Chem., 1975, 30, 491–493 Search PubMed.
- (a) M. Avrami, J. Chem. Phys., 1939, 7, 1103–1112 CrossRef CAS; (b) M. Avrami, J. Chem. Phys., 1940, 8, 212–224 CrossRef CAS; (c) M. Avrami, J. Chem. Phys., 1941, 9, 177–184 CrossRef CAS.
- L. Palatinus and G. Chapuis, J. Appl. Crystallogr., 2007, 40, 786–790 CrossRef CAS.
- V. Petricek, M. Dusek and L. Palatinus, Z. Kristallogr., 2014, 229, 345–352 CAS.
- D. Müller, F. E. Poltmann and H. Hahn, Z. Naturforsch., B: Anorg. Chem. Org. Chem., 1974, 29, 117–118 Search PubMed.
- (a) D. Friedrich, F. Pielnhofer, M. Schlosser, R. Weihrich and A. Pfitzner, Chem. – Eur. J., 2015, 21, 1911–1817 CrossRef PubMed; (b) M. Suseela Devi and K. Vidyasagar, J. Chem. Soc., Dalton Trans., 2002, 4751–4754 RSC; (c) M. Schlosser, V. Frettlöh and H.-J. Deiseroth, Z. Anorg. Allg. Chem., 2009, 635, 94–98 CrossRef CAS; (d) D. Friedrich, M. Schlosser and A. Pfitzner, Z. Anorg. Allg. Chem., 2014, 640, 826–829 CrossRef CAS; (e) V. Winkler, M. Schlosser and A. Pfitzner, Z. Anorg. Allg. Chem., 2015, 641, 549–556 CrossRef CAS; (f) E. J. Wu, M. A. Pell, T. M. Fuelberth and J. A. Ibers, Z. Kristallogr. – New Cryst. Struct., 1997, 212, 91 CAS.
- J. W. Boon and C. H. MacGillary, Recl. Trav. Chim. Pays-Bas, 1942, 61, 910–920 CrossRef CAS.
- Rigaku Oxford Diffraction, CrysAlisPro, Version 1.171.38.37b, 2015 Search PubMed.
- K.-J. Range and R. Leeb, Z. Naturforsch., B: Anorg. Chem. Org. Chem., 1975, 30, 889–895 Search PubMed.
- Stoe & Cie GmbH, WinXPOW, Version 3, Darmstadt, 2014 Search PubMed.
- (a) L. Engelke, M. Schäfer, M. Schur and W. Bensch, Chem. Mater., 2001, 13, 1383–1390 CrossRef CAS; (b) R. Kiebach, M. Schäfer, F. Porsch and W. Bensch, Z. Anorg. Allg. Chem., 2005, 631, 369–374 CrossRef CAS; (c) Y. Zhou, E. Antonova, W. Bensch and G. R. Patzke, Nanoscale, 2010, 2, 2412–2417 RSC.
- J. D. Hancock and J. H. Sharp, J. Am. Ceram. Soc., 1972, 55, 74–77 CrossRef CAS.
- J. H. Sharp, G. W. Brindley and N. N. Achar, J. Am. Ceram. Soc., 1966, 49, 379–382 CrossRef CAS.
- A. T. Kempen, F. Sommer and E. J. Mittemeijer, J. Mater. Sci., 2002, 37, 1321–1332 CrossRef CAS.
- P. Kubelka and F. Munk, Z. Tech. Phys., 1931, 12, 593–603 Search PubMed.
- H. Kisch, Angew. Chem., Int. Ed., 2013, 52, 812–847 CrossRef CAS PubMed.
- J. P. Perdew, K. Burke and M. Enzerhof, Phys. Rev. Lett., 1996, 77, 3865–3868 CrossRef CAS PubMed.
- K. Koepernik and H. Eschrig, Phys. Rev. B: Condens. Matter, 1999, 59, 1743–1757 CrossRef CAS.
Footnotes |
| † Dedicated to Professor Mercouri G. Kanatzidis. |
| ‡ Electronic supplementary information (ESI) available: Anisotropic displacement parameters and interatomic distances and angles of both polymorphs, DTA, and electronic band structures of both polymorphs. See DOI: 10.1039/c6qi00462h |
| This journal is © the Partner Organisations 2017 |

