DOI:
10.1039/C6QI00441E
(Research Article)
Inorg. Chem. Front., 2017,
4, 144-153
Synthesis of Fe/M (M = Mn, Co, Ni) bimetallic metal organic frameworks and their catalytic activity for phenol degradation under mild conditions†
Received
20th October 2016
, Accepted 17th November 2016
First published on 17th November 2016
Abstract
Partial isomorphic substitution of iron in an Fe(BDC)(DMF,F) metal organic framework by manganese, cobalt, and nickel has been described for the first time. Specifically, different amounts of Mn, Co and Ni have been incorporated into the Fe-based framework during a solvothermal crystallization procedure. Several characterization techniques, including XRD, FT-IR, SEM, EDS, TG, XPS and ICP-AES, strongly support the effective incorporation of Mn, Ni and Co into material frameworks. The catalytic performance of these materials was examined in liquid-phase degradation of phenol at 35 °C and near neutral pH of 6.2. The results show that the degradation efficiency can be evidently improved by the incorporation of Mn, while it can be inhibited by the incorporation of Ni. The incorporation of Co shows no remarkable influence on the degradation process. Moreover, the ratios of n(Fe)/n(Mn) in the bimetallic MOFs have a strong impact on the degradation process. The stability and reusability of these catalysts under mild conditions were also demonstrated in this study. This work illustrates the potential of bimetallic MOF structures in developing active heterogeneous catalysts for the degradation process of toxic compounds.
1. Introduction
Increasing contamination and deterioration of water quality has been a serious concern for human health and sustainable development. Wastes from chemical plants, paper mills and farming usually contain aromatics, heavy metals, organic dyes and sulfur- or nitrogen-containing compounds, which are considered as the most important reason for water pollution.1 Among these hazardous chemicals, phenol and phenolic compounds are toxic to aquatic organisms even at quite low concentrations and hence treatment of phenolic pollutants is essential before disposal.2 Advanced oxidation processes, including Fenton, photo-Fenton, sonolysis, ozone oxidation processes and their combination, are used for the removal of phenol. The Fenton process is of great practical significance due to its high efficiency, simplicity, easy reproducibility and easy handling. Despite its environmentally friendly nature, the application of the Fenton process is limited by the final production of ferric iron sludge, which can increase excess costs of disposal. In order to solve this problem, most researchers concentrate on heterogeneous Fenton-like catalysts, such as pillared clays,3 zeolites and mesoporous silica materials.4–7 However, most studies were carried out at 50 °C or even higher temperature at an acidic pH value.8 Therefore, effective catalysts should be designed and fabricated to make the process take place under mild conditions.
Metal–organic frameworks (MOFs) are porous coordination polymers, which are constructed from metal-containing nodes and organic ligands.9–12 Owing to their particularly high surface area, large pore volume, low density and easily tunable framework, MOFs have many potential applications such as separation, gas storage, catalysis, drug delivery, and in batteries.13–19 Recently, MOF-based materials have been studied in heterogeneous selective oxidation of aromatic substrates and cyclooctene,20–22 olefin hydrogenation, 4-nitrophenol reduction and CO oxidation,23 Knoevenagel condensation and the Suzuki coupling reaction.24,25 Besides, some studies have dealt with photocatalytic properties of MOFs,26 such as hybrid CdS/UiO-66, UiO-67, graphitic carbon nitride/MIL-125(Ti), Fe(II)@MIL-100(Fe), Ag2O/Cu(tpa)(dmf) and MIL-53(Fe).27–33
The catalytic activity observed for MOFs is concerned with their metallic components, either as isolated metal centers or metal clusters.10 Pristine MOFs doped or incorporated with another one or more metal centers have attracted much attention in recent years, because this combination may enhance their particular activity.34,35 For example, MOF-5 is moisture sensitive even under atmospheric conditions. In order to overcome this drawback, Ni(II)-doped MOF-5 was obtained through a solvothermal method.36 HKUST-1 is a MOF material widely used as an adsorbent for the separation of CO2, which can be chemically reduced by doping alkali metals (Li, Na and K).37 CO2 adsorption tests showed that the storage capacity of HKUST-1 doped with moderate quantities of Li+, Na+ or K+ individually was greater than that of the unmodified HKUST-1. Zn and Cu are adjacent in the periodic table of elements, and they have similar features, thus a bimetallic Zn/Cu-BTC material was synthesized via a microwave-assisted method.38 Due to the synergetic effect between Cu and Zn, this Zn/Cu-BTC exhibited higher desulfurization capacity than Cu-BTC and those reported zeolites.
Inspired by the possibility to enhance catalytic performance through introducing a new metal component into MOFs, a series of new bimetallic Fe/M-MOFs (Mn, Co, Ni) were successfully synthesized via a direct solvothermal method in this work. The major objective of this work is to evaluate the performance of the new bimetallic MOFs as heterogeneous Fenton-like catalysts. The textural and surface chemistry features of these materials were analyzed and linked to their catalytic behaviors in phenol degradation. As expected, the catalytic performance of the Fe/Mn-MOF samples was higher than that of the original Fe-MOFs, which could be attributed to the cooperative effect of Fe and Mn. Furthermore, the stability of the catalysts was also assessed in consecutive runs. A comparison of catalytic properties was made among the bimetallic Fe/Mn-MOF, Fe/Co-MOF and Fe/Ni-MOF materials. However, it turned out that the Fe/Co and Fe/Ni samples didn't perform as well as the Fe/Mn-MOFs.
2. Experimental
2.1 Materials
Terephthalic acid (1,4-BDC) was purchased from Aladdin. Ferrous chloride tetrahydrate (FeCl2·4H2O), manganese(II) chloride tetrahydrate (MnCl2·4H2O), cobalt chloride hexahydrate (CoCl2·6H2O), nickel chloride hexahydrate (NiCl2·6H2O), N,N-dimethylformamide (DMF), methanol, hydrofluoric acid (HF), phenol and hydrogen peroxide (H2O2) were obtained from Tianjin Kemiou Chemical Reagent Co., Ltd (China). All reagents were used as received without further purification.
2.2 Sample preparation
Fe(BDC)(DMF,F) was prepared through a solvothermal method similar to MIL-53(Fe) in the literature.39,40 In a typical synthesis, terephthalic acid (4 mmol, 0.67 g) and FeCl2·4H2O (4 mmol, 0.80 g) were dissolved in 20 mL DMF, respectively. An ultrasonic-assisted or a stirring method was adopted to accelerate the dissolution. Then the two solutions were transferred into a 100 mL Teflon-lined autoclave, and HF (0.8 mL, 5 M) was added to the solution. The resulting mixture was agitated for 10 minutes by using an ultrasonic instrument. Finally, the autoclave was kept in an oven at 150 °C for 3 days. After being cooled to room temperature in air, the sample was obtained by centrifugation and washed with DMF, methanol and water. The product was dried at 60 °C in a vacuum oven. Moreover, a series of Fe/M-MOFs (Fe/Mn, Fe/Co and Fe/Ni) were synthesized, individually, based on the above procedures. The specific description is presented in Table 1.
Table 1 Synthetic parameters of the bimetallic MOF samples
| Sample |
n(FeCl2)/mmol |
n(MCl2)/mmol |
n(FeCl2)/n(MCl2) |
| Fe(BDC)(DMF,F) |
4.0 |
0 |
— |
| Fe/M-MOF-91 |
3.60 |
0.40 |
9![[thin space (1/6-em)]](https://www.rsc.org/images/entities/char_2009.gif) :1 :1 |
| Fe/M-MOF-71 |
3.50 |
0.50 |
7:1 |
| Fe/M-MOF-51 |
3.33 |
0.67 |
5:1 |
| Fe/M-MOF-31 |
3.0 |
1.0 |
3:1 |
| M-MOF |
0 |
4.0 |
0 |
In order to compare the structural change, Mn-MOFs, Co-MOFs and Ni-MOFs were synthesized, respectively, adopting a method similar to the above Fe(BDC)(DMF,F). 4 mmol MCl2·xH2O (M = Mn, Co or Ni) and terephthalic acid (4 mmol, 0.67 g) were separately dissolved in 20 mL DMF. HF (0.8 mL, 5 M) was added into the mixed solution. Then the mixture was poured into a 100 mL autoclave, stirred and placed in an oven at 150 °C for 3 days. The subsequent treatment was analogous to that of the Fe(BDC)(DMF,F) samples.
2.3 Characterization
Powder X-ray diffraction (XRD) patterns were recorded on a Rigaku SmartLab(9) diffractometer, using Cu Kα X-rays at a scanning rate of 8° min−1 between 5° and 50°. Fourier transform infrared (FT-IR) spectra were recorded on an Equinox55 spectrometer (Bruker, Germany) by means of the KBr pellet technique. The morphology and energy dispersive spectra (EDS) of the synthesized samples were observed using a field-emission scanning electron microscope (Nova NanoSEM 450) at an accelerating voltage of 10.0 kV. Thermal behavior was evaluated by using an SDT Q600 thermogravimetric analyzer (TA Instruments, USA). X-ray photoelectron spectra (XPS) of all samples were recorded on a VG ESCALAB250 Electron Spectrometer with monochromatic Al Kα (1486.6 eV) at 15 kV and 10 mA, and all binding energies were referenced to the C 1s peak (284.6 eV). The amount of iron and manganese was analyzed by using an inductively coupled plasma-atomic emission spectrometer (Optima 2000DV, USA). The pH value was measured by using a pH meter (PHSJ-3F) at room temperature.
2.4 Degradation experiments
The degradation test of phenol was executed in a batch reactor. A total of 10 mg previously treated catalyst, 25 mL aqueous solution of 1000 mg L−1 phenol and 6.22 mL 0.60 mol L−1 hydrogen peroxide (H2O2) were added into the batch glass reactor. The molar ratio of H2O2/phenol was 14, which was consistent with their stoichiometric ratio in the Fenton process. The pH of the reaction mixture was not controlled, and the initial pH was 6.2. The reaction was conducted at 35 °C for 3 hours, and the residual H2O2 was measured by iodometric titration. The liquid product was analyzed on an Agilent high performance liquid chromatograph 1200 series (HPLC 1200) with an Eclipse XDB-C18 (150 mm × 4.6 mm × 5 μm) column. The conversion of COD was determined by the potassium dichromate oxidation method.
3. Results and discussion
3.1 Structure analysis
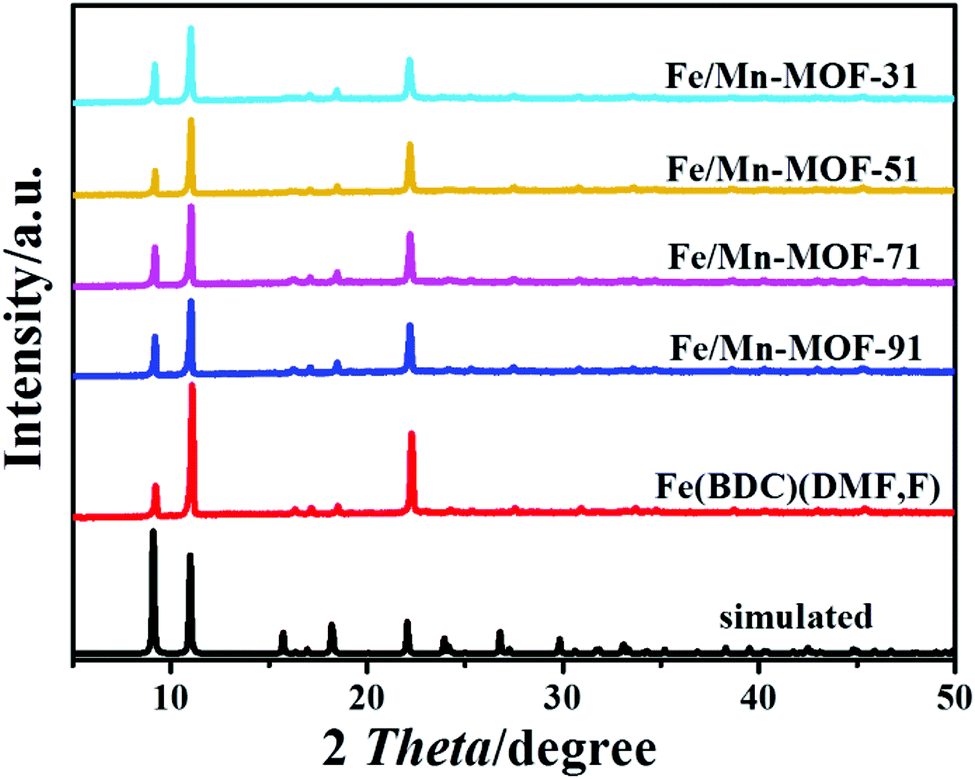
Fig. 1 shows that the sample synthesized with FeCl2 had the characteristic peaks of Fe(BDC)(DMF,F), as previously reported in the literature.41 The intensity of these peaks differed from that of the simulated pattern, which may be due to the difference in the synthetic methods. The four Mn-incorporated MOFs displayed the same XRD patterns as Fe(BDC)(DMF,F) with little decrease in intensity, suggesting that there was no change in the crystal structure after the incorporation of manganese. No peak belonging to manganese species, like manganese oxides or manganese salts, was detected, possibly due to the partial isomorphic substitution of iron atoms by manganese atoms. Similar to the four Mn-incorporated samples, the XRD patterns of the Fe/Co and Fe/Ni samples were characteristic Fe(BDC)(DMF,F) without extra peaks (shown in Fig. S1 and S2†). The sample synthesized with CoCl2 turned out to be cobalt oxide, and the one prepared with NiCl2 was a Ni-BDC material.42 The XRD patterns of the synthesized Mn-MOFs (Fig. S3†) were in good agreement with that of the typical Mn3(1,4-BDC)3(μ-DMF)2.43
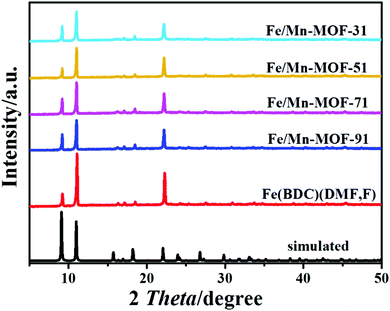 |
| | Fig. 1 XRD patterns of the samples synthesized with FeCl2 and MnCl2. | |
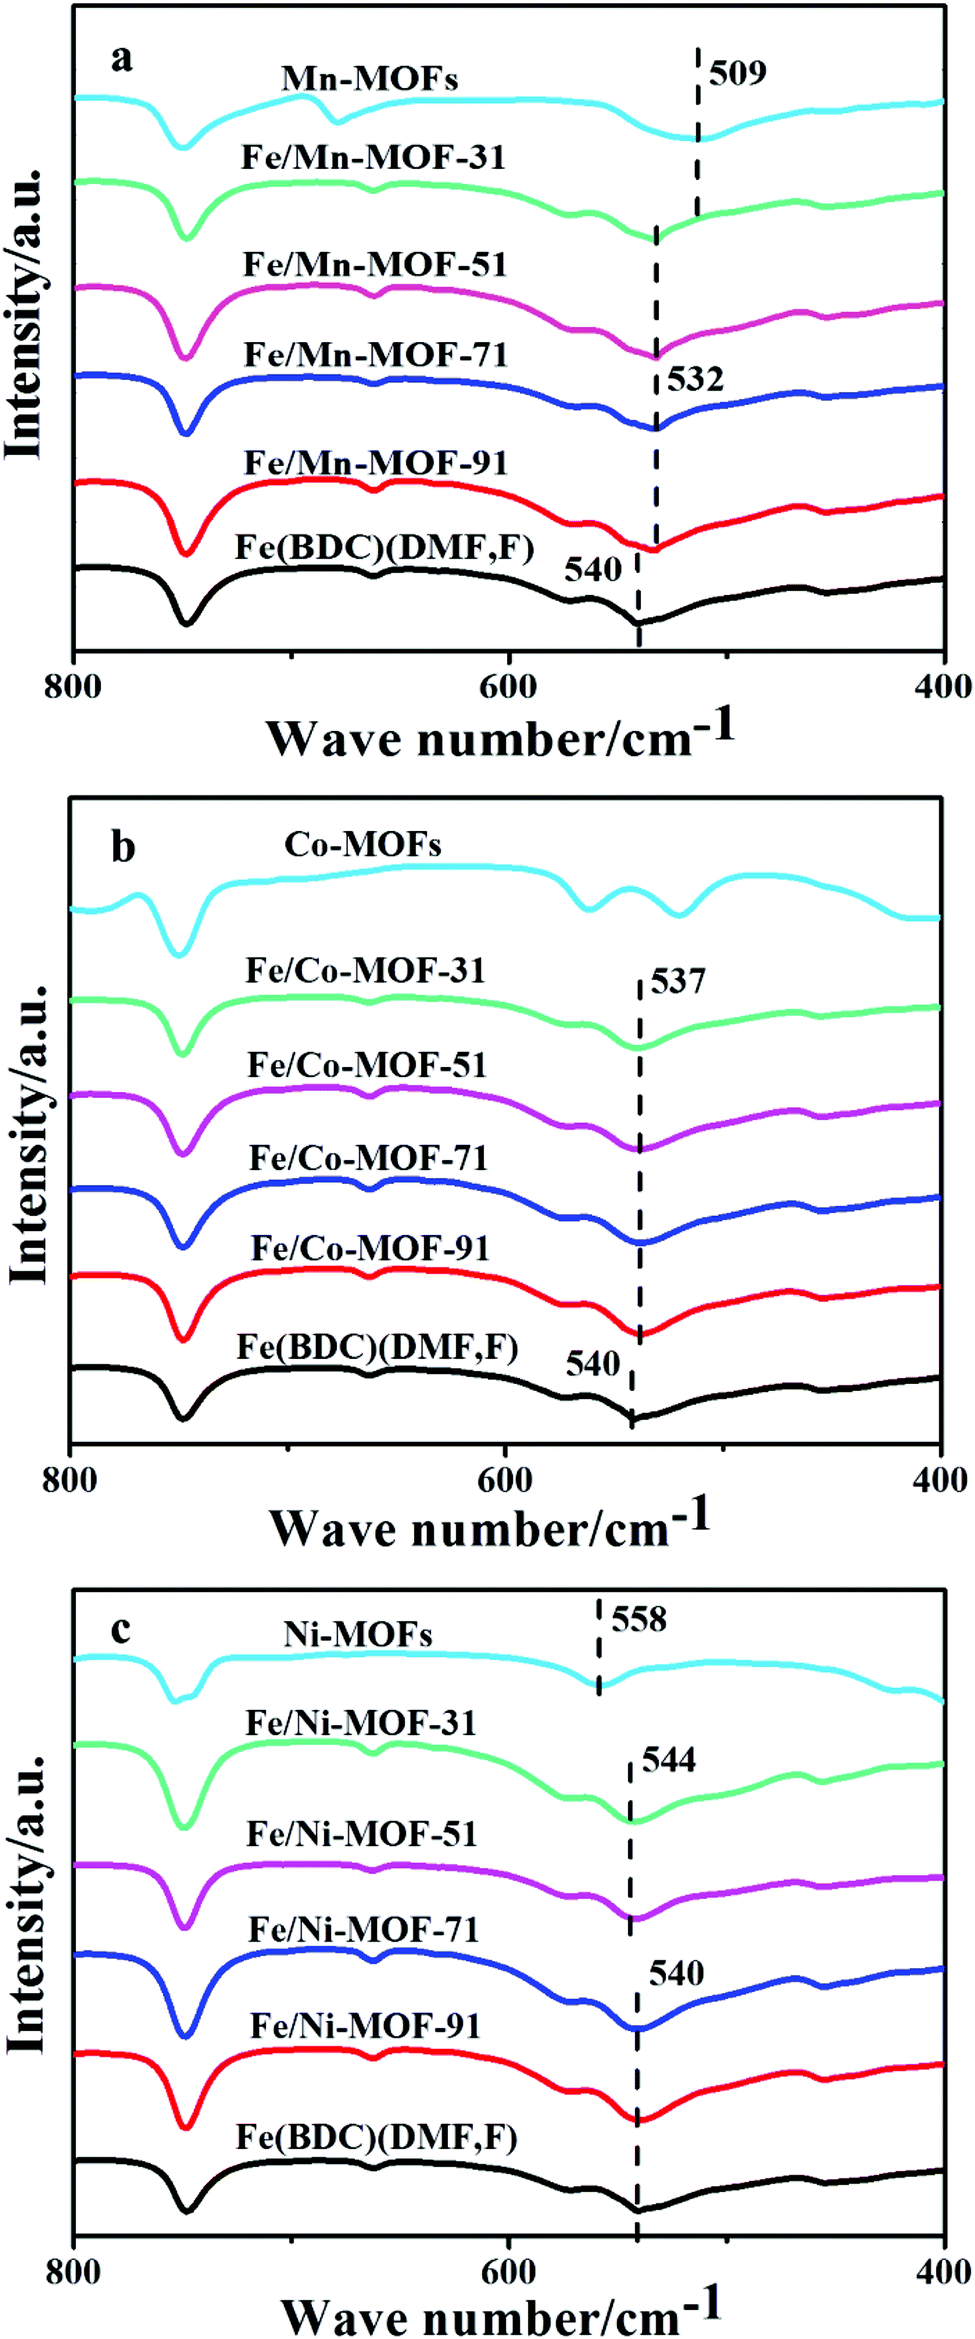
The FT-IR spectra illustrated that these Fe/Mn-MOFs, Fe/Co-MOFs and Fe/Ni-MOFs all displayed similar peaks in general, as shown in Fig. S4.† The typical absorption peaks were observed at 1657, 1560, 1373, 1017 and 750 cm−1, which could be attributed to the vibration of the carboxylate groups.33 The broad peak at 3440 cm−1 refers to the stretching vibration of the O–H from the surface adsorbed water molecules. The peak at 750 cm−1 corresponds to the C–H bending vibration of benzene. In order to clearly demonstrate the difference among these curves, partial magnification of the FT-IR spectra is shown in Fig. 2a. For Fe(BDC)(DMF,F), the absorption band at 540 cm−1 is the characteristic stretching vibration of Fe–Olinker mode,44,45 while for the Mn-MOFs, Mn3(1,4-BDC)3(μ-DMF)2, the absorption of Mn–Olinker mode was seen at 509 cm−1.46 All of the four Mn-incorporated samples displayed a weak band at 532 cm−1, which was 8 cm−1 lower than that of the Fe(BDC)(DMF,F). This decrease signified modification in these Fe/Mn-MOFs, which was caused by the incorporation of Mn into these frameworks. As for the Fe/Co-MOFs and Fe/Ni-MOFs (Fig. 2b and c), they present absorption bands at 537 cm−1 and 544 cm−1, respectively, which reflected a slight structure modification in these frameworks. Therefore, the results of XRD analysis and FT-IR spectra doubly confirmed the formation of bimetallic Fe/Mn-MOFs, Fe/Co-MOFs and Fe/Ni-MOFs.
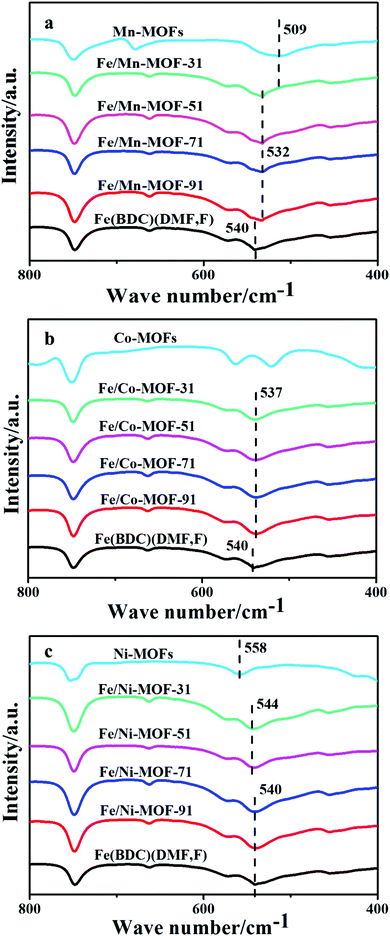 |
| | Fig. 2 Partial magnification of the FT-IR spectra of the Fe/Mn-MOFs (a), Fe/Co-MOFs (b) and Fe/Ni-MOFs (c). | |
3.2 Morphology and elemental analysis
In order to investigate the morphologies of these Fe/Mn-MOF samples, SEM images were collected and shown in Fig. 3. The images confirmed that these four Mn-incorporated samples present a uniform triangular prism structure similar to that of the Fe(BDC)(DMF,F). This illustrates that the incorporation of Mn does not lead to significant changes in morphology and particle size. In addition, EDS elemental mapping was performed for the bimetallic Fe/Mn-MOFs as shown in Fig. 4. For the four samples, the SEM images almost completely correspond to the images of the EDS mapping of Fe and Mn. The Fe mapping follows the structures of the Fe/Mn-MOF crystals, and the Mn mapping is simultaneously detected and consistent with the Fe mapping, thereby indicating that Mn atoms are well dispersed in the Fe/Mn-MOF crystals. The SEM images of the Fe/Co-MOFs and Fe/Ni-MOFs are shown in Fig. S5 and S6,† respectively. Similarly, these two series of Fe/M-MOFs all had the same shape in morphology like the Fe/Mn-MOFs. The EDS of these samples reveal the existence of the well-dispersed Fe, Co and Ni ions (Fig. S7 and S8†). These results also demonstrate the formation of Fe/Mn-MOFs, Fe/Co-MOFs and Fe/Ni-MOFs.
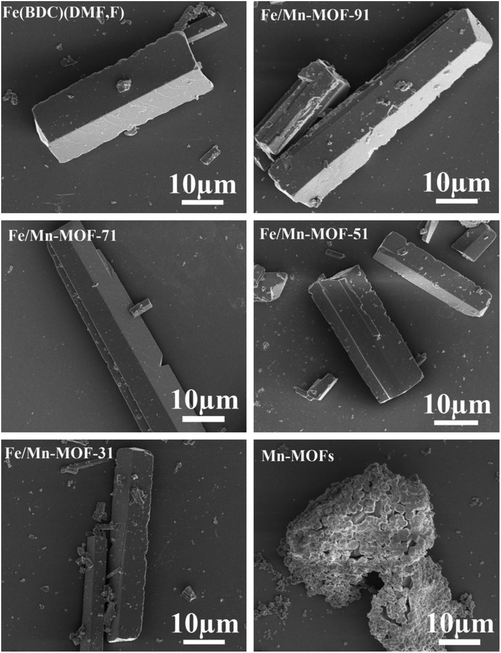 |
| | Fig. 3 SEM images of the Fe/Mn-MOFs. | |
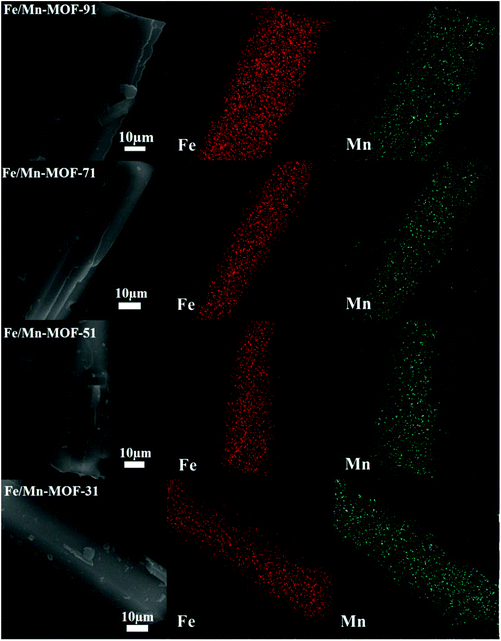 |
| | Fig. 4 EDS mapping of metal elements in the four Fe/Mn-MOFs. | |
As shown in Table 2, the contents of Fe and Mn, and the real ratio of n(Fe)/n(Mn) in these four Fe/Mn-MOFs were determined by ICP-AES. The ratios of n(Fe)/n(Mn) in these samples are close to the ratios of n(FeCl2)/n(MnCl2) in the feed solutions. The data of the Fe/Co-MOFs and Fe/Ni-MOFs are shown in Tables S1 and S2.† The real ratios of n(Fe)/n(Co) are quite far from the experimental ratios, while the ratios of n(Fe)/n(Ni) approach the experimental ratios. The contents of cobalt in the Fe/Co-MOFs are much smaller than the manganese in the Fe/Mn-MOFs and the nickel in the Fe/Ni-MOFs. This illustrates that the incorporation of cobalt into the framework is more difficult than that of the manganese and nickel.
Table 2 The contents of Fe and Mn and the real ratio of n(Fe)/n(Mn) in these Fe/Mn-MOFs
| Sample |
Fe/Mn-MOF-91 |
Fe/Mn-MOF-71 |
Fe/Mn-MOF-51 |
Fe/Mn-MOF-31 |
| Fe/wt% |
12.48 |
11.35 |
10.0 |
9.35 |
| Mn/wt% |
1.38 |
1.59 |
2.16 |
3.19 |
|
n(Fe)/n(Mn) |
8.88 |
7.01 |
4.55 |
2.88 |
3.3 Thermogravimetric analysis
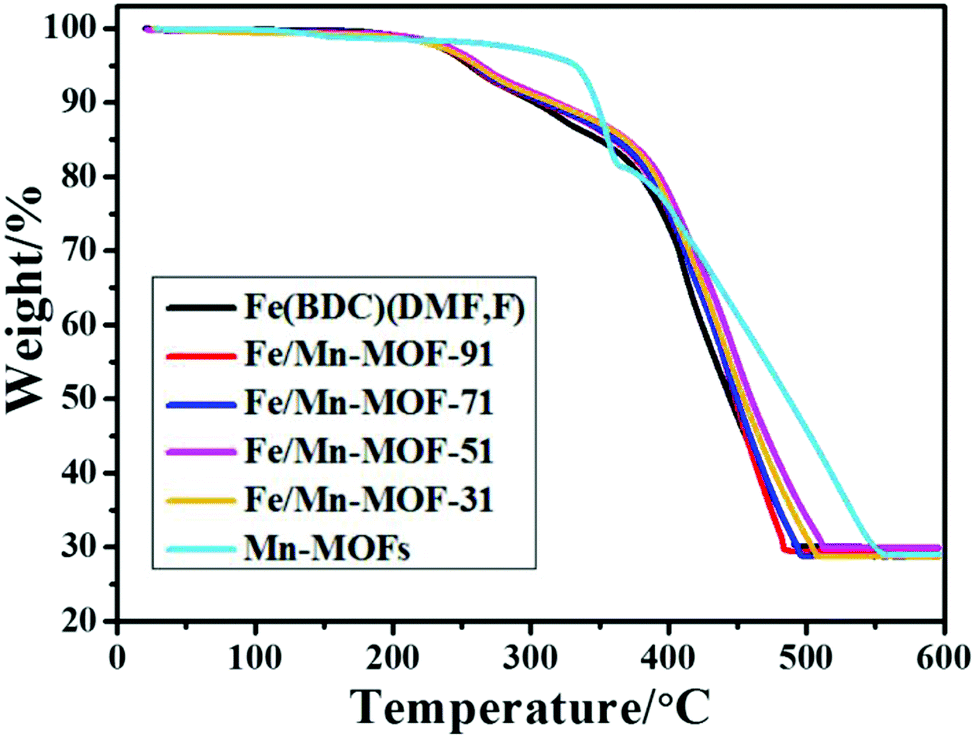
As shown in Fig. 5, thermogravimetric analysis profiles of Fe(BDC)(DMF,F) and the four Fe/Mn-MOF materials all displayed two main steps of weight loss. The first weight loss in the temperature range of 20–300 °C can be attributed to the loss of guest molecules, such as adsorbed water and DMF. The second step is due to the decomposition of organic linkers. While Mn-MOFs exhibited two main steps of weight loss in the temperature range from 320 to 550 °C, indicating that the framework is stable up to 320 °C, a little weight loss of 4.96% was observed between 20 and 320 °C, which was assigned to desorption of moisture and solvent molecules. The TG curves of the Fe/Co-MOFs and Fe/Ni-MOFs are shown in Fig. S9 and S10,† and they all present similar descending trend to that of the Fe(BDC)(DMF,F). This demonstrates that the incorporation of Mn, Co and Ni has little impact on the thermal stability of the frameworks.
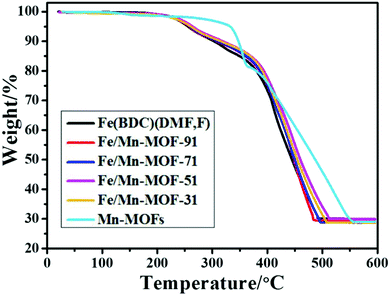 |
| | Fig. 5 TG curves of the Fe/Mn-MOFs. | |
3.4 Chemical state analysis
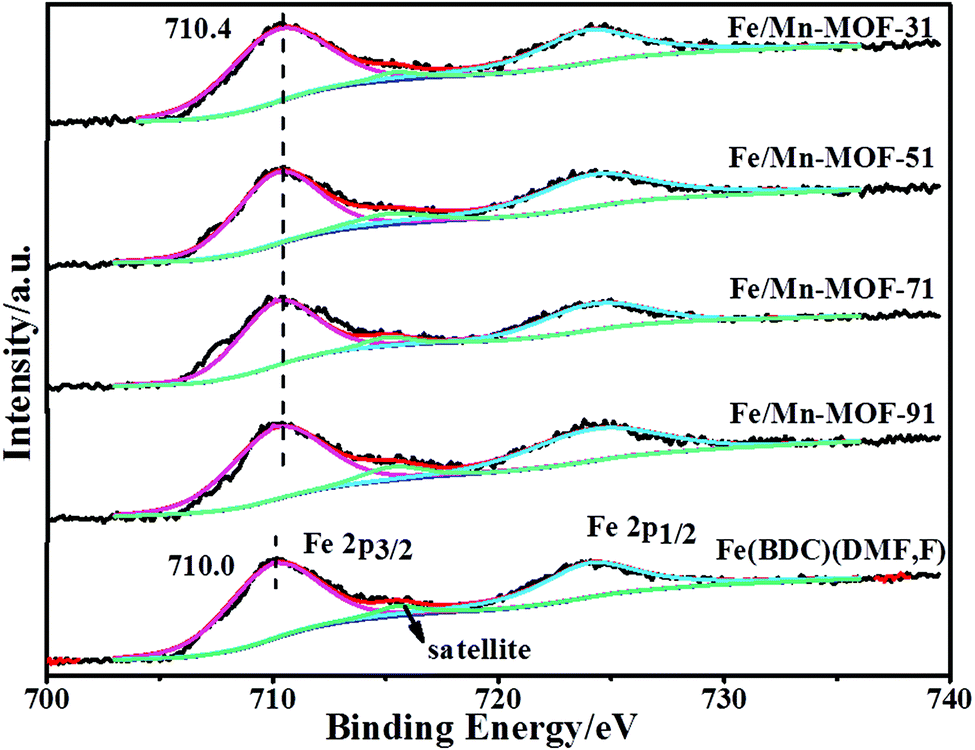
XPS tests were carried out to identify the chemical state and binding energy of Fe and Mn on the surface of the Fe/Mn-MOF materials. The XPS spectra of Fe 2p for Fe(BDC)(DMF,F) are shown in Fig. 6. The binding energies centered at 710.0 and 724.2 eV were ascribed to Fe(III) cations.47 The shake-up satellite peak at 715.5 eV was the fingerprint of Fe(III) species, which indicated that the surface iron mainly present in the Fe(III) oxidation state. The spectra for all the four Fe/Mn-MOF samples were similar to that of the Fe(BDC)(DMF,F), implying that the chemical state of the surface iron was the same after the incorporation of Mn into these frameworks. However, the binding energy of Fe 2p3/2 varied after the incorporation of Mn into the framework. As can be seen in Fig. 6, the binding energy of the four bimetallic samples was 0.4 eV higher than that of the pristine Fe-MOFs, which illustrated that the cloud density of the surface Fe of these samples was lower after the incorporation of Mn.
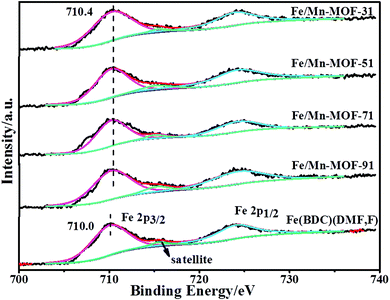 |
| | Fig. 6 XPS spectra of Fe 2p for the Fe/Mn-MOFs and Fe(BDC)(DMF,F). | |
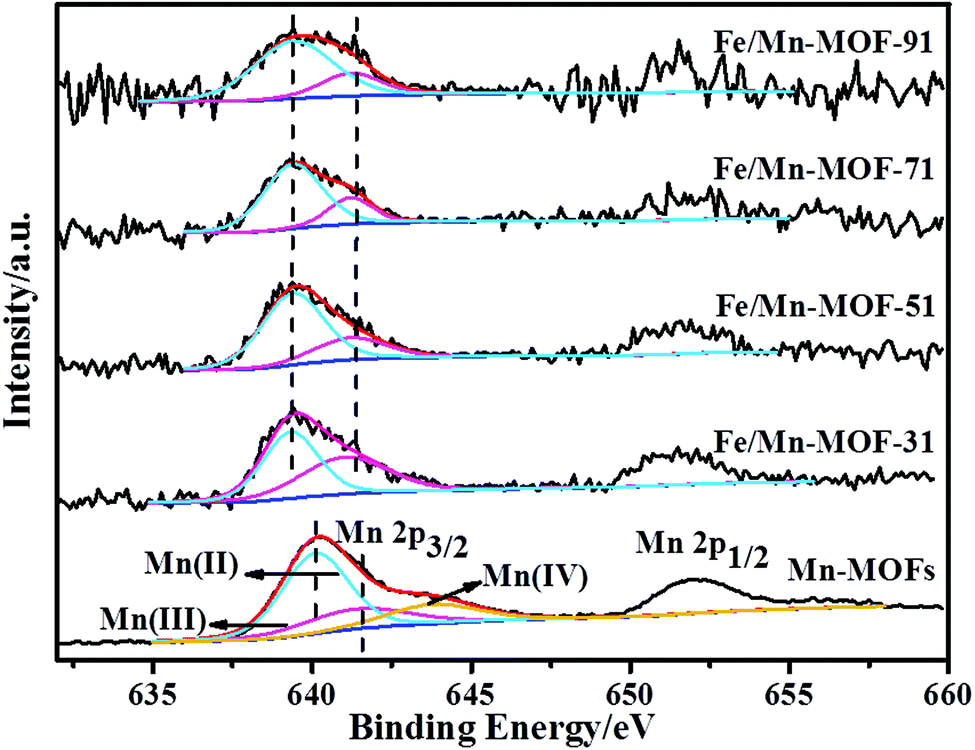
Fig. 7 displays the Mn 2p spectra of the Mn-MOFs and the four Fe/Mn-MOFs. Two main peaks corresponding to Mn 2p3/2 and Mn 2p1/2 were observed in the range of 635–660 eV. The asymmetric Mn 2p3/2 peak confirmed the presence of mixed-valence manganese. Therefore, the manganese oxidation states were further analyzed by deconvolution. For the Mn-MOFs (a), the Mn 2p3/2 peak can be deconvoluted into three characteristic peaks that are assigned to Mn(II) (640.1 eV), Mn(III) (641.4 eV), and Mn(IV) (643.8 eV), respectively. This is consistent with the literature.48 However, the spectra of the four Mn-incorporated samples were different from that of the Mn3(1,4-BDC)3(μ-DMF)2. The Mn 2p3/2 peak consisted of two overlapping peaks, Mn(II) at 639.4 eV, and Mn(III) at 641.2 eV, which indicated that the Mn species mainly existed in the form of Mn(II) and Mn(III) with no Mn(IV) on the surface of these four samples. In contrast to Mn3(1,4-BDC)3(μ-DMF)2, the binding energy of Mn(II) and Mn(III) was a little lower in these four Fe/Mn-MOFs, which means that the cloud density of the surface Mn of these four samples was higher. This result is consistent with the above Fe 2p result, which further verifies the incorporation of Mn into these frameworks.
 |
| | Fig. 7 XPS spectra of Mn 2p for the Fe/Mn-MOFs and Mn-MOFs. | |
3.5 Catalytic performance
The catalytic performance of the bimetallic MOFs was evaluated in the liquid-phase degradation of phenol under mild conditions. The results of several blank runs are presented in Table S3.† Based on the summary of the blank runs, phenol conversion and thermal decomposition of H2O2 were negligible in either case. To rule out the possibility that the catalysis occurs homogeneously in the phenol solution, a series of hot filtration experiments were performed under the same reaction conditions (Fig. S11†). After 30 minutes of reaction, the solid catalyst was removed from the reaction mixture by filtration at the reaction temperature, and the resulting solution was continually analyzed at the same reaction temperature for an additional 150 minutes. However, the conversions of phenol on the Fe/Mn-MOFs, Fe/Co-MOFs and Fe/Ni-MOFs remained unchanged, implying that the degradation of phenol is predominantly heterogeneous and stops completely after the removal of solid catalysts. This hot filtration test verifies the heterogeneity of these samples in this liquid-phase catalysis.
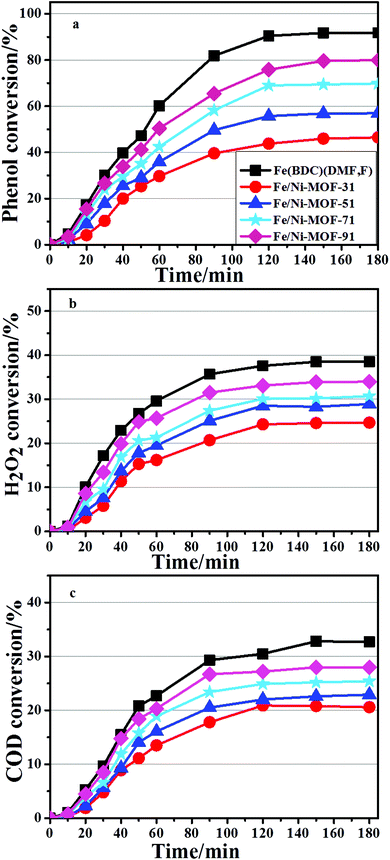
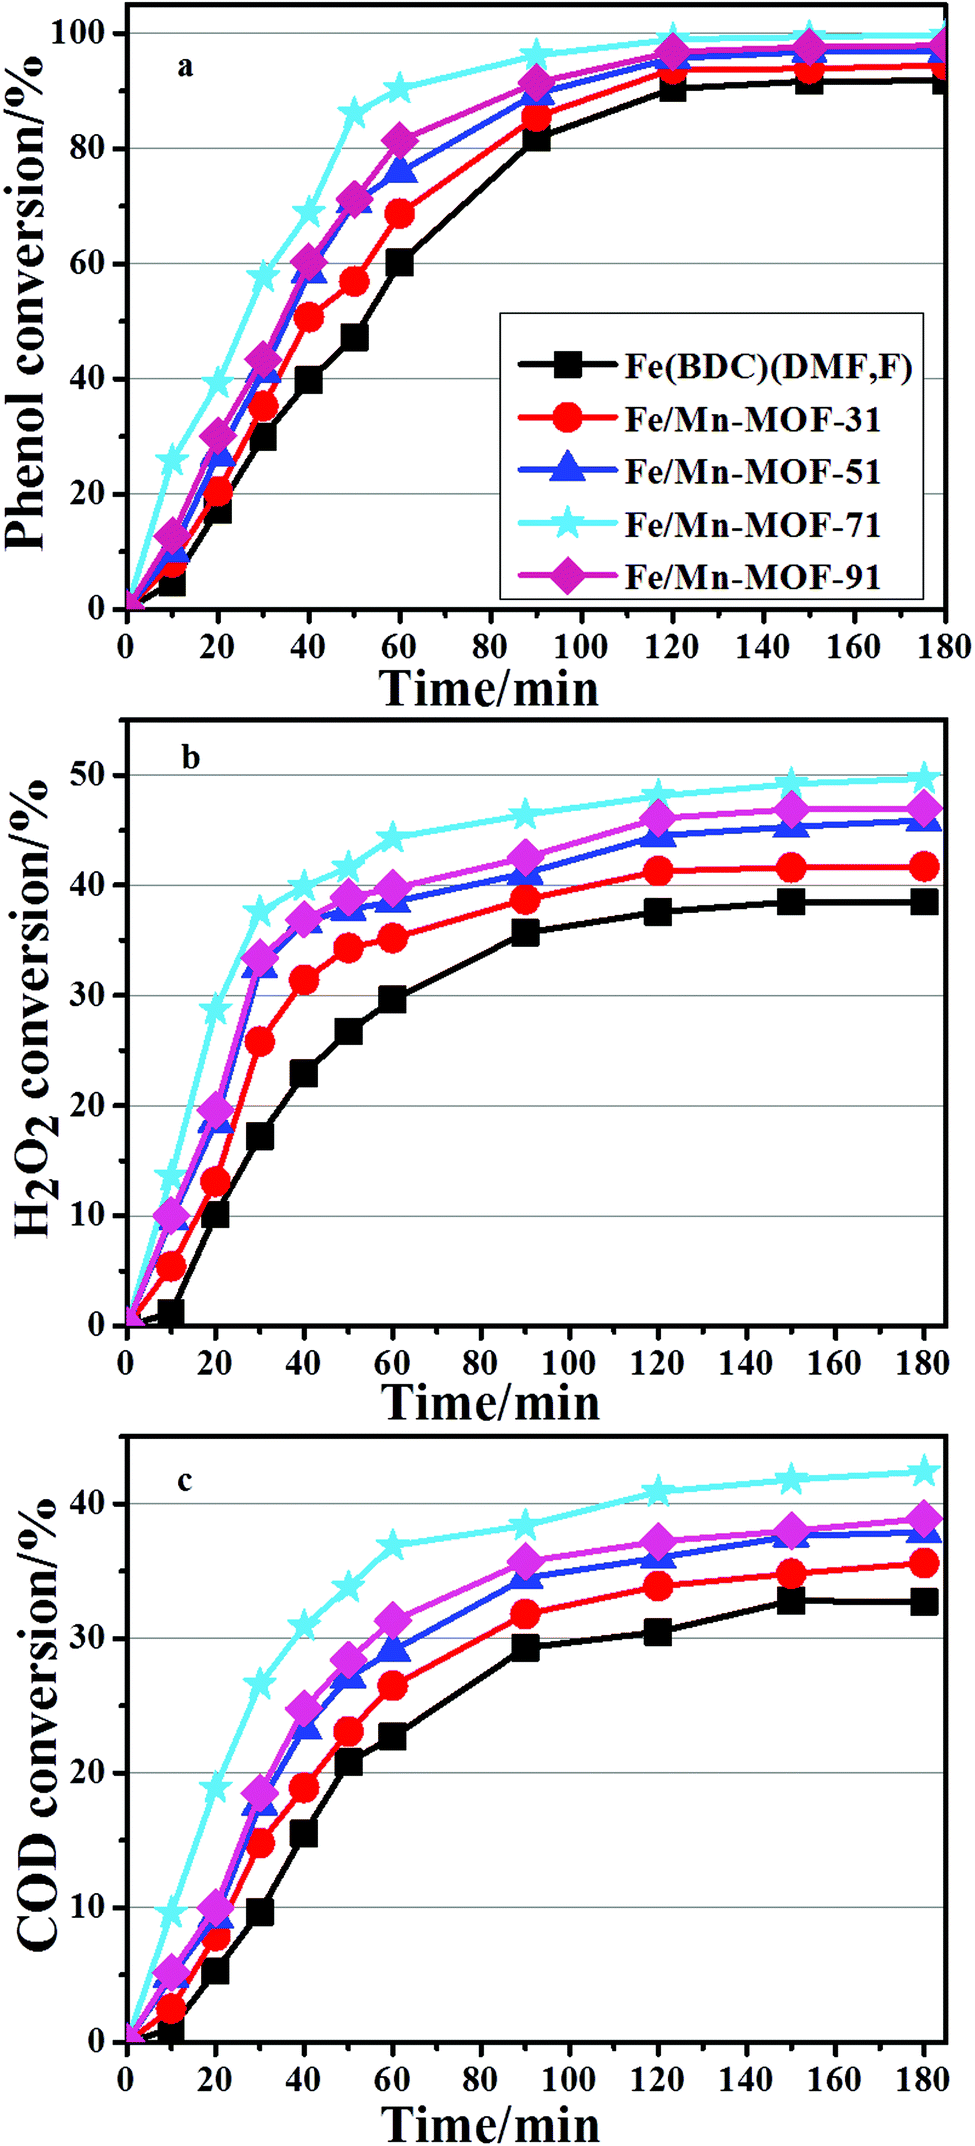
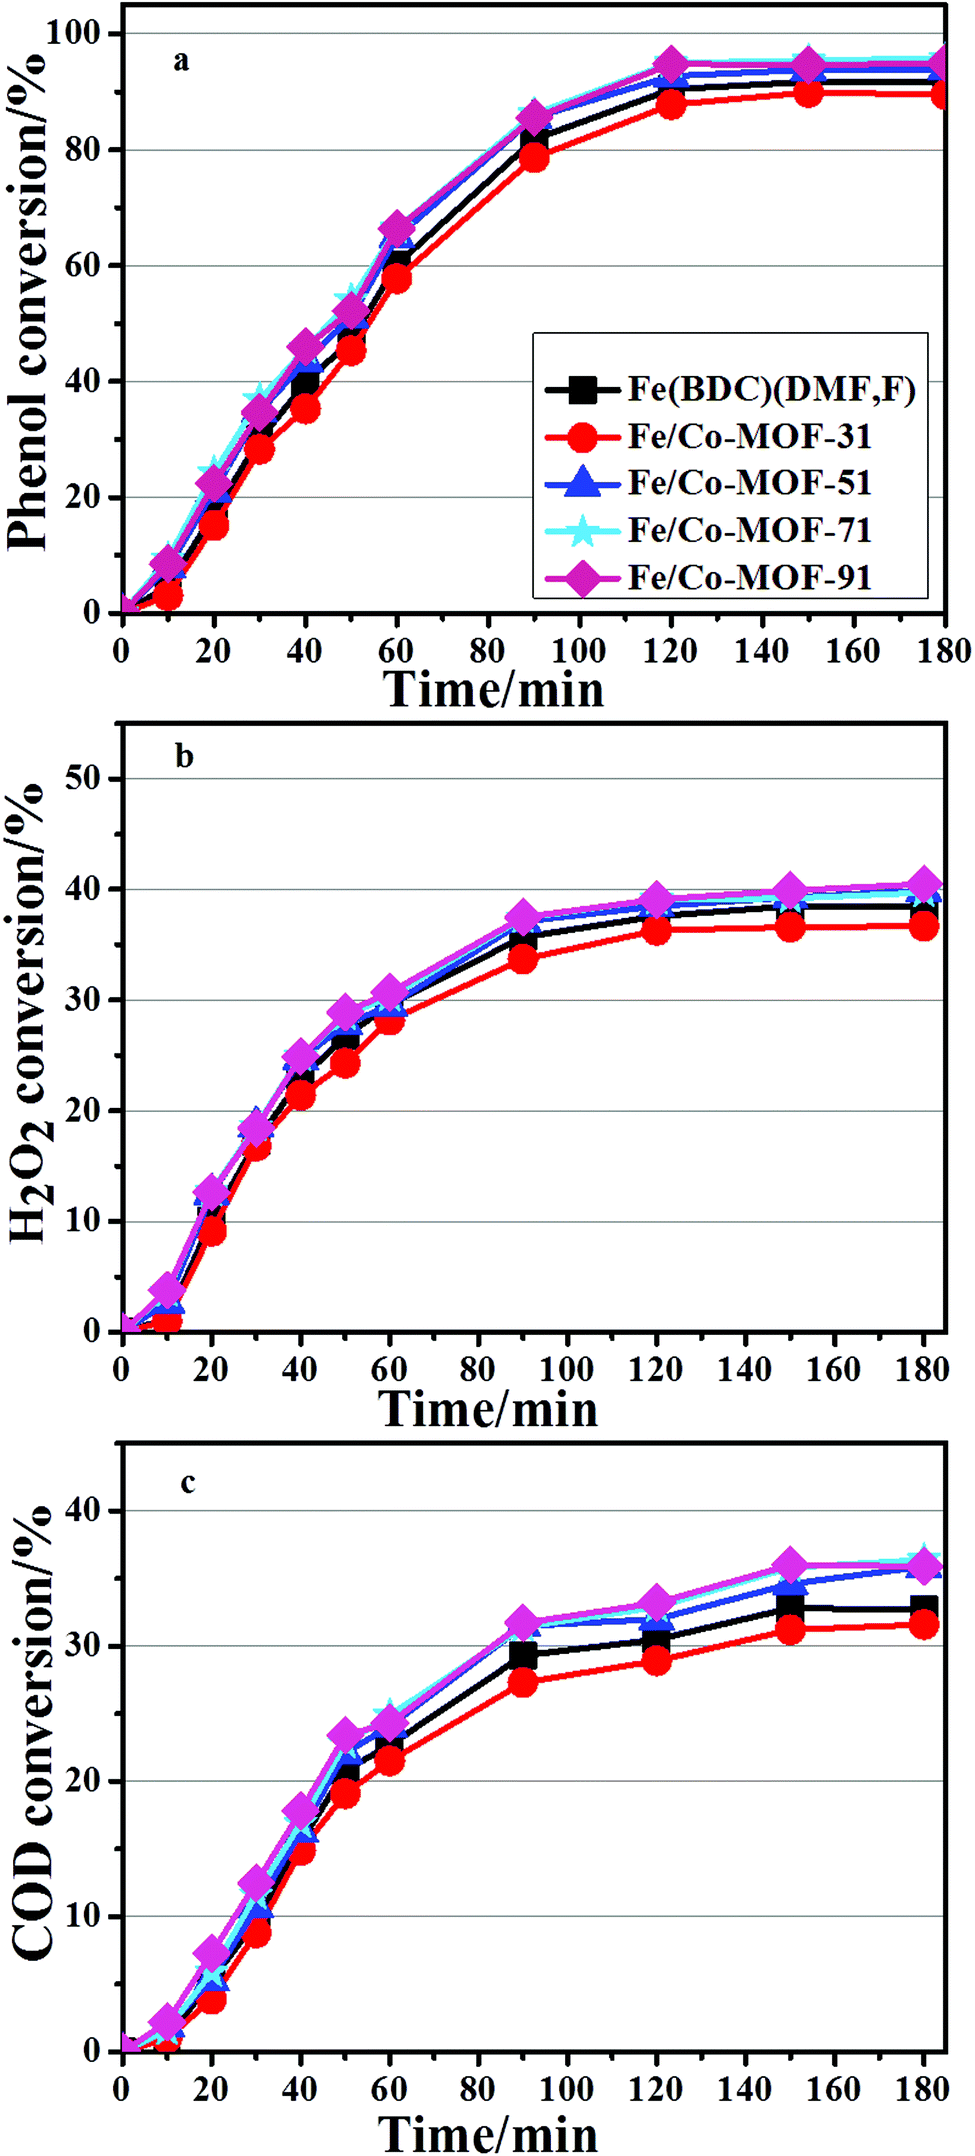
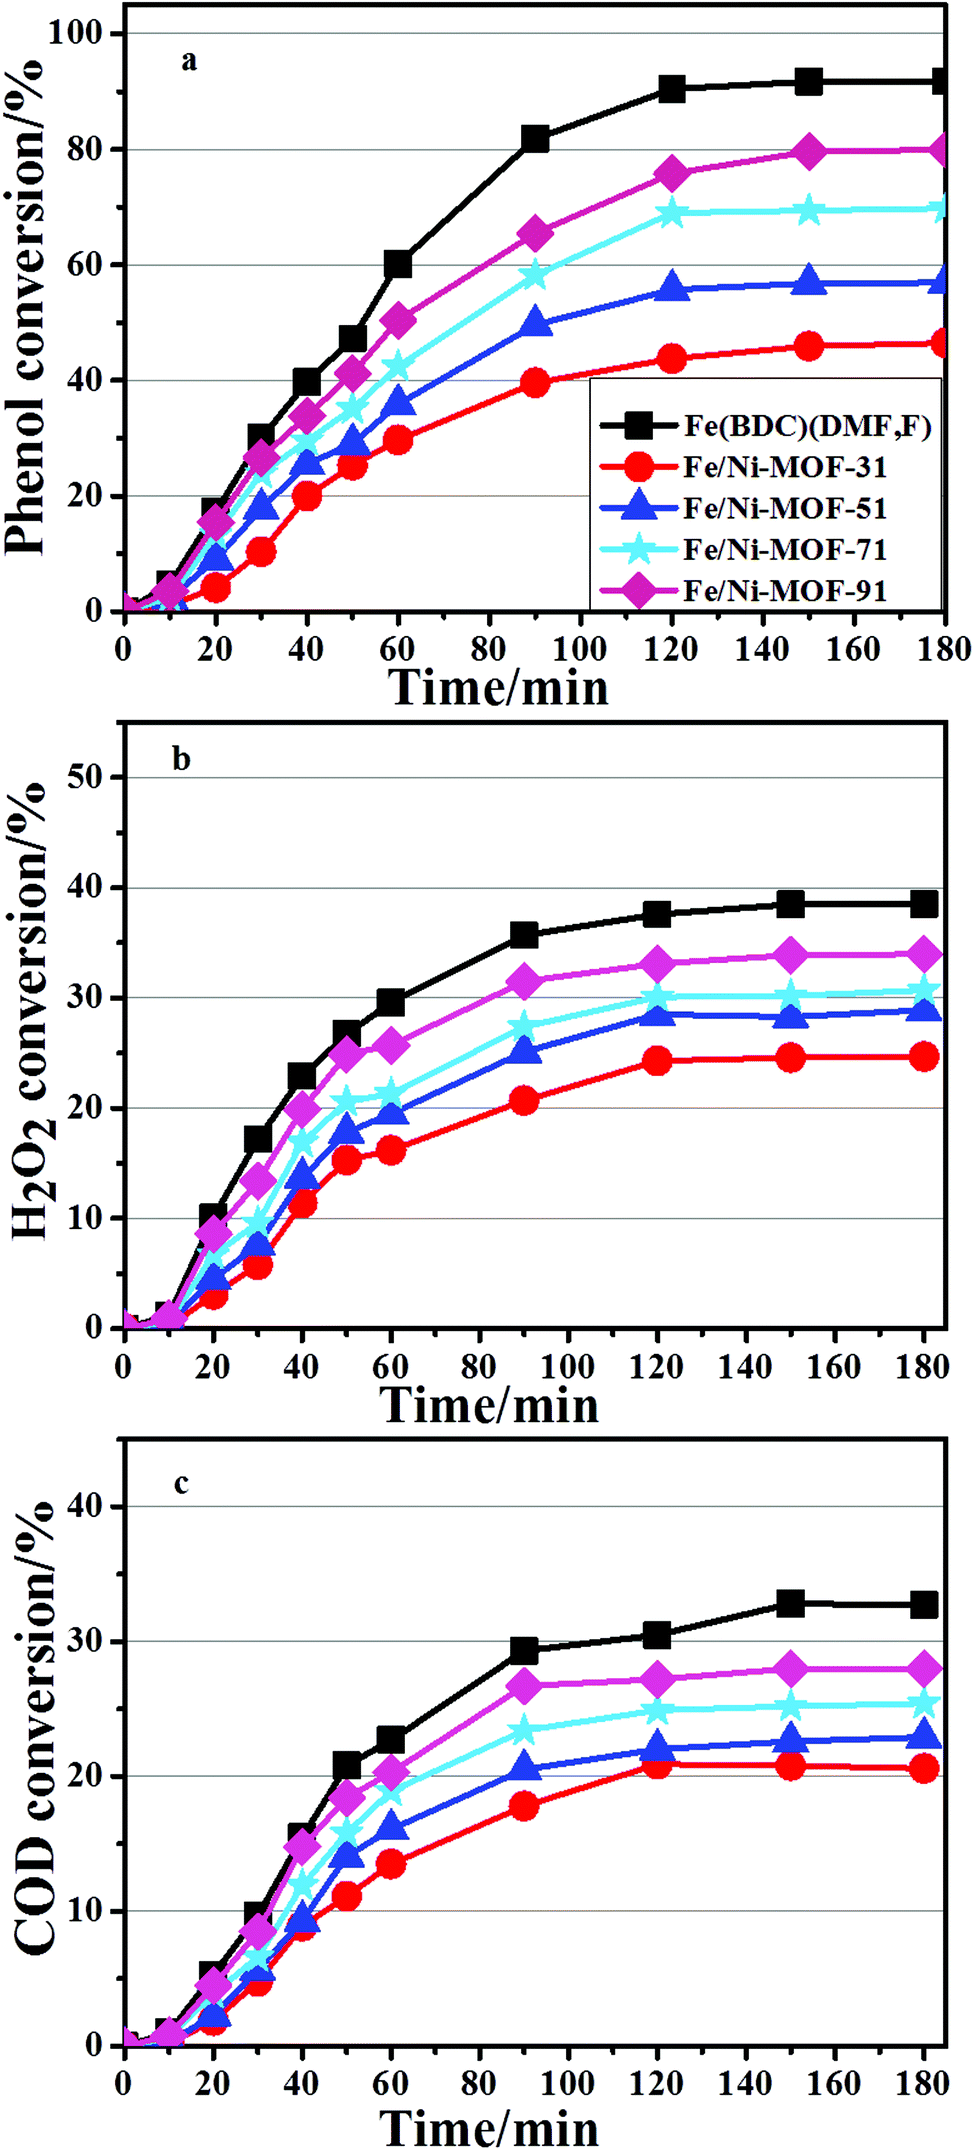
All the bimetallic MOFs were tested in the degradation of phenol, carried out under mild conditions described above. The catalytic performance of the Mn-MOFs (Mn3(1,4-BDC)3(μ-DMF)2) was also studied in the degradation process, but the conversion of phenol was below 1%, which denoted that the catalytic performance of this material can be ignored under this particular condition. The evolution of conversion on the Fe/Mn-MOFs is presented in Fig. 8. It is clear that all catalysts are able to decompose more than 90% of the initial phenol content after 3 h of the reaction. The best performance was obtained with the Fe/Mn-MOF-71 sample, followed by the Fe/Mn-MOF-91, Fe/Mn-MOF-51, and Fe/Mn-MOF-31 ones. The Fe(BDC)(DMF,F) sample showed the lowest catalytic activity among all the Fe/Mn bimetallic catalysts. The phenol removal rate seemed to be well related to the real n(Fe)/n(Mn) ratios of these materials. Based on the results of ICP-AES, the n(Fe)/n(Mn) ratios were 2.88, 4.55, 7.01 and 8.88 for the Fe/Mn-MOF-31, Fe/Mn-MOF-51, Fe/Mn-MOF-71 and Fe/Mn-MOF-91 samples, respectively. This analysis leads to the conclusion that the n(Fe)/n(Mn) ratio has a strong impact on the reaction rate, and 7.01 is the optimal value for the phenol degradation under the conditions employed. Furthermore, the degradation results of the Fe/Co-MOFs and Fe/Ni-MOFs are shown in Fig. 9 and 10. According to the conversion curves, the Fe/Co-MOF samples exhibit approximately similar catalytic activity to Fe(BDC)(DMF,F), while the Fe/Ni-MOF performance is worse than the former two series of bimetallic MOFs. We may presume that the incorporation of Mn can efficiently improve the catalytic performance of Fe-MOFs, the incorporation of Ni can impede this catalytic activity, and the incorporation of Co practically does no harm to the activity.
| | | Fe(II) + H2O2 → Fe(III) + HO˙ + OH− | (1) |
| |  | (2) |
| | | Mn(II) + H2O2 → Mn(III) + HO˙ + OH− | (3) |
 |
| | Fig. 8 Catalytic performance of the Fe/Mn-MOFs (conditions: initial phenol concentration, 1000 mg L−1; n(H2O2):n(phenol) = 14; initial pH 6.2; cat 0.064 g L−1; 35 °C, 1 atm, 3 h). | |
 |
| | Fig. 9 Catalytic performance of the Fe/Co-MOFs (conditions: initial phenol concentration, 1000 mg L−1; n(H2O2):n(phenol) = 14; initial pH 6.2; cat 0.064 g L−1; 35 °C, 1 atm, 3 h). | |
 |
| | Fig. 10 Catalytic performance of the Fe/Ni-MOFs (conditions: initial phenol concentration, 1000 mg L−1; n(H2O2):n(phenol) = 14; initial pH 6.2; cat 0.064 g L−1; 35 °C, 1 atm, 3 h). | |
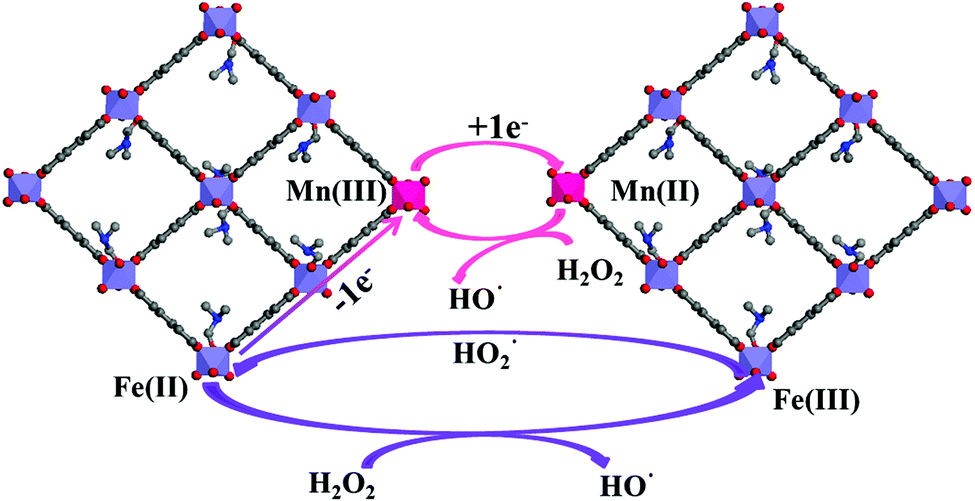
To explain the unique behavior of these bimetallic MOF samples, the reaction mechanism should be considered. Generally, HO˙ is taken as the active oxidizing intermediate in the Fenton and Fenton-like process. According to this mechanism, the reaction can be initiated by the reaction of H2O2 with Fe(II) or Fe(III) to produce HO˙ or  (eqn (1) and (2)), respectively.49 As a transition metal ion with variable valency, the manganese ion can participate in the chain reaction of radicals in the catalytic system. On one hand, Mn could exhibit the redox pairs Mn(II)/Mn(III), which can produce HO˙ through the decomposition of H2O2 (eqn (3)). On the other hand, electron transfer among the Mn species and the Fe species is a beneficial factor during the degradation process.50 According to the standard reduction potentials for Fe and Mn (eqn (4) and (5)), the reduction of Mn(III) by Fe(II) is thermodynamically favorable as shown in eqn (6). Briefly, the Mn species take part in producing HO˙, and Mn(II) can be efficiently regenerated through electron transfer, thus better results were achieved on the Fe/Mn-MOFs rather than the Fe(BDC)(DMF,F). The synergetic mechanism among the Fe species and the Mn species is presented in Fig. 11. Actually, Co has similar effects to Mn, that is, HO˙ production and easy regeneration via an electron transfer process in the Fe-containing materials.50,51 In our case, the contents of Co in the Fe/Co-MOFs were much lower than that of Mn in the Fe/Mn-MOFs. Therefore, the Fe/Co-MOFs exhibit no remarkable activity as the Mn-incorporated samples. According to Zhong,51 only Ni(II) species are stable during the reaction. This means Ni cannot work with H2O2 to produce hydroxyl radicals and further initiate the degradation process. Besides, this inhibitory impact becomes more obvious as the Ni contents increase. This exactly explains the unfavorable performance of the Fe/Ni-MOFs.
| | | Fe(III) + 1e− → Fe(II), E° = 0.77 V | (4) |
| | | Mn(III) + 1e− → Mn(II), E° = 1.51 V | (5) |
| | | Mn(III) + Fe(II) → Mn(II) + Fe(III), E° = 0.73 V | (6) |
 |
| | Fig. 11 The synergetic mechanism between the Fe and Mn species. | |
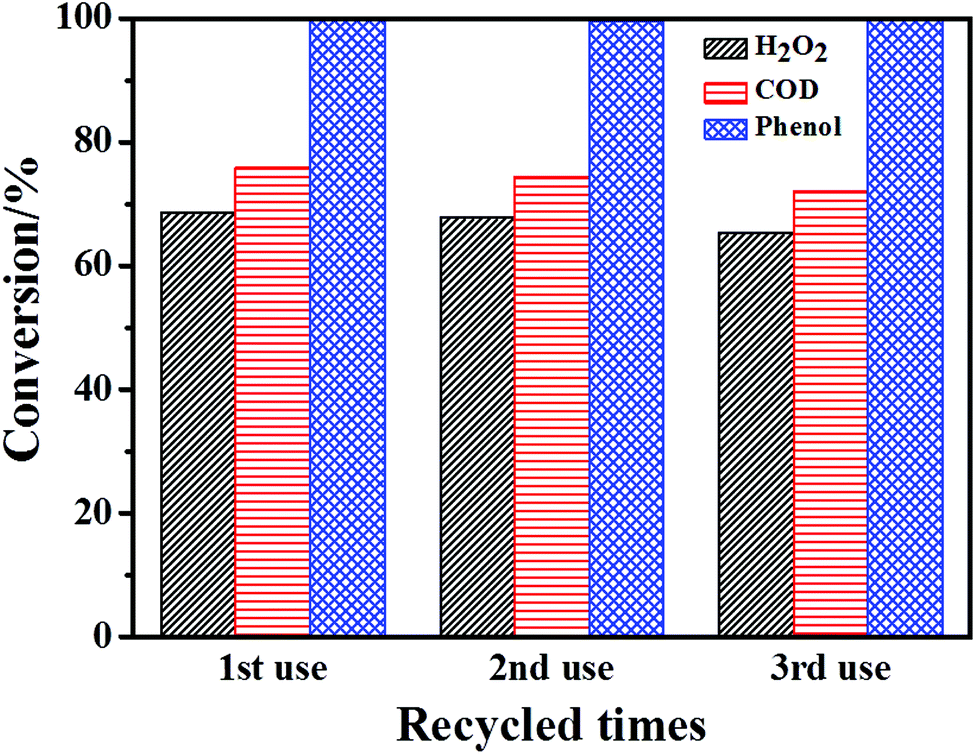
3.6 Stability and reusability
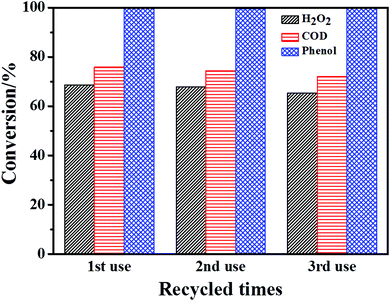
The stability of these four Fe/Mn-MOFs under catalytic conditions was demonstrated by comparing XRD patterns before and after catalysis, as shown in Fig. S12.† Apparently, all the XRD patterns of the used materials were almost the same as the fresh ones with a little decline in crystallinity. This signified that these catalysts were quite stable under the conditions employed. In the case of these catalysts, the main metal portions of the MOFs are Fe and Mn. In order to assess the possible influence of the leached ions, the amounts of Fe and Mn species leached into the solution were determined after the degradation reactions. As illustrated in Table S4,† the concentrations of Fe and Mn species were quite low in the solution, suggesting that this impact can be insignificant. Besides, the Fe/Mn-MOF-71 was recovered by filtration after the degradation tests in order to evaluate its reusability. The material was washed at room temperature, and then dried at 70 °C under vacuum overnight. Afterwards, the catalyst was reused with a fresh phenol solution. Fig. 12 shows that the phenol conversion remained almost constant in three runs. While the H2O2 conversion decreased from 68.6% to 65.3%, the COD conversion dropped from 75.9% to 72%. These results demonstrated that this catalyst was essentially stable and could be reused in this degradation reaction.
 |
| | Fig. 12 The reusable test of the Fe/Mn-MOF-71 (conditions: initial phenol concentration, 1000 mg L−1; n(H2O2):n(phenol) = 14; initial pH 6.2; cat 0.32 g L−1; 35 °C, 1 atm, 3 h). | |
4. Conclusion
We have successfully prepared three series of bimetallic MOFs via a direct solvothermal method, Fe/Mn-MOFs, Fe/Co-MOFs and Fe/Ni-MOFs. The characterization results with XRD, FT-IR and EDS confirmed the incorporation of Mn, Co and Ni into the Fe-based MOF structures. The catalytic performance of these materials was studied in the oxidative degradation of phenol at near neutral pH. It turned out that the incorporation of Mn could promote the catalytic process, Co exhibited no obviously favorable behavior, and Ni presented an apparently inhibitory impact. The best degradation result was achieved on the Fe/Mn-MOF-71 in a 3 h reaction, which illustrated that the contents of Mn in the bimetallic MOFs could affect the reaction efficiency. Moreover, the catalyst showed almost negligible leaching of iron and manganese after the reaction. The catalyst can be easily reused after washing and drying under vacuum.
Acknowledgements
This work was supported by the State Key Program of National Natural Science Foundation of China (Grant No. 21236008, 21401017).
Notes and references
- A. D. Bokare and W. Choi, J. Hazard. Mater., 2014, 275, 121–135 CrossRef CAS PubMed.
- A. Babuponnusami and K. Muthukumar, Chem. Eng. J., 2012, 183, 1–9 CrossRef CAS.
- L. A. Galeano, A. Gil and M. A. Vicente, Appl. Catal., B, 2010, 100, 271–281 CrossRef CAS.
- M. Tekbaş, H. C. Yatmaz and N. Bektaş, Microporous Mesoporous Mater., 2008, 115, 594–602 CrossRef.
- Y. Yan, X. W. Wu and H. P. Zhang, Sep. Purif. Technol., 2016, 171, 52–61 CrossRef CAS.
- S. Fukuchi, R. Nishimoto, M. Fukushima and Q. Zhu, Appl. Catal., B, 2014, 147, 411–419 CrossRef CAS.
- K. Huang, J. J. Wang, D. F. Wu and S. Lin, RSC Adv., 2015, 5, 8455–8462 RSC.
- E. V. Rokhina and J. Virkutyte, Crit. Rev. Environ. Sci. Technol., 2011, 41, 125–167 CrossRef CAS.
- O. M. Yaghi, M. O'Keeffe, N. W. Ockwig, H. K. Chae, M. Eddaoudi and J. Kim, Nature, 2003, 423, 705–714 CrossRef CAS PubMed.
- A. Corma, H. García and F. X. Llabrés i Xamena, Chem. Rev., 2010, 110, 4606–4655 CrossRef CAS PubMed.
- J. Y. Lee, O. K. Farha, J. Roberts, K. A. Scheidt, S. T. Nguyen and J. T. Hupp, Chem. Soc. Rev., 2009, 38, 1450–1459 RSC.
- H. C. Zhou and S. Kitagawa, Chem. Soc. Rev., 2014, 43, 5415–5418 RSC.
- Q. Yang, D. Liu, C. Zhong and J. R. Li, Chem. Rev., 2013, 113, 8261–8323 CrossRef CAS PubMed.
- K. Huang, Y. Xu, L. G. Wang and D. F. Wu, RSC Adv., 2015, 5, 32795–32803 RSC.
- S. Ou and C. Wu, Inorg. Chem. Front., 2014, 1, 721–734 RSC.
- D. Farrusseng, S. Aguado and C. Pinel, Angew. Chem., Int. Ed., 2009, 48, 7502–7513 CrossRef CAS PubMed.
- J. Zhou, R. Li, X. Fan, Y. Chen, R. Han, W. Li, J. Zheng, B. Wang and X. Li, Energy Environ. Sci., 2014, 7, 2715–2724 CAS.
- P. Horcajada, C. Serre, G. Maurin, N. A. Ramsahye, F. Balas, M. Vallet-Regí, M. Sebban, F. Taulelle and G. Férey, J. Am. Chem. Soc., 2008, 130, 6774–6780 CrossRef CAS PubMed.
- P. Li, S. Regati, H. Huang, H. D. Arman, J. C.-G. Zhao and B. Chen, Inorg. Chem. Front., 2015, 2, 42–46 RSC.
- O. V. Zalomaeva, K. A. Kovalenko, Y. A. Chesalov, M. S. Mel'gunov, V. I. Zaikovskii, V. V. Kaichev, A. B. Sorokin, O. A. Kholdeeva and V. P. Fedin, Dalton Trans., 2011, 40, 1441–1444 RSC.
- T. Toyao, K. Miyahara, M. Fujiwaki, T. H. Kim, S. Dohshi, Y. Horiuchi and M. Matsuoka, J. Phys. Chem. C, 2015, 119, 8131–8137 CAS.
- A. Dhakshinamoorthy, M. Alvaro and H. Garcia, Catal. Sci. Technol., 2011, 1, 856–867 CAS.
- W. Zhang, G. Lu, C. Cui, Y. Liu, S. Li, W. Yan, C. Xing, Y. R. Chi, Y. Yang and F. Huo, Adv. Mater., 2014, 26, 4056–4060 CrossRef CAS PubMed.
- D. Y. Hong, Y. K. Hwang, C. Serre, G. Férey and J. S. Chang, Adv. Funct. Mater., 2009, 19, 1537–1552 CrossRef CAS.
- L. Zhang, C. Feng, S. Gao, Z. Wang and C. Wang, Catal. Commun., 2015, 61, 21–25 CrossRef CAS.
- T. Zhang and W. Lin, Chem. Soc. Rev., 2014, 43, 5982–5993 RSC.
- J. J. Zhou, R. Wang, X. L. Liu, F. M. Peng, C. H. Lia, F. Teng and Y. P. Yuan, Appl. Surf. Sci., 2015, 346, 278–283 CrossRef CAS.
- X. Yu and S. M. Cohen, Chem. Commun., 2015, 51, 9880–9883 RSC.
- C. C. Wang, J. R. Li, X. L. Lv, Y. Q. Zhang and G. Guo, Energy Environ. Sci., 2014, 7, 2831–2867 CAS.
- H. Wang, X. Yuan, Y. Wu, G. Zeng, X. Chen, L. Leng and H. Li, Appl. Catal., B, 2015, 174–175, 445–454 CrossRef CAS.
- H. Lv, H. Zhao, T. Cao, L. Qian, Y. Wang and G. Zhao, J. Mol. Catal. A: Chem., 2015, 400, 81–89 CrossRef CAS.
- N. Mohaghegh, S. Kamrani, M. Tasviri, M. Elahifard and M. Gholami, J. Mater. Sci., 2015, 50, 4536–4546 CrossRef CAS.
- L. Ai, C. Zhang, L. Li and J. Jiang, Appl. Catal., B, 2014, 148–149, 191–200 CrossRef CAS.
- A. Pariyar, H. Y. Asl and A. Choudhury, Inorg. Chem., 2016, 55, 9250–9257 CrossRef CAS PubMed.
- L. Wang, Y. Wu, R. Cao, L. Ren, M. Chen, X. Feng, J. Zhou and B. Wang, ACS Appl. Mater. Interfaces, 2016, 8, 16736–16743 CAS.
- H. Li, W. Shi, K. Zhao, H. Li, Y. Bing and P. Cheng, Inorg. Chem., 2012, 51, 9200–9207 CrossRef CAS PubMed.
- Y. Cao, Y. Zhao, F. Song and Q. Zhong, J. Energy Chem., 2014, 23, 468–474 CrossRef.
- T. Wang, X. Li, W. Dai, Y. Fang and H. Huang, J. Mater. Chem. A, 2015, 3, 21044–21050 CAS.
- F. Millange, N. Guillou, M. E. Medina, G. Férey, A. Carlin-Sinclair, K. M. Golden and R. I. Walton, Chem. Mater., 2010, 22, 4237–4245 CrossRef CAS.
- Q. Sun, M. Liu, K. Li, Y. Han, Y. Zuo, J. Wang, C. Song, G. Zhang and X. Guo, Dalton Trans., 2016, 45, 7952–7959 RSC.
- M. I. Breeze, G. Clet, B. C. Campo, A. Vimont, M. Daturi, J. M. Grenèche, A. J. Dent, F. Millange and R. I. Walton, Inorg. Chem., 2013, 52, 8171–8182 CrossRef CAS PubMed.
- P. Maniam and N. Stock, Inorg. Chem., 2011, 50, 5085–5097 CrossRef CAS PubMed.
- F. Luo, Y. Che and J. Zheng, Inorg. Chem. Commun., 2008, 11, 358–362 CrossRef CAS.
- E. D. Bloch, L. J. Murray, W. L. Queen, S. Chavan, S. N. Maximoff, J. P. Bigi, R. Krishna, V. K. Peterson, F. Grandjean, G. J. Long, B. Smit, S. Bordiga, C. M. Brown and J. R. Long, J. Am. Chem. Soc., 2011, 133, 14814–14822 CrossRef CAS PubMed.
- H. Singh and K. L. Yadav, J. Phys. D: Appl. Phys., 2015, 48, 205001 CrossRef.
- M. Bagherzadeh, F. Ashouri and M. Đaković, Polyhedron, 2014, 69, 167–173 CrossRef CAS.
- L. Xing, Y. Xu and Q. Zhong, Energy Fuels, 2012, 26, 4903–4909 CrossRef CAS.
- Z. Wang, G. Shen, J. Li, H. Liu, Q. Wang and Y. Chen, Appl. Catal., B, 2013, 138–139, 253–259 CrossRef CAS.
- J. Zhao, J. Yang and J. Ma, Chem. Eng. J., 2014, 239, 171–177 CrossRef CAS.
- R. C. C. Costa, M. F. F. Lelis, L. C. A. Oliveira, J. D. Fabris, J. D. Ardisson, R. R. V. A. Rios, C. N. Silva and R. M. Lago, J. Hazard. Mater., 2006, B129, 171–178 CrossRef PubMed.
- Y. Zhong, X. Liang, Z. He, W. Tan, J. Zhu, P. Yuan, R. Zhu and H. He, Appl. Catal., B, 2014, 150–151, 612–618 CrossRef CAS.
Footnote |
| † Electronic supplementary information (ESI) available: XRD patterns of the Fe/Co-MOF, Fe/Ni-MOF, Mn-MOF, Co-MOF and Ni-MOF samples. FT-IR spectra of the Fe/Mn-MOFs, Fe/Co-MOFs and Fe/Ni-MOFs. SEM images of the Fe/Co-MOFs and Fe/Ni-MOFs. ICP results of the Fe/Co-MOFs and Fe/Ni-MOFs. TG curves of the Fe/Co-MOFs and Fe/Ni-MOFs. Hot filtration tests of the Fe/Mn-MOFs, Fe/Co-MOFs and Fe/Ni-MOFs. Results of several blank runs. XRD patterns of Fe(BDC)(DMF,F) before and after reactions. See DOI: 10.1039/c6qi00441e |
|
| This journal is © the Partner Organisations 2017 |
Click here to see how this site uses Cookies. View our privacy policy here. 


 (eqn (1) and (2)), respectively.49 As a transition metal ion with variable valency, the manganese ion can participate in the chain reaction of radicals in the catalytic system. On one hand, Mn could exhibit the redox pairs Mn(II)/Mn(III), which can produce HO˙ through the decomposition of H2O2 (eqn (3)). On the other hand, electron transfer among the Mn species and the Fe species is a beneficial factor during the degradation process.50 According to the standard reduction potentials for Fe and Mn (eqn (4) and (5)), the reduction of Mn(III) by Fe(II) is thermodynamically favorable as shown in eqn (6). Briefly, the Mn species take part in producing HO˙, and Mn(II) can be efficiently regenerated through electron transfer, thus better results were achieved on the Fe/Mn-MOFs rather than the Fe(BDC)(DMF,F). The synergetic mechanism among the Fe species and the Mn species is presented in Fig. 11. Actually, Co has similar effects to Mn, that is, HO˙ production and easy regeneration via an electron transfer process in the Fe-containing materials.50,51 In our case, the contents of Co in the Fe/Co-MOFs were much lower than that of Mn in the Fe/Mn-MOFs. Therefore, the Fe/Co-MOFs exhibit no remarkable activity as the Mn-incorporated samples. According to Zhong,51 only Ni(II) species are stable during the reaction. This means Ni cannot work with H2O2 to produce hydroxyl radicals and further initiate the degradation process. Besides, this inhibitory impact becomes more obvious as the Ni contents increase. This exactly explains the unfavorable performance of the Fe/Ni-MOFs.