 Open Access Article
Creative Commons Attribution 3.0 Unported Licence
A method for the quantification of 8-methoxypsoralen by mass spectrometry for offline extracorporeal photopheresis
Viola
Hähnel
a,
Frauke
Dormann
a,
Athanasios
Nitsopoulos
b,
Albrecht
Friedle
b and
Norbert
Ahrens
 *a
*a
aInstitute for Clinical Chemistry and Laboratory Medicine, Transfusion Medicine, University Hospital Regensburg, Franz-Josef-Strauss-Allee 11, 93053 Regensburg, Germany. E-mail: norbert.ahrens@ukr.de; Fax: +49 941 944-6249
bLabor Friedle GmbH, von-Heyden-Str. 11, 93105 Tegernheim, Germany
First published on 24th November 2016
Abstract
Background: Extracorporeal photopheresis (ECP) is an efficient method to treat various autoimmune diseases, cutaneous T-cell lymphoma, and graft-versus-host disease. It is based on the ex vivo inactivation of lymphocytes by 8-methoxypsoralen (8-MOP)/UV light treatment. Despite the adhesive, lipophilic nature of 8-MOP, no quality control is established for the ECP procedure. Methods: We developed a sensitive high-performance liquid chromatography/tandem mass spectrometry (HPLC-MS/MS) assay to monitor residual 8-MOP concentration after UVA irradiation in the whole blood supernatant after acetonitrile precipitation. Results: The preanalytical stability of 8-MOP exceeded 7 days, allowing batch mode analysis. Linearity was determined with R2 above 0.99. The 8-MOP concentrations decreased exponentially after UV exposure, with decay constants of 0.0259 in plasma and 0.0528 in saline. The recovery of 8-MOP in photopheresates was about 68%, indicating binding to DNA as well as to plastic structures. UVA induced no 8-MOP fragmentation, but caused self-adducts under extreme conditions (10-fold UV dosage). Conclusions: Detection of 8-MOP proved to be feasible and demonstrated that the doses were in the pharmaceutically active range.
Introduction
Extracorporeal photopheresis (ECP) is an efficient and established therapy for cutaneous T-cell lymphomas, graft-versus-host disease, solid organ transplant rejection, and various autoimmune diseases.1 The latter includes atopic dermatitis, for which the first positive results became available recently.2 The procedure is based on the photochemical inactivation of patient leucocytes collected by apheresis.3 It is achieved by ex vivo incubation with 8-methoxypsoralen (8-MOP), a naturally occurring furocoumarin that distributes within less than 2 min into DNA strands and binds covalently within milliseconds after UVA exposure (320–370 nm).4–6 The treated white blood cells become apoptotic.7,8 Unbound 8-MOP is rapidly metabolized and renally excreted within 24 hours.9Leucocytes are collected by apheresis either using a specialized device that combines apheresis technology and UV irradiation in a single machine (inline ECP, Therakos Uvar XTS or Cellex) or by using two devices: one specially designed for apheresis (Terumo BCT Cobe Spectra or Optia, Fresenius Kabi Amicus or Com.Tec, or Haemonetics MCS+)10 and the other for UV irradiation (offline ECP).11 ECP therapy is usually administered on two consecutive days, forming one treatment cycle. Cycles are generally repeated every two to six weeks.
8-MOP is a lipophilic substance that is readily adsorbed onto plastic materials.9 Therefore, it is desirable to validate whether 8-MOP is still present in therapeutically sufficient quantities after handling the cell suspension. Analytical methods such as high-performance liquid chromatography (HPLC), liquid chromatography/tandem mass spectrometry (LC-MS/MS),12,13 assays based on gas chromatography (GC) with electron capture detection14 or mass spectrometry,15,16 and surface-enhanced laser desorption/ionization time-of-flight mass spectrometry (SELDI-TOF-MS)17 have been developed to detect 8-MOP and its photoadducts. However, none of these methods have been adopted for routine quality control of ECP. Hence, we developed a sensitive LC-MS/MS method to quantify and monitor 8-MOP in cell suspensions under routine therapeutic conditions.
Experimental section
Patients
The investigated process was established on a GMP level based on the requirements from the authority from 2013 onwards. As part of this, 8-MOP analysis was mandatory, and the investigated samples were drawn for routine analysis and included up to 2016. Patients were scheduled for ECP based on clinical indications. All manufacturing and treatment was in accordance with the EU guidelines for good manufacturing practice, with the national pharmaceutical law, and with the declaration of Helsinki. This was approved by the institutional review board under permission number 16-101-0099. Patients were fully informed about manufacturing and treatment and gave their written consent.The included patients were 59% male and 6 to 68 years old (median 51 years).
Photopheresis
Leucocytes were collected with the Cobe Spectra or Optia (Terumo BCT, Lakewood, CO, USA) apheresis system using the AutoPBSC program, which was configured to yield 90 mL of leukapheresis cell suspension (leukapheresate) and 110 mL autologous plasma with citrate anticoagulation for patients with more than 25 kg body weight. After apheresis, cells and plasma were transferred to a UV-permeable ethylene vinyl acetate bag (Cellmax, Munich, Germany), and 2 mL 8-MOP was added from a stock solution (20 μg mL−1 Uvadex, Therakos, West Chester, PA, USA), yielding a final concentration of 200 ng mL−1. For patients under 25 kg, physiological saline instead of plasma was used with a final volume of 100 mL photopheresate (40 mL cell suspension and 60 mL 0.9% NaCl) by adding 1 mL 8-MOP. Handling time ensured sufficient distribution of 8-MOP into DNA double strands (2 to 60 min).6 This cell suspension (photopheresate) was irradiated with UVA light at a wavelength of 320 to 370 nm and a dose of 1.0 J cm−2 per side (total 2.0 J cm−2) (Puva Combi Light, Cellmax, Munich, Germany) and re-infused into the patient. Light was applied at a constant dosage and varying times depending on the light transmission. This treatment was performed on two consecutive days per treatment cycle.Additional testing was done for the establishment of the test. In these cases, UVA-permeable bags were filled with physiological saline (0.9% NaCl, B. Braun Melsungen, Melsungen, Germany) or plasma from healthy blood donors and spiked with 8-MOP (Uvadex or, if indicated, Xanthotoxin from Carl Roth, Karlsruhe, Germany) at different concentrations followed by UVA irradiation at various doses. These bags were not administered to patients.
Samples of the photopheresis product were drawn after UVA exposure and stored at 2–8 °C in polypropylene (Sarstedt, Nümbrecht, Germany) or glass tubes (B. Braun Melsungen, Melsungen, Germany).
Sample preparation
10 μL imperatorin (Phytolab, Vestenbergsgreuth, Germany), a psoralen substituted by a prenyloxy group at position 8,18 was added at a concentration of 2 ng μL−1 as an internal positive control to 100 μL photopheresate supernatant. Protein precipitation and removal was performed with 1 mL acetonitrile (Acetonitrile HPLC Ultra Gradient Grade, Carl Roth, Karlsruhe, Germany), mixing and centrifugation. A blank sample with 100 μL water was always co-tested. Quantification of 8-MOP was done according to daily calibration with external standards of 8-MOP in acetonitrile.HPLC-MS/MS instrumentation and conditions
The supernatant was analyzed by LC-MS/MS using the Agilent Technologies 1200 Series (Santa Clara, CA, USA) and the Varian 320-MS system, if indicated, or the Agilent Technologies 1290 Infinity and 6495 TQ Mass Spectrometer systems.HPLC
Chromatographic separation for quantification was performed on an Agilent Technologies Eclipse Plus C18 column (2.1 × 50 mm, 1.8 μm particle size). Linear gradient elution of eluents A (water with 0.1% formic acid) and B (acetonitrile with 0.1% formic acid) was used for separation. The gradient consisted of 100% A 0–0.3 min, 100% B 4–7 min, and 100% A 7.1–10 min. The flow rate was 0.3 mL min−1.The chromatographic conditions for detection of photoderivatives were the same as those used for the quantification.
Mass spectrometer
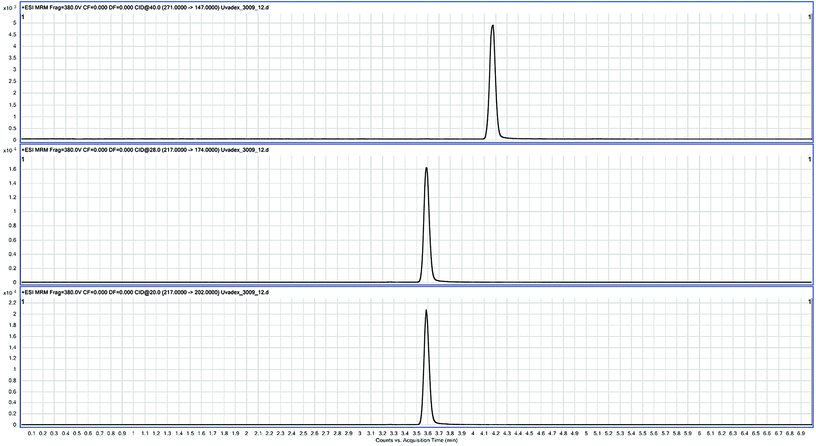
The MS/MS conditions for quantification were set to a gas temperature of 200 °C and a flow rate of 12 L min−1. The nebulizer was adjusted to 35 psi. Regarding the sheath gas, the temperature and gas flow rate were maintained at 350 °C and 12 L min−1. Voltage settings were 3000 V (capillary) and 300 V (nozzle). The multiple-reaction monitoring mode (MRM) was used for quantification. MRM transitions were for imperatorin 271 → 147 (40 eV) and for 8-MOP 217 → 202 (quantifier, 20 eV) and 217 → 174 (qualifier, 28 eV). The dwell time was 70 ms, cell acceleration voltage 5 V, and fragmentor voltage 380 V (Fig. 1). MassHunter software (Agilent Technologies) was used for quantification.The MS scan conditions for the detection of photoderivatives were set, for Quadrupol 2, to 50–1000 m/z with a scan rate of 1000 ms.
GC-MS instrumentation and conditions
For the detection of possible photo-derivatives, GC-MS was performed using the full-scan mode. The supernatant was analyzed by GC-MS using Agilent Technologies 6890N (Santa Clara, CA, USA) and Agilent Technologies 5973 Inert mass spectrometers with the Evolution upgrade.GC
Chromatographic separation was performed using an Agilent Technologies HP-5MS UI column (30 m × 0.25 mm × 0.25 mm) at a flow rate of 0.7 mL min−1. Injection was done with the Programmable Temperature Vaporization (PTV) inlet in the solvent vent mode. The injector conditions were as follows: 5.8 psi (vent pressure), 70.0 mL min−1 (vent flow), 0.12 min (vent end time), 2.0 min (purge time), and 20 mL min−1 (purge flow). The injector temperature programme was set at 50 °C for 0.14 min with a heat rate of 700 °C min−1, and at 280 °C for 15 min. The GC temperature was programmed as follows: 50 °C for 1 min at a heat rate of 35 °C min−1, 100 °C for 0 min at a rate of 8 °C min−1, and 320 °C for 10 min.MS
The mass spectrometer was used with a solvent delay of 4.5 min, a cycle time of 500 ms, and 50–550 amu (scan).Statistical analysis
Microsoft Excel 2010 and R were used to collect data, calculate and test for normal distribution using the Shapiro–Wilk test and the Mann–Whitney U-test, to determine the median, mean and standard deviation values, to test for exponential regression, and to create the figures.Results and discussion
Detection of 8-MOP by HPLC-MS/MS
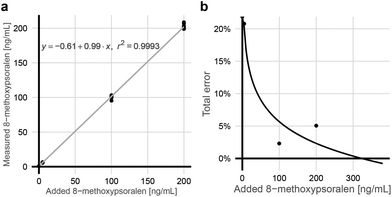
Apheresis plasma was spiked with varying amounts of 8-MOP. The blank sample's 1.645-fold standard deviation19 revealed a limit of blanks (LOB) of 1.01 ng mL−1. The limit of detection (LOD) as 1.645-fold standard deviation of low concentration 8-MOP (5 ng mL−1) plus LOB19 was 1.53 ng mL−1. The limit of quantification (LOQ) was calculated by linear regression of the root mean square from standard deviation and bias. It was below 20% for concentrations above 5.17 ng mL−1 (Fig. 2). Linearity was determined with R2 above 0.99 (Fig. 2). Precision was 2.1% (intra-assay, 140 ng mL−1, n = 6) and 3.9% (inter-assay, 134 ng mL−1, n = 8).The substance concentration in Uvadex glass bottles was controlled in comparison with 10 ng mL−1 Xanthotoxin solution and revealed 93.6% of the labeled amount in two different batches that were tested within the specified shelf life (n = 4).
Substance loss due to plastic adhesion was tested with Xanthotoxin in saline and storage. After 24 h, 30 ng mL−1 residual substance of the added amount (100 ng mL−1) was detected. This was further decreased by UVA irradiation to 21 ng mL−1 (recovery of 70% of the non-irradiated amount). This is consistent with the adhesive nature of 8-MOP.9
Substance loss prior to UVA irradiation was also tested with plasma-containing cell suspensions from ECP patients. The cell suspensions showed concentrations of 5.06–578.93 × 10³ μL−1 leucocytes (median 41.91 × 10³ μL−1), 0.09–0.35 × 10⁶ μL−1 erythrocytes (median 0.22 × 10⁶ μL−1), and 67–1390 × 103 μL−1 platelets (median 1039 × 103 μL−1). Before 8-MOP addition, the concentration was below the LOD in all samples as expected because of rapid metabolism and renal excretion of residual 8-MOP.9 After contact with the plastic surface of the UV-permeable bag, a median of 185 (range: 175–191) ng mL−1 of the added 200 ng mL−1 8-MOP could be retrieved (n = 5), equalling a median of 92% (range: 87–95%). UVA irradiation with 2.0 J cm−2 decreased 8-MOP to a median of 173 (range: 167–180) ng mL−1, equalling a median of 94% (range: 90–97%) before irradiation. No matrix effect was detected.
Detection of photo-derivatives
UV-irradiation may, in principle, cause degradation of 8-MOP in smaller and more volatile fragments. These were first investigated by GC-MS with saline spiked with 8-MOP (Xanthotoxin) to a final concentration of 100![[thin space (1/6-em)]](https://www.rsc.org/images/entities/char_2009.gif) 000 ng mL−1, which was 500 times the standard concentration, and irradiated with 2 J cm−2 and 20 J cm−2. An increased concentration was used to achieve higher chances of detecting possible derivatives of 8-MOP. As GC-MS is a suitable technique to detect the whole mass spectrum of a substance, we used this method in the full scan mode exclusively to identify unknown peaks. The chromatograms showed no additional peaks indicative of photo-derivatives.
000 ng mL−1, which was 500 times the standard concentration, and irradiated with 2 J cm−2 and 20 J cm−2. An increased concentration was used to achieve higher chances of detecting possible derivatives of 8-MOP. As GC-MS is a suitable technique to detect the whole mass spectrum of a substance, we used this method in the full scan mode exclusively to identify unknown peaks. The chromatograms showed no additional peaks indicative of photo-derivatives.
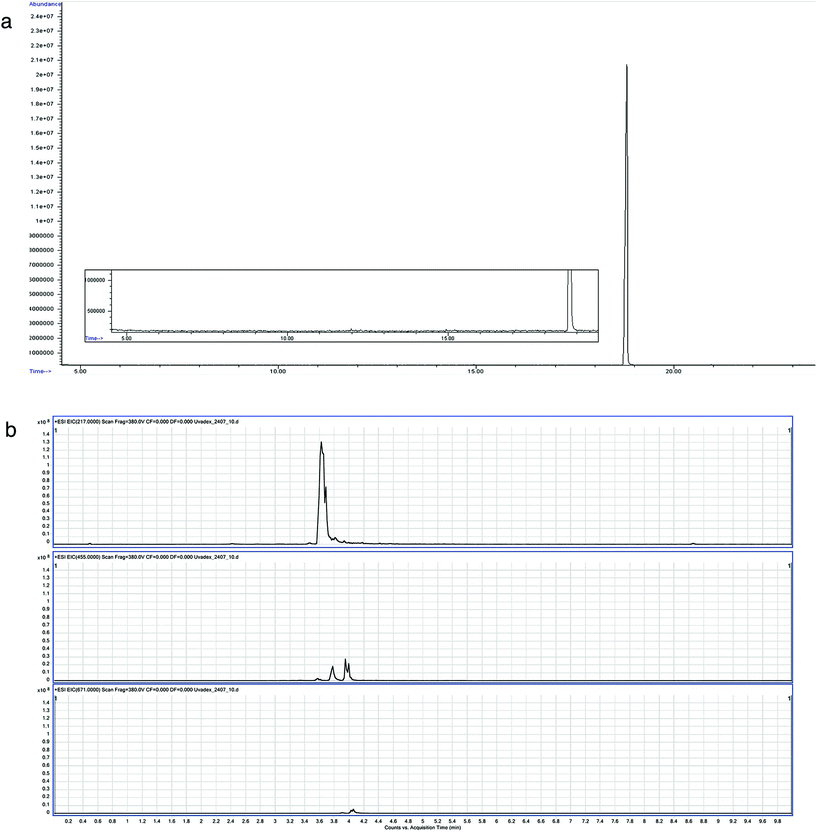
While predominantly binding to pyrimidine residues, 8-MOP is known to build photoadducts with a large range of molecules. It could therefore also form self-adducts. This was investigated by LC-MS, as larger molecules are unlikely to be volatile enough for detection by GC-MS. Using LC-MS in the scan mode, dimers and to a lesser extent trimers of 8-MOP were identified with the abovementioned conditions (Fig. 3).
In the next step, bags with 200 mL physiological saline or plasma, each in triplicate, were spiked with 8-MOP to a final concentration of 200 ng mL−1 (Fig. 4). The concentration was monitored at increasing irradiation intensity up to 24 J cm−2 (12 times the standard intensity), which equalled irradiation times of up to 20 min 18 s. The 8-MOP concentration decreased exponentially during irradiation, like radioactive decay (Fig. 4). The decay constant was determined based on the formula:
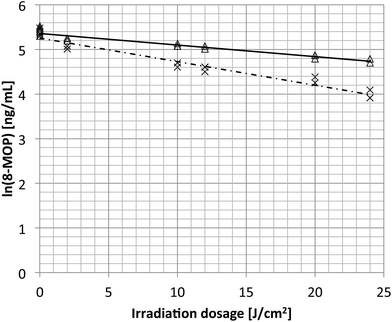 | ||
| Fig. 4 Natural logarithm of 8-methoxypsoralen concentrations in cell-free plasma (open triangles) or physiological saline (NaCl, crosses) after exposure to increasing dosages of UVA light. | ||
Preanalytical stability of 8-MOP
To analyze the influence of temperature, adhesion loss, and storage time on the stability of 8-MOP, photopheresis samples were stored at room temperature and at 2–8 °C for up to 7 days in polypropylene or glass tubes (Table 1). The mean concentrations after sample storage in polypropylene or glass tubes were 170 ng mL−1 and 169 ng mL−1, respectively. The mean concentrations in samples stored at ambient temperature or 2–8 °C were 172 ng mL−1 and 165 ng mL−1, respectively. There was no significant difference in 8-MOP concentration due to the tube type for sample storage (p = 0.89) or storage temperature (p = 0.21).| Sample storage time | Glass tubes | Polypropylene tubes |
|---|---|---|
| <1 day, AT | 168 ng mL−1 | 163 ng mL−1 |
| <1 day, 2–8 °C | 157 ng mL−1 | 156 ng mL−1 |
| 3 days, AT | 158 ng mL−1 | 162 ng mL−1 |
| 3 days, 2–8 °C | 159 ng mL−1 | 162 ng mL−1 |
| 7 days, AT | 178 ng mL−1 | 190 ng mL−1 |
| 7 days, 2–8 °C | 184 ng mL−1 | 169 ng mL−1 |
Routine data
Patients were usually treated on two consecutive days. The peripheral blood concentration of 8-MOP was below the LOD before treatment on day 1 as well as on day 2 (n = 16). This is congruent with publications which have shown that 8-MOP is metabolized and/or excreted within 24 h.9,16,20 Residual 8-MOP concentration data from 438 ECP treatments in 29 patients over a period of 12 months were included in the analysis (Fig. 6). After 8-MOP injection and irradiation, the concentration of unbound 8-MOP in photopheresates with plasma (n = 416) was 20–250 ng mL−1 on day 1 and 20–210 ng mL−1 on day 2 (median of all data 140 ng mL−1). Photopheresates with saline contained 10–260 ng mL−1 8-MOP on day 1 and 70–190 ng mL−1 8-MOP on day 2 (median 105 ng mL−1, n = 22). There was no significant difference in the concentrations of residual 8-MOP on the two days (p = 0.55).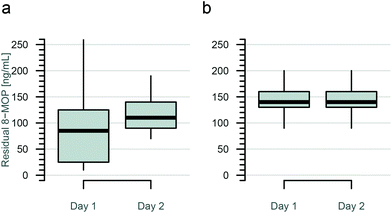 | ||
| Fig. 6 8-MOP concentration after offline photopheresis UVA treatment on days 1 and 2: (a) saline containing cell suspensions (n = 22), (b) plasma containing cell suspensions (n = 416). | ||
The median concentration of 140 ng mL−1 8-MOP in 194 mL photopheresate equalled 27 μg 8-MOP returned to the patient. This was 68% of the 8-MOP dose administered before UVA irradiation (40 μg). Regarding all treatments, the product of 8-MOP concentration and UVA dose (2 J cm−2) ranged from 20 to 520 ng J cm−2 mL−1 (median 280) with a CV of 23%.
Discussion
This study was conducted to establish an HPLC-MS/MS-based analytical method for the detection of 8-MOP for quality control of ECP. It included 8-MOP detection, the definition of specifications for routine quality control as well as the detection of possible photo-derivatives. In addition, preanalytical stability was investigated. Data from 438 treatments of 29 patients obtained during 12 months are presented in this article.Methods to detect 8-MOP have been developed. The previous techniques are based on HPLC,13,21 HPLC- and LC-MS/MS,12,13 GC with electron capture detection,14 or GC-MS.15,16 Some of these methods were developed for detection in urine or herbal extracts and were thus not applicable to 8-MOP detection in human blood samples that contain 8-MOP binding plasma proteins.12,13 In addition, HPLC and GC-MS methods to detect 8-MOP require sample preparation with extraction and evaporation that inherently compromises precision and therefore LOD and LOQ. This may impair analytical quality, if 8-MOP extraction especially in blood samples was incomplete, e.g. due to protein binding.20
However, low LOD values were in part achieved even with complex preanalytics when calculated as threefold standard deviation divided by the slope. This formula may result in lower LOD values compared to the method used in this article (0.95 ng mL−1 for the herein presented method instead of 1.53 ng mL−1).
Being activated by UVA, the furocoumarin 8-MOP changes from its biologically inert form to a form which is able to bind to pyrimidine bases of DNA. The reacting structures are the 4,5 bond of the furan ring as well as the 3,4 bond of the pyrone ring, which seems to be the more reactive position because of a high electron density.21,22 The main targets of 8-MOP are DNA, RNA and proteins, but it is known that 8-MOP has an affinity to some plastic material structures, which seems to be enhanced by the molecular shape change during UV exposure.
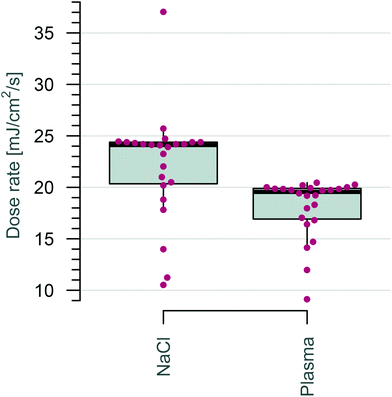
Initially, 8-MOP detection was carried out by using physiological saline spiked with 8-MOP. Irradiation with a standard dose led to drug loss. Both increasing the irradiation intensity to 20 J cm−2 (10-fold more) and increasing the irradiation time (equivalent to an intensity of up to 24 J cm−2) resulted in a higher loss of 8-MOP in NaCl than that in plasma. This decrease was faster in saline-filled bags than in plasma-filled bags. Greater light transmission through saline-filled bags led to higher dose rates. This difference in 8-MOP reduction in plasma versus NaCl could be due to plastic surface adhesion, among other things. Plasma seems to have a buffering effect, reducing the possibility of the drug coming into contact with the plastic surface of the bag.
Inactivation of cells by 8-MOP and UVA irradiation occurs mostly by crosslinking DNA strands. Prolonged exposure of cell suspensions to long-wavelength UV light leads to higher yields of interstrand crosslinks induced by 8-MOP.23 All in all, the 8-MOP concentration is much more reduced in the matrix of physiological saline than in plasma, possibly because of its buffering character.
Analysis of photopheresis products of different patients showed no residual 8-MOP from the previous day's treatment due to the rapid metabolism and renal excretion of residual 8-MOP. After irradiation, the measured concentration was 167–180 ng mL−1 (median of 173 ng mL−1) with a recovery of 94% (median).
In order to determine whether photometabolites are being generated, we treated UV-permeable bags filled with physiological saline and a 500-fold concentration of 8-MOP at an irradiation dose of 2.0 J cm−2 and 20 J cm−2. Using GC-MS for obtaining the whole mass spectrum of 8-MOP there was no indication for the generation of photometabolites. With LC-MS, polymers of 8-MOP were detected at a 10-fold irradiation dose but not under standard conditions with 2.0 J cm−2.
For the pre-analytical stability of 8-MOP we analyzed the influence of temperature and storage time. A standard storage condition of 2–8 °C for a maximum of 7 days seems acceptable based on these data. The aspect of plastic adhesion to sample tubes has also been reflected by using polypropylene tubes as well as glass tubes. The product information of Uvadex describes a loss of 8-MOP due to adhesion, e.g. to polyvinylchloride. This effect, resulting in about 30% substance loss, also occurs with UV-permeable ethylene vinyl acetate bags. The observed minimal differences in residual 8-MOP concentrations in polypropylene tubes and glass tubes proved that the drug can be stored in the former vessels without additional losses due to adhesion of the drug to this type of plastic material.
Patients were usually treated on two consecutive days. Cell suspension was replenished either with autologous plasma or with physiological saline. Analysis of residual 8-MOP concentrations in photopheresates over a period of 12 months showed a median concentration of 140 ng mL−1 on both days. Photopheresates with NaCl as the matrix revealed lower residual 8-MOP concentrations than those with plasma as there is a higher adhesion effect on plastic material in NaCl. Based on our data, the specification for residual 8-MOP concentration for routine quality control of offline photopheresis products was defined as 60–180 ng mL−1.
In our study with a standard dosage of 40 μg of 8-MOP for photopheresis therapy, a residual dosage of 27 μg (median; range: 2–50 μg) of 8-MOP was detected after UVA irradiation. For the treatment of psoriasis, the drug is administered orally at a dosage of 70–160 mg per day.24 For systemic therapy, 8-MOP doses of 0.6 mg kg−1 are used,11 which are more than 1000 times higher than the dosages used for ECP. Therefore, the residual 8-MOP concentrations detected in our photopheresis products can be regarded as toxicologically negligible.
The dosage required for a sufficient therapeutic effect has been found to be dependent on both the irradiation intensity and the 8-MOP concentration.22 This dose should be in the range of 50–400 ng J cm−2 mL−1 to inactivate lymphocytes but not impair immunological cell interaction.11,25 In our photopheresates, the product of 8-MOP-concentration and UVA dose was 20–520 ng J cm−2 mL−1 (median 280), which is in the biologically effective range.
All in all, we conclude that LC-MS/MS is an appropriate and sensitive method for routine quality control of 8-MOP at photopheresis.
Acknowledgements
The very helpful support of apheresis operators and apheresis physicians from Transfusion Medicine of the University Hospital Regensburg is acknowledged.References
- M. B. Marques and J. Adamski, Extracorporeal photopheresis: technique, established and novel indications, J. Clin. Apher., 2014, 29, 228–234 CrossRef PubMed.
- P. Wolf, D. Georgas, N. S. Tomi, C. M. Schempp and K. Hoffmann, Extracorporeal photochemotherapy as systemic monotherapy of severe, refractory atopic dermatitis: results from a prospective trial, Photochem. Photobiol. Sci., 2013, 12, 174–181 CAS.
- H. Budde, S. Kolb, L. Salinas Tejedor, G. Wulf, H. M. Reichardt, J. Riggert and T. J. Legler, Modified extracorporeal photopheresis with cells from a healthy donor for acute graft-versus-host disease in a mouse model, PLoS One, 2014, 9, e105896 Search PubMed.
- P. S. Song and K. J. Tapley, Photochemistry and photobiology of psoralens, Photochem. Photobiol., 1979, 29, 1177–1197 CrossRef CAS PubMed.
- H. Cao, J. E. Hearst, L. Corash and Y. Wang, LC-MS/MS for the detection of DNA interstrand cross-links formed by 8-methoxypsoralen and UVA irradiation in human cells, Anal. Chem., 2008, 80, 2932–2938 CrossRef CAS PubMed.
- L. Karolak, M. Tod, A. Leon, A. M. Heudes, O. Petitjean and L. Laroche, In vitro kinetics of 8-methoxypsoralen penetration into human lymphoid cells, Photodermatol., Photoimmunol. Photomed., 1992, 9, 58–60 CAS.
- D. Schmid, C. Grabmer, D. Streif, T. Lener, K. Schallmoser and E. Rohde, T-Cell death, phosphatidylserine exposure and reduced proliferation rate to validate extracorporeal photochemotherapy, Vox Sang., 2015, 108, 82–88 CrossRef CAS PubMed.
- C. Franklin, E. Cesko, U. Hillen, B. Schilling and S. Brandau, Modulation and apoptosis of neutrophil granulocytes by extracorporeal photopheresis in the treatment of chronic graft-versus-host disease, PLoS One, 2015, 10, e0134518 Search PubMed.
- S. E. Shephard, F. O. Nestle and R. Panizzon, Pharmacokinetics of 8-methoxypsoralen during extracorporeal photopheresis, Photodermatol., Photoimmunol. Photomed., 1999, 15, 64–74 CrossRef CAS.
- M. Schulz, H. Bialleck, K. Thorausch, G. Bug, U. Dünzinger, E. Seifried and H. Bönig, Unstimulated leukapheresis in patients and donors: comparison of two apheresis systems, Transfusion, 2014, 54, 1622–1629 CrossRef PubMed.
- G. Andreu, A. Leon, F. Heshmatis, M. Tod, C. J. Menkes, J. Baudelot, L. Laroche and F. Heshmati, Extracorporeal photochemotherapy: evaluation of two techniques and use in connective tissue disorders, Transfus. Sci., 1994, 15, 443–454 CrossRef CAS PubMed.
- J. Li, Q. Zhang, J. He, E. Liu, X. Gao and Y. Chang, An improved LC-MS/MS method for simultaneous determination of the eleven bioactive constituents for quality control of Radix angelicae pubescentis and its related preparations, Sci. World J., 2015, 2015, 365093 Search PubMed.
- L.-H. Wang and S.-Y. Jiang, Simultaneous determination of urinary metabolites of methoxypsoralens in human and Umbelliferae medicines by high-performance liquid chromatography, J. Chromatogr. Sci., 2006, 44, 473–478 CAS.
- H. Ehrsson, S. Eksborg, I. Wallin, N. Kållberg and G. Swanbeck, Determination of 8-methoxypsoralen in plasma by electron capture gas chromatography, J. Chromatogr., 1977, 140, 157–164 CrossRef CAS PubMed.
- J. Malakova, P. Zak, I. Jokesova, P. Zivny, M. Blazek, A. Zavrelova and V. Palicka, A GC–MS method for analysis of 8-methoxypsoralen during new immunomodulatory therapy by photopheresis, Chromatographia, 2009, 69, 779–783 CAS.
- J. Gazith, W. Schalla and H. Schaefer, 8-Methoxypsoralen-gas chromatographic determination and serum kinetics, Arch. Dermatol. Res., 1978, 263, 215–222 CrossRef CAS PubMed.
- A. D. Buhimschi and F. P. Gasparro, UVA and UVB-induced 8-Methoxypsoralen photoadducts and a novel method for their detection by surface-enhanced laser desorption ionization time-of-flight mass spectrometry (SELDI-TOF MS), Photochem. Photobiol., 2014, 90, 241–246 CrossRef CAS PubMed.
- K. Ghosh, A furocoumarin, Imperatorin isolated from Urena lobata L. (Malvaceae), Molbank, 2004, 2004, M382 CrossRef.
- D. A. Armbruster and T. Pry, Limit of blank, limit of detection and limit of quantitation, Clin. Biochem. Rev., 2008, 29(Suppl 1), S49–S52 Search PubMed.
- U. Busch, J. Schmid, F. W. Koss, H. Zipp and A. Zimmer, Pharmacokinetics and metabolite-pattern of 8-methoxypsoralen in man following oral administration as compared to the pharmacokinetics in rat and dog, Arch. Dermatol. Res., 1978, 262, 255–265 CrossRef CAS PubMed.
- F. P. Gasparro, R. Dall'Amico, D. Goldminz, E. Simmons and D. Weingold, Molecular aspects of extracorporeal photochemotherapy, Yale J. Biol. Med., 1989, 62, 579–593 CAS.
- C. L. Berger, C. Cantor, J. Welsh, P. Dervan, T. Begley, S. Grant, F. P. Gasparro and R. L. Edelson, Comparison of synthetic psoralen derivatives and 8-MOP in the inhibition of lymphocyte proliferation, Ann. N. Y. Acad. Sci., 1985, 453, 80–90 CrossRef CAS PubMed.
- G. D. Cimino, H. B. Gamper, S. T. Isaacs and J. E. Hearst, Psoralens as photoactive probes of nucleic acid structure and function: organic chemistry, photochemistry, and biochemistry, Annu. Rev. Biochem., 1985, 54, 1151–1193 CrossRef CAS PubMed.
- A. M. El-Mofty, M. N. Nada and M. T. Abdel Aziz, Clinical and laboratory evaluation of 8-methoxypsoralen toxicity, Int. J. Dermatol., 1978, 17, 145–148 CrossRef CAS PubMed.
- K. E. McKenna, S. Whittaker, L. E. Rhodes, P. Taylor, J. Lloyd, S. Ibbotson and R. Russell-Jones, Evidence-based practice of photopheresis 1987–2001: a report of a workshop of the British Photodermatology Group and the U.K. Skin Lymphoma Group, Br. J. Dermatol., 2006, 154, 7–20 CrossRef CAS PubMed.
| This journal is © The Royal Society of Chemistry and Owner Societies 2017 |

