CO2 reduction over NaNbO3 and NaTaO3 perovskite photocatalysts
F.
Fresno
*a,
P.
Jana
b,
P.
Reñones
a,
J. M.
Coronado
b,
D. P.
Serrano
bc and
V. A.
de la Peña O'Shea
*a
aPhotoactivated Processes Unit, IMDEA Energy Institute, Móstoles Technology Park, Avenida Ramón de la Sagra, 3, 28935 Móstoles, Madrid, Spain. E-mail: fernando.fresno@imdea.org; victor.delapenya@imdea.org
bThermochemical Processes Unit, IMDEA Energy Institute, Móstoles Technology Park, Avenida Ramón de la Sagra, 3, 28935 Móstoles, Madrid, Spain
cChemical and Environmental Engineering Group, ESCET, Rey Juan Carlos University, c/Tulipán s/n, 28933 Móstoles, Madrid, Spain
First published on 19th August 2016
Abstract
The activity of NaNbO3 and NaTaO3 perovskites for the photocatalytic reduction of CO2 is studied in this work. For this purpose, sodium niobate and tantalate have been prepared using solid-state reactions, extensively characterised by means of powder X-ray diffraction, UV-vis, photoluminescence and Raman spectroscopies and N2 adsorption isotherms, and tested in the gas-phase reduction of CO2 under UV light in a continuous flow photoreactor. NaNbO3 is constituted of an orthorhombically distorted perovskite structure, while a ca. 4.5![[thin space (1/6-em)]](https://www.rsc.org/images/entities/char_2009.gif) :
:![[thin space (1/6-em)]](https://www.rsc.org/images/entities/char_2009.gif) 1 combination of the orthorhombic and monoclinic modifications is found in the tantalate. Both catalysts exhibit interesting intrinsic activities, with the tantalate material giving rise to a slightly higher performance. This is attributed to a compromise situation between electron–hole recombination and the reducing potential of conduction band electrons. In addition, a decrease in the competition of water protons for photogenerated electrons is observed with both catalysts with respect to TiO2.
1 combination of the orthorhombic and monoclinic modifications is found in the tantalate. Both catalysts exhibit interesting intrinsic activities, with the tantalate material giving rise to a slightly higher performance. This is attributed to a compromise situation between electron–hole recombination and the reducing potential of conduction band electrons. In addition, a decrease in the competition of water protons for photogenerated electrons is observed with both catalysts with respect to TiO2.
Introduction
A promising strategy for CO2 utilisation is the production of fuels and chemicals by means of photocatalytic reduction using water as an electron donor. This process, one of those encompassed in artificial photosynthesis (AP), is based on the use of semiconductor catalysts, and is particularly convenient taking into account that reactions are driven under soft conditions (temperature and pressure) and can take advantage of the use of a sustainable energy source.1 However, although intense effort has been made in the last few years in order to increase the photocatalytic efficiencies of this process, very low quantum yields are still reported in the literature, especially when water is used as the only hole scavenger, without the use of any sacrificial reagent.2–4 The central role in the overall efficiency of photocatalytic processes is played by the semiconductor photocatalyst, able to generate and manage electron–hole pairs upon irradiation with light of photon energy equal to or greater than its band gap. In order to efficiently promote photocatalytic reactions, semiconductors must have the appropriate thermodynamic (band positions), kinetic (surface chemistry) and stability (lack of deactivation or photocorrosion) characteristics. In this respect, one interesting type of semiconductor photocatalyst for the CO2 reaction is that formed by ternary oxides with perovskite structure like alkaline niobates and tantalates, which possess a conduction band with sufficiently high energy to transfer electrons to the CO2 molecule and, at the same time, a valence band with energy low enough to promote water oxidation.5,6 In addition, these perovskite structures have been revealed in the last few years to be particularly suitable for photocatalytic water splitting and hydrogen production from aqueous solutions of sacrificial reagents.5–7 In this line, remarkable results have been obtained with NaNbO3, NaTaO3 and modifications of them in H2 evolution experiments from pure water or with methanol as a hole scavenger.5–11 Although scarcer, some reports have revealed the potential of these structures for CO2 photocatalytic reduction.12–16 In this work, we compare the activities of both types of perovskites obtained under the same synthetic conditions for gas-phase CO2 reduction under UV light irradiation, with an extensive characterisation of the obtained materials by different physico-chemical techniques.Experimental methods
Synthesis
NaNbO3 and NaTaO3 were synthesised by solid-state reactions. Nb2O5 or Ta2O5 was carefully ground together with Na2CO3; the latter was taken in 5% excess with respect to the stoichiometric amount to compensate for volatilisation losses. The mixture was then heated in air in a muffle furnace at 900 °C for 12 h, at a heating rate of 10 °C min−1. Commercial anatase-type titanium dioxide (TiO2, PC500), supplied by CristalACTIV™, was used as an activity reference. Prior to use, TiO2 was stabilised with a thermal treatment at 400 °C for 4 h.Characterisation techniques
The chemical composition of the photocatalysts was quantified using an induced coupled plasma atomic emission spectrometer (ICP-AES, Perkin Elmer 2300 DV). Powder X-ray diffraction (XRD) patterns were recorded with a Panalytical EMPYREAN diffractometer using CuKα radiation (λ = 1.54178 Å) at a scanning rate of 0.01° s−1. N2 adsorption–desorption isotherms were recorded at −196 °C in a QUADRASORB instrument. A Philips Technai 20 transmission electron microscope, operating with a tungsten filament working at 200 kV, was used to obtain TEM images. Raman spectra were recorded at room temperature using a JASCO NRS-5000/7000 series Raman spectrometer with an excitation wavelength of 532 nm. Diffuse reflectance UV-vis spectra were recorded on a UV/Vis/NIR Perkin Elmer Lambda 1050 spectrometer. Photoluminescence experiments were carried out with a Perkin Elmer LS55 fluorescence spectrometer, using an excitation wavelength of 300 nm and a cut-off filter at 350 nm.CO2 reduction experiments
CO2 photoreduction experiments were conducted in continuous flow mode in a gas-phase stainless steel photoreactor, with an effective volume of 280 mL and provided with a borosilicate window for irradiation. The powdered catalysts (0.1 g) were deposited on glass microfibre filters from aqueous suspensions. Pure carbon dioxide (99.9999%, Praxair) and water (Milli-Q) were fed into the reaction system with a CO2![[thin space (1/6-em)]](https://www.rsc.org/images/entities/char_2009.gif) :
:![[thin space (1/6-em)]](https://www.rsc.org/images/entities/char_2009.gif) H2O molar ratio of 7.25 by means of a Controlled Evaporator Mixer (CEM). The reaction conditions were set at 2 bar and 50 °C. Irradiation was provided by four UV fluorescent lamps of 6 W each (λmax = 365 nm). In-line analyses of the reactor outlet gas were performed every 22 minutes using an Agilent 7890A gas chromatograph equipped with three columns (BR-Q Plot, BR-Molsieve 5A and CP-Sil 5B), three detectors (2 FID and 1 TCD) and a methaniser.
H2O molar ratio of 7.25 by means of a Controlled Evaporator Mixer (CEM). The reaction conditions were set at 2 bar and 50 °C. Irradiation was provided by four UV fluorescent lamps of 6 W each (λmax = 365 nm). In-line analyses of the reactor outlet gas were performed every 22 minutes using an Agilent 7890A gas chromatograph equipped with three columns (BR-Q Plot, BR-Molsieve 5A and CP-Sil 5B), three detectors (2 FID and 1 TCD) and a methaniser.
The reactor was firstly degassed at 50 °C under vacuum and then purged with Ar (100 mL min−1) for 1 h in order to remove any residual compounds weakly adsorbed on the surface of the catalyst. Then a CO2 and H2O mixture was fed in the dark for 1 h in order to establish an adsorption–desorption balance at the reaction temperature. Prior to illumination, the reactor was pressurised and kept at the reaction flow rate for another 1 h. All photocatalytic tests were carried out for a period of 15 h of irradiation.
Results and discussion
Characterisation of the photocatalysts
Table 1 summarises the main physicochemical characteristics of NaNbO3 and NaTaO3 photocatalysts. Chemical analyses indicate a good agreement of the obtained compositions with those pursued in the synthetic method (stoichiometric wt% given in brackets in Table 1), with a small defect of sodium that reveals that there still exists an effect of Na volatilisation in spite of the excess of Na2CO3 used in the synthesis.| NaNbO3 | NaTaO3 | |||
|---|---|---|---|---|
| Na (wt%) | 13.2 ± 0.4 [14.0] | 8.2 ± 0.3 [9.1] | ||
| Nb or Ta (wt%) | 59.0 ± 1.2 [56.7] | 75.5 ± 1.5 [71.8] | ||
| BET surface area (m2 g−1) | 1.0 | 1.1 | ||
| E g (eV) | 3.30 | 4.05 | ||
| Crystalline phase | Orthorhombic NaNbO3 | Orthorhombic NaTaO3 | Monoclinic NaTaO3 | Hexagonal Na2Ta4O11 |
| Phase mass % | 100 | 80.3 | 17.3 | 2.4 |
| Lattice parameters (Å, °) | a = 5.504 | a = 5.480 | a = 3.889 | a = b = 6.208 |
| b = 5.568 | b = 7.791 | b = 3.895 | ||
| c = 15.51 | c = 5.522 | c = 3.891 | c = 36.609 | |
| β = 90.398 | ||||
| Crystal size (nm) | 178 | 160 | 165 | 200 |
X-ray diffraction patterns of the obtained materials (Fig. 1) show their characteristic crystalline structure.17 Thus, the NaNbO3 sample is composed of a single phase with an orthorhombically distorted perovskite structure (NaNbO3, ICDD PDF # 01-073-0803). This orthorhombic structure (ICDD PDF # 01-073-0878) is also mainly present in NaTaO3 together with a monoclinically distorted perovskite structure (NaTaO3, ICDD PDF # 01-074-2478), with a minor contribution of an additional hexagonal phase (natrotantite Na2Ta4O11, ICDD PDF # 01-084-0810). The results of Rietveld refinement of the powder diffractograms of the above mentioned structures are included in Table 1. The natrotantite phase is present in a ca. 2.5% amount in the NaTaO3 sample, which contains a ca. 4.5![[thin space (1/6-em)]](https://www.rsc.org/images/entities/char_2009.gif) :
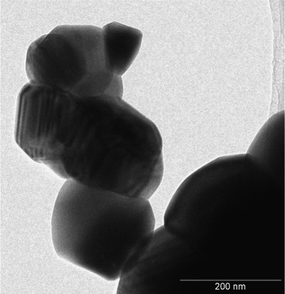
:![[thin space (1/6-em)]](https://www.rsc.org/images/entities/char_2009.gif) 1 orthorhombic/monoclinic NaTaO3 proportion. Only slight deviations (maximum 0.15%) exist in cell parameters with respect to the reference structures. Large crystal sizes are found in both metallates, as could be expected considering that they were obtained by solid-state synthesis at high temperature. These large sizes are confirmed by TEM images, an example of which is shown in Fig. 2. In agreement with this, both catalysts present low surface areas, with values around 1 m2 g−1. In accordance with the synthesis temperature, the nitrogen adsorption isotherms (not shown) are of type-II in both cases, indicating that the solids are not porous and that the specific surface area is due to the external surface of the particles.
1 orthorhombic/monoclinic NaTaO3 proportion. Only slight deviations (maximum 0.15%) exist in cell parameters with respect to the reference structures. Large crystal sizes are found in both metallates, as could be expected considering that they were obtained by solid-state synthesis at high temperature. These large sizes are confirmed by TEM images, an example of which is shown in Fig. 2. In agreement with this, both catalysts present low surface areas, with values around 1 m2 g−1. In accordance with the synthesis temperature, the nitrogen adsorption isotherms (not shown) are of type-II in both cases, indicating that the solids are not porous and that the specific surface area is due to the external surface of the particles.
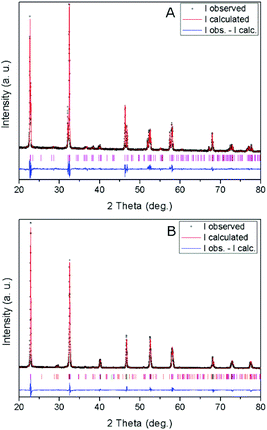 | ||
| Fig. 1 XRD patterns and profile fits of (A) NaNbO3 and (B) NaTaO3. Vertical lines show the Bragg reflections corresponding to the refined phases (see text and Table 1). | ||
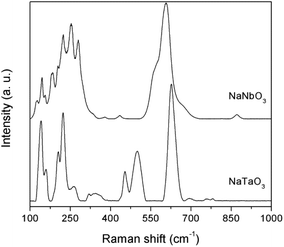
The structural characterisation was complemented by Raman spectroscopy (Fig. 3). The bands in the Raman spectra are well matched with those described in the literature for NaNbO3![[thin space (1/6-em)]](https://www.rsc.org/images/entities/char_2009.gif) 18,19 and NaTaO3.20 Typical spectral profiles of perovskite structures, with intense bands in the 100–300 and 400–700 cm−1 regions, are observed. Thus, the NaNbO3 spectrum shows bands at 125, 144 and 155 cm−1 corresponding to the librational modes of the NbO6 octahedra. The rest of the observed bands are generated by the internal vibrations of the NbO6 octahedra, with the triply degenerate F2u and F2g modes giving rise to the profile observed in the 170–300 cm−1 region, and the intense shouldered band centered at 605 cm−1, which is assignable to symmetric stretching modes. The low intensity bands observed at ca. 380 and 435 cm−1 are indicative of a tilting angle between adjacent octahedra that deviates the NaNbO3 crystalline phase from the ideal perovskite structure, as observed in the X-ray diffractograms discussed above.21 Also in line with the XRD data for NaNbO3, the weak band at 870 cm−1 corresponds to a combination mode in centrosymmetric space goups.22 Similar assignments can be made for NaTaO3. The spectrum presents bands at 140, 160, 204, and 222 cm−1 that are characteristic of Na translational vibration modes, which in the case of NaNbO3 appear at Raman shifts below 100 cm−1 and are not observed due to the used Rayleigh filter.18 The bands at 263, 318 and 345 cm−1 can be assigned to the bending modes of TaO6 octahedra, and those at 453, 499, and 626 cm−1 correspond to Ta–O stretching modes, with possible combination bands appearing at 693 and above 750 cm−1. This band distribution is in good agreement with the main presence of an orthorhombic NaTaO3 phase in this catalyst.23
18,19 and NaTaO3.20 Typical spectral profiles of perovskite structures, with intense bands in the 100–300 and 400–700 cm−1 regions, are observed. Thus, the NaNbO3 spectrum shows bands at 125, 144 and 155 cm−1 corresponding to the librational modes of the NbO6 octahedra. The rest of the observed bands are generated by the internal vibrations of the NbO6 octahedra, with the triply degenerate F2u and F2g modes giving rise to the profile observed in the 170–300 cm−1 region, and the intense shouldered band centered at 605 cm−1, which is assignable to symmetric stretching modes. The low intensity bands observed at ca. 380 and 435 cm−1 are indicative of a tilting angle between adjacent octahedra that deviates the NaNbO3 crystalline phase from the ideal perovskite structure, as observed in the X-ray diffractograms discussed above.21 Also in line with the XRD data for NaNbO3, the weak band at 870 cm−1 corresponds to a combination mode in centrosymmetric space goups.22 Similar assignments can be made for NaTaO3. The spectrum presents bands at 140, 160, 204, and 222 cm−1 that are characteristic of Na translational vibration modes, which in the case of NaNbO3 appear at Raman shifts below 100 cm−1 and are not observed due to the used Rayleigh filter.18 The bands at 263, 318 and 345 cm−1 can be assigned to the bending modes of TaO6 octahedra, and those at 453, 499, and 626 cm−1 correspond to Ta–O stretching modes, with possible combination bands appearing at 693 and above 750 cm−1. This band distribution is in good agreement with the main presence of an orthorhombic NaTaO3 phase in this catalyst.23
Fig. 4 shows the diffuse reflectance UV-vis spectra of NaNbO3 and NaTaO3. As expected, the sharp absorption edge for NaTaO3 appears at a higher energy than in the case of NaNbO3.5,7,12–16 Their corresponding band gap (Eg) values, included in Table 1, were calculated from Tauc plots considering a direct transition in NaTaO3, in accordance with the main contribution of the orthorhombic phase,24 and an indirect transition in the case of NaNbO3.25 The obtained values are in good accordance with those described in the literature for these phases.12–16,24,25 The valence band potentials of NaTaO3 and NaNbO3 are similar because both consist of O2p orbitals and the oxygen anions coordinate to Ta5+ or Nb5+ ions, which have the same ionic radius.8 Hence the difference in the band gaps arises from the higher energy (more negative reduction potential) of Ta 5d orbitals, forming the conduction band of NaTaO3, with respect to Nb 4d orbitals forming the conduction band of NaNbO3. Assuming that the valence band potentials in oxides with metal ions without partially filled d levels lie at 2.94 V vs. SHE within 2% deviation,8,26 a band potential diagram like that shown in Fig. 5 can be deduced from the Eg values obtained from UV-vis spectra.
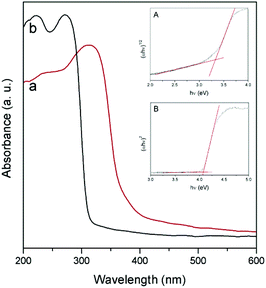 | ||
| Fig. 4 UV-vis diffuse reflectance spectra of NaNbO3 (a) and NaTaO3 (b). Insets: Tauc plots for NaNbO3 (A) and NaTaO3 (B). | ||
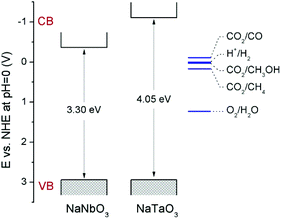 | ||
| Fig. 5 Schematic representation of the band potentials of NaNbO3 and NaTaO3. Relevant CO2 reduction potentials have been taken from ref. 33. | ||
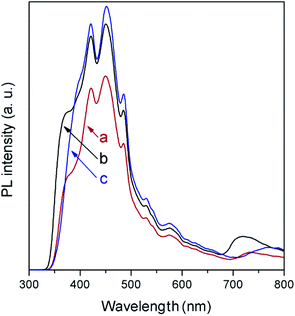
In agreement with the absorption spectra, photoluminescence (PL) measurements (Fig. 6) show a slight displacement of the band-to-band recombination emission (only the tail of which is observed due to the used cut-off filter) to lower wavelength when moving from NaNbO3 to NaTaO3. The low-energy part of the spectra is composed of a broad emission band in the 400–600 cm−1 region, as is generally observed in ABO3 perovskites,27,28 and is formed by several contributions related to excitons and oxygen vacancies. In this region, it is observed that the PL intensity is lower in NaNbO3, which in general terms can be related to slower electron–hole recombination.29
Photocatalytic activity for CO2 reduction
Fig. 7 shows the accumulated amounts of the main reaction products over 15 h of irradiation, compared to those obtained with TiO2 PC500 (SBET = 165.8 m2 g−1). In all cases, the main CO2 reduction products are CO, CH4 and CH3OH, together with H2 coming from the concomitant reduction of water competing with that of CO2. Trace amounts of other products like C2+ hydrocarbons and ethanol are obtained, with similar amounts for different catalysts. Reactions carried out in an argon atmosphere under irradiation gave rise to product evolution of less than 2% with respect to the tests performed feeding CO2 + H2O, indicating that the evolved gases in the presence of CO2 and H2O do not arise from adventitious carbon contamination on the surface of the photocatalysts.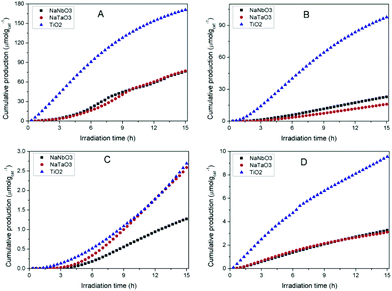 | ||
| Fig. 7 Evolution of the main products obtained in the photocatalytic reduction of CO2 over NaNbO3, NaTaO3 and TiO2: (A) CO, (B) H2 (C) CH4, (D) CH3OH. | ||
In spite of their low surface areas (see Table 1), both NaNbO3 and NaTaO3 give rise to product amounts comparable to those with titania, although the production attained with the latter is considerably larger in all cases except for CH4. However, if the results are referred to the surface area unit, which would reflect the intrinsic photoactivity of the materials, the production with the synthesised metallates reveals considerable interest. In line with this, the measured PL spectrum of TiO2 (Fig. 6), with slightly higher intensity than those of both perovskite materials, reveals that the larger net production with titania cannot be explained only in terms of photogenerated charge carrier utilisation.
The comparison of NaNbO3 and NaTaO3 shows very similar production of CO and CH3OH, with the latter giving rise to a larger amount of CH4 and a lower amount of H2. Overall, the total amount of carbon products is slightly larger (ca. 2%) for sodium tantalate. In comparative terms, the production results reported here for NaNbO3 and NaTaO3 are competitive with those previously reported for this kind of structure, especially if production normalised to a specific surface area is considered.12–16
Fig. 8 depicts the selectivities towards the main reaction products obtained with the different catalysts, calculated on the basis of these products only. The high selectivity to CO rather than to highly reduced carbon products (e.g. CH4) is a common characteristic of oxide photocatalysts without the presence of a metal co-catalyst.30 In the case of TiO2 this CO selectivity comes together with a considerable production of H2 due to a hardly avoidable competition for conduction band electrons by CO2 and H2O molecules.31,32 In the case of the metallates reported here, the selectivity towards carbon monoxide is even increased with respect to titania, and this comes mainly at the expense of hydrogen production as observed in Fig. 8. Therefore, the mentioned electron competition is interestingly shifted towards the reduction of CO2 with the present catalysts, and is especially remarkable in the case of NaTaO3. A similar observation can be made regarding the selectivity of this catalyst towards methane, which is twice that obtained with both NaNbO3 and TiO2.
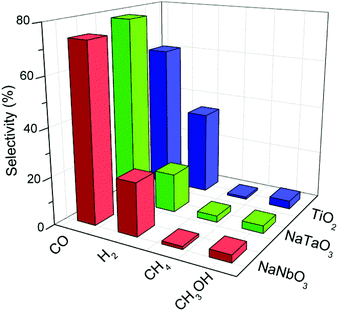 | ||
| Fig. 8 Selectivities towards the main products obtained in the photocatalytic reduction of CO2 over NaNbO3, NaTaO3 and TiO2. | ||
Therefore, it is demonstrated here that, in spite of the low surface area obtained by means of the solid-state synthetic method, both NaNbO3 and NaTaO3 perovskites exhibit interesting intrinsic activities for the photocatalytic reduction of CO2 under UV irradiation. The comparison of the photoactivity of these metallates and their opto-electronic properties reveals the effect of opposed factors: on the one hand, NaNbO3 presents a lower electron–hole recombination as revealed by its PL spectrum (Fig. 5); on the other hand, as explained in the discussion of UV-vis spectra and displayed in Fig. 5, the electrons in the conduction band of NaTaO3 have a higher energy (more negative reduction potential) than those in NaNbO3, which implies a larger driving force for reduction reactions.33 Similar observations in this last respect have been made in photocatalytic hydrogen production reactions.8,9,11 As a result of these two factors, both perovskites give rise to similar conversions in the CO2 reduction reaction, with slightly higher carbon product evolution over NaTaO3.
Regarding structural aspects, the presence of a monoclinic phase in the NaTaO3 sample may also play a role in its photocatalytic performance. According to the literature,34 the monoclinic phase of NaTaO3 leads to a Ta–O–Ta angle closer to 180°, more favourable for charge delocalisation. In addition, some authors have proposed a positive effect of multi-phase NaTaO3 samples for CH4 evolution in the photocatalytic reduction of CO2.15
An additional interesting feature of these photocatalysts is their lower selectivity towards hydrogen with respect to TiO2, which suggests that these structures drive the competition between CO2 and H2O for conduction band electrons towards the reduction of carbon dioxide. This result is especially remarkable in the case of NaTaO3, which also shows higher methane selectivity.
Conclusions
NaNbO3 and NaTaO3 perovskite photocatalysts have been prepared by solid-state reactions, extensively characterised and tested for the reduction of CO2. X-ray diffraction studies reveal the niobate material to be composed of an orthorhombically distorted perovskite structure, while the tantalate is mainly formed by a ca. 4.5![[thin space (1/6-em)]](https://www.rsc.org/images/entities/char_2009.gif) :
:![[thin space (1/6-em)]](https://www.rsc.org/images/entities/char_2009.gif) 1 combination of the orthorhombic and monoclinic modifications. In spite of their low surface area, both catalysts exhibit interesting intrinsic activities for the photocatalytic reduction of CO2 under UV irradiation, with the tantalate material giving rise to a slightly higher performance attributed to a compromise situation between photogenerated electron–hole utilisation and the reducing potential of conduction band electrons. Interestingly, both NaNbO3 and NaTaO3 seem to drive the competition between CO2 and H2O for conduction band electrons towards the reduction of carbon dioxide, as reflected by a lower selectivity to H2 in the photocatalytic process. This result is especially remarkable in the case of sodium tantalate.
1 combination of the orthorhombic and monoclinic modifications. In spite of their low surface area, both catalysts exhibit interesting intrinsic activities for the photocatalytic reduction of CO2 under UV irradiation, with the tantalate material giving rise to a slightly higher performance attributed to a compromise situation between photogenerated electron–hole utilisation and the reducing potential of conduction band electrons. Interestingly, both NaNbO3 and NaTaO3 seem to drive the competition between CO2 and H2O for conduction band electrons towards the reduction of carbon dioxide, as reflected by a lower selectivity to H2 in the photocatalytic process. This result is especially remarkable in the case of sodium tantalate.
Acknowledgements
This work has received financial support from the Spanish Ministry of Economy and Competitiveness through the projects Hybrid-Leaf (CTQ2014-51487-ERC) and SolarFuel (ENE2014-55071-JIN) and from the Region of Madrid (program MAD2D, S2013/MIT-3007). F. F. acknowledges financial support from the Amarout-II PEOPLE-COFUND Marie Skłodowska-Curie Action (REA grant agreement no. 291803). Support from the Repsol Technology Centre is gratefully acknowledged.Notes and references
- V. A. de la Peña O'Shea, D. P. Serrano and J. M. Coronado, in Molecules to Materials. Pathways to Artificial Photosynthesis, ed. E. Rozhkova and K. Ariga, Springer, London, 2015, pp. 171–191 Search PubMed.
- S. Protti, A. Albini and N. Serpone, Photocatalytic generation of solar fuels from the reduction of H2O and CO2: a look at the patent literature, Phys. Chem. Chem. Phys., 2014, 16, 19790–19827 RSC.
- F. Fresno, R. Portela, S. Suárez and J. M. Coronado, Photocatalytic materials: recent achievements and near future trends, J. Mater. Chem. A, 2014, 2, 2863 CAS.
- L. Yuan and Y.-J. Xu, Photocatalytic conversion of CO2 into value-added and renewable fuels, Appl. Surf. Sci., 2015, 342, 154–167 CrossRef CAS.
- F. E. Osterloh, Inorganic materials as catalysts for photochemical splitting of water, Chem. Mater., 2008, 20, 35–54 CrossRef CAS.
- P. Kanhere and Z. Chen, A review on visible light active perovskite-based photocatalysts, Molecules, 2014, 19, 19995–20022 CrossRef CAS PubMed.
- M. D. Hernández-Alonso, F. Fresno, S. Suárez and J. M. Coronado, Development of alternative photocatalysts to TiO2: challenges and opportunities, Energy Environ. Sci., 2009, 2, 1231–1257 Search PubMed.
- H. Kato and A. Kudo, Water splitting into H2 and O2 on alkali tantalate photocatalysts ATaO3 (A=Li, Na, and K), J. Phys. Chem. B, 2001, 105, 4285–4292 CrossRef CAS.
- J. W. Liu, G. Chen, Z. H. Li and Z. G. Zhang, Hydrothermal synthesis and photocatalytic properties of ATaO3 and ANbO3 (A=Na and K), Int. J. Hydrogen Energy, 2007, 32, 2269–2272 CrossRef CAS.
- P. Jana, C. Mata Montero, P. Pizarro, J. M. Coronado, D. P. Serrano and V. A. de la Peña O'Shea, Photocatalytic hydrogen production in the water/methanol system using Pt/RE:NaTaO3 (RE=Y, La, Ce, Yb) catalysts, Int. J. Hydrogen Energy, 2014, 39, 5283–5290 CrossRef CAS.
- P. Jana, V. A. de la Peña O'Shea, C. Mata Montero, P. Gálvez, P. Pizarro, J. M. Coronado and D. P. Serrano, Mixed NaNbxTa1−xO3 perovskites as photocatalysts for H2 production, Green Chem., 2015, 17, 1735–1743 RSC.
- H. Shi, G. Chen, C. Zhang and Z. Zou, Polymeric g-C3N4 coupled with NaNbO3 nanowires toward enhanced photocatalytic reduction of CO2 into renewable fuel, ACS Catal., 2014, 4, 3637–3643 CrossRef CAS.
- H. Shi, T. Wang, J. Chen, C. Zhu, J. Ye and Z. Zou, Photoreduction of carbon dioxide over NaNbO3 nanostructured photocatalysts, Catal. Lett., 2011, 141, 525–530 CrossRef CAS.
- H. Zhou, P. Li, J. Guo, R. Yan, T. Fan, D. Zhang and J. Ye, Artificial photosynthesis on tree trunk derived alkaline tantalates with hierarchical anatomy: towards CO2 photo-fixation into CO and CH4, Nanoscale, 2015, 7, 113–120 RSC.
- P. Li, H. Xu, L. Liu, T. Kako, N. Umezawa, H. Abe and J. Ye, Constructing cubic-orthorhombic surface-phase junctions of NaNbO3 towards significant enhancement of CO2 photoreduction, J. Mater. Chem. A, 2014, 2, 5606–5609 CAS.
- M. Li, P. Li, K. Chang, T. Wang, L. Liu, Q. Kang, S. Ouyang and J. Ye, Highly efficient and stable photocatalytic reduction of CO2 to CH4 over Ru loaded NaTaO3, Chem. Commun., 2015, 51, 7645–7648 RSC.
- A. Torres-Pardo, R. Jiménez, E. García-González and J. M. González-Calbet, Phase coexistence in NaNb(1-x)TaxO3 materials with enhanced dielectric properties, J. Mater. Chem., 2012, 22, 14938–14943 RSC.
- Y. Shiratori, A. Magrez, J. Dornseiffer, F.-H. Haegel, C. Pithan and R. Waser, Polymorphism in micro-, submicro-, and nanocrystalline NaNbO3, J. Phys. Chem. B, 2005, 109, 20122–20130 CrossRef CAS PubMed.
- G. Li, T. Kakoa, D. Wanga, Z. Zoub and J. Ye, Composition dependence of the photophysical and photocatalytic properties of (AgNbO3)1-x(NaNbO3)x solid solutions, J. Solid State Chem., 2007, 180, 2845–2850 CrossRef CAS.
- S. P. Phivilay, A. A. Puretzky, K. Domen and I. E. Wachs, Nature of catalytic active sites present on the surface of advanced bulk tantalum mixed oxide photocatalysts, ACS Catal., 2013, 3, 2920–2929 CrossRef CAS.
- J.-M. Jehng and I. E. Wachs, Structural chemistry and Raman spectra of niobium oxides, Chem. Mater., 1991, 3, 100–107 CrossRef CAS.
- V. Shanker, S. L. Samal, G. K. Pradhan, C. Narayana and A. K. Ganguli, Nanocrystalline NaNbO3 and NaTaO3: Rietveld studies, Raman spectroscopy and dielectric properties, Solid State Sci., 2009, 11, 562–569 CrossRef CAS.
- N. G. Teixeira, A. Dias and R. L. Moreira, Raman scattering study of the high temperature phase transitions of NaTaO3, J. Eur. Ceram. Soc., 2007, 27, 3683–3686 CrossRef CAS.
- W.-H. Lin, C. Cheng, C.-C. Hu and H. Teng, NaTaO3 photocatalysts of different crystalline structures for water splitting into H2 and O2, Appl. Phys. Lett., 2006, 89, 211904 CrossRef.
- P. Li, S. Ouyang, Y. Zhang, T. Kako and J. Ye, Surface-coordination-induced selective synthesis of cubic and orthorhombic NaNbO3 and their photocatalytic properties, J. Mater. Chem. A, 2013, 1, 1185–1191 CAS.
- D. E. Scaife, Oxide semiconductors in photoelectrochemical conversion of solar energy, Sol. Energy, 1980, 25, 41–54 CrossRef CAS.
- G. F. Teixeira, T. R. Wright, D. C. Manfroi, E. Longo, J. A. Varela and M. A. Zaghete, Photoluminescence in NaNbO3 particles and films, Mater. Lett., 2015, 139, 443–446 CrossRef CAS.
- Y.-C. Lee, H. Teng, C.-C. Hu and S.-Y. Hu, Temperature-dependent photoluminescence in NaTaO3 with different crystalline structures, Electrochem. Solid-State Lett., 2008, 11, P1–P4 CrossRef CAS.
- J. Liqiang, Q. Yichun, W. Baiqi, L. Shudan, J. Baojiang, Y. Libin, F. Wei, F. Honggang and S. Jiazhong, Review of photoluminescence performance of nano-sized semiconductor materials and its relationships with photocatalytic activity, Sol. Energy Mater. Sol. Cells, 2006, 90, 1773–1787 CrossRef.
- S. Xie, Q. Zhang, G. Liu and Y. Wang, Photocatalytic and photoelectrocatalytic reduction of CO2 using heterogeneous catalysts with controlled nanostructures, Chem. Commun., 2016, 52, 35–59 RSC.
- L. Collado, P. Jana, B. Sierra, J. M. Coronado, P. Pizarro, D. P. Serrano and V. A. de la Peña O'Shea, Enhancement of hydrocarbon production via artificial photosynthesis due to synergetic effect of Ag supported on TiO2 and ZnO semiconductors, Chem. Eng. J., 2013, 224, 128–135 CrossRef CAS.
- L. Collado, A. Reynal, J. M. Coronado, D. P. Serrano, J. R. Durrant and V. A. de la Peña O'Shea, Effect of Au surface plasmon nanoparticles on the selective CO2 photoreduction to CH4, Appl. Catal., B, 2015, 178, 177–185 CrossRef CAS.
- X. Li, J. Yu and M. Jaroniec, Hierarchical photocatalysts, Chem. Soc. Rev., 2016, 45, 2603–2636 RSC.
- C. C. Hu, C. C. Tsai and H. Teng, structure characterization and tuning of perovskite-like NaTaO3 for applications in photoluminescence and photocatalysis, J. Am. Ceram. Soc., 2009, 92, 460–466 CrossRef CAS.
| This journal is © The Royal Society of Chemistry and Owner Societies 2017 |

