An approach to utilize the artificial high power LED UV-A radiation in photoreactors for the degradation of methylene blue
L. A.
Betancourt-Buitrago
,
C.
Vásquez
,
L.
Veitia
,
O.
Ossa-Echeverry
,
J.
Rodriguez-Vallejo
,
J.
Barraza-Burgos
,
N.
Marriaga-Cabrales
and
F.
Machuca-Martínez
 *
*
Universidad del Valle. Chemical Engineer School, Cali, Colombia. E-mail: fiderman.machuca@correounivalle.edu.co
First published on 5th December 2016
Abstract
Utilization of UV LED light is trending in the development of photoreactors for pollutant treatment. In this study, two different geometries were studied in the degradation of methylenebBlue (MB) using high power UVA LED as a source of light. The dosage, initial concentration, electric power, and H2O2 addition were evaluated in the two geometries: a mini CPC (Cilindrical Parabolic Collector) and a vertical cylindrical with external irradiation both coupled with LED UVA. Best degradation was obtained for 0.3 g L−1 TiO2, 40 min, and 15 ppm of MB of initial concentration in the standard batch reactor. It was found that the best system was a cpc geometry. Also, hydrogen peroxide was used as an electron acceptor and 97% degradation was obtained in 30 min with 10 mM H2O2 and 0.4 g TiO2/L. Power of the LEDs was also evaluated and it was found that 20 W m−2 is the best operational condition to achieve the best MB degradation avoiding the oxidant species recombination.
Introduction
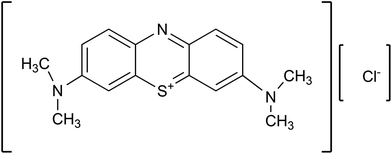
Methylene blue is an aromatic heterocyclic chemical used in the medicine as an antiseptic, skin healing, and fungicide in aquaculture. In addition, it can be used for the microscopic bacteria tanning, and dyeing cotton, silk, and wool (Fig. 1).Around 15% of the worldwide dyes used for textile processing are liberated in wastewaters, causing pollution in the aquatic ecosystems.1 This molecule is recalcitrant to solar photolysis, which makes it necessary to explore a new process to eliminate the dye content in the industrial wastewater. Advanced Oxidation Processes (AOPs) are an alternative for the degradation of high recalcitrant substances. Heterogeneous photocatalysis is a promising AOP for the recalcitrant wastewater treatment. This technique is based on the direct or indirect absorption of the visible or UV light by a semiconductor, in particular TiO2. On the surface of the semiconductor, the redox reactions by the photogenerated electron–hole pair occur.2
As an alternative to solar light, the photoreactors that use artificial light, such as LED (Light Emitting Diodes), are being developed.3 UV-LEDs are a safer alternative to halide and mercury lamps, and are more energy efficient as a source of photons (by only requiring between 6 and 28 watts of electricity depending on the amount of lumens), and have about 100 times long-lasting life.4–6 Fluorescent lights require electricity between 40 and 150 watts and they are far more fragile and less portable.
LED photoreactors are being used in the homogeneous and heterogeneous catalysis.7Table 1 summarizes some of the studies for the photodegradation of the dyes from the textile industry.
| Type of photoreactor | LED power | Dye | Description |
|---|---|---|---|
| Batch cylindrical | 8 mW cm−2 | Methylene blue, malachite green, direct blue-15, amaranth | 95% degradation/4 h |
| 125 mL | 30 LED | TiO2 immobilized in mosquito netting | |
| 350 nm | Evaluated number of LED and H2O2 addition8 | ||
| Batch | 39 mW cm−2 | Methylene blue phenol red and methyl red | 100% degradation/3 h |
| 200 mL | 405 nm and 73 mW cm−2 | CdS microspheres | |
| Year 450 nm | Glucose addition to avoid the photocorrosion9 | ||
| Continuous photoreactor with three impregnated pipes with TiO2 | 15 LED UV | Methylene blue, Rhodamine B and malachite green | 100% degradation/100 min |
| 390–410 nm | Alkaline condition benefits degradation10 | ||
| CSTR system | 40 W m−2 | Reactive black 5 | 89% degradation/10 h |
| 96 LED UV-A | TiO2 Degussa P2511 | ||
| 375 nm | |||
| Batch | 8 mW cm−2 | Direct blue-15 | 90% degradation/3 h |
| 125 mL | 30 LED | TiO2 nanoflowers are better than nanotubes and nanospheres12 | |
| 350 nm | |||
| Batch | 60 mW UVLED | Rhodamine B | 99% degradation/120 min |
| 150 mL | 390–410 nm | Best photocatalyst BiOCl with UV LED13 | |
| 50 mW | |||
| BLED | |||
| 430–505 nm | |||
| 50 mW | |||
| GLED | |||
| 525–570 nm | |||
| 50 mW | |||
| RLED | |||
| 630–660 nm | |||
| Batch | 23 W m−2 | Reactive black 5 | 100% degradation/40 min |
| 110 mL | 96 LED UVA | 85 W m−2 LED UVA are better than solar radiation14 | |
| 375 nm | |||
| 85 W m−2 | |||
| 12 LED | |||
| 365 nm | |||
| Batch with immobilized catalyst on the walls | 6 LED UV | Direct red 23 | 97% degradation/30 min |
| 385 nm | Addition of S2O82− improves photoxidation15 | ||
| Batch | 5 LED UV | Rhodamine B | 100% degradation/180 min |
| 125 mL | 390–410 nm | Addition of H2O2 enhances oxidation, but metal addition decrease the oxidative process16 |
Although there are studies with several cylindrical and parabolic geometries, it has not been compared with a small CPC to conclude the feasibility of using this UVLED with this geometry instead of solar light.
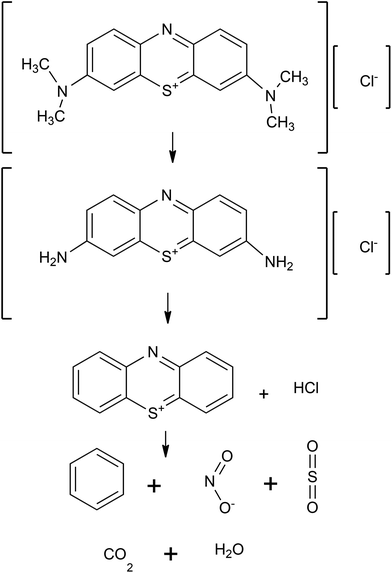
The particular case of study will be the degradation of methylene blue, as shown in Fig. 2. The route proceeds with the N-dealkylation of the auxochromic alkylamine groups. At the end, the MB is transformed into H2O, CO2, and other inorganic molecules.17,18
In this study, the viability to use UV-LED as a source of light in the MB degradation using heterogeneous photocatalysis with TiO2 was evaluated. Two different geometries: a mini CPC (Compound Parabolic Collector) and a cylindrical batch UVLED illuminated reactor were compared.
Experimental
Photocatalyst and chemicals
Methylene blue trihydrate (CAS 7220-79-3), Duksan pure chemicals Co., Ltd. As catalyst titanium dioxide (AEROXIDE TiO2 P25) and deionized water. Air from a compressor was used to supply enough dissolved oxygen in the photoreactor.Photoreactors
System A: The photoreactor comprises a 1 L pyrex vessel 10 cm diameter externally illuminated with an effective volume of 500 mL. 4 LED of 30 W TY-365 nm 30 W High Power Ultra Violet (395–495 nm) each were placed in opposite sides (30–36 V DC, 0.7–1.0 A for all 4 LEDs plugged in parallel) with a viewing angle 115–125 degrees and output optical radiation of 900–1200 mW per LED.System B: The photoreactor comprises a mini CPC of 4 pyrex tubes, with 2 cm outer diameter, 11 cm length, connected to a 2 L vessel with an effective volume of 600 mL. The system used a centrifugal pump from a washing machine. An LED-UV light source was placed on the top of the pyrex tubes. For both systems, the LEDs-UV were adapted with small PC fan at 12 V to avoid overheating. The power supply was carried out using EXTECH instruments 382280 (Fig. 3) and the intensity of irradiation was varied with the amperes supplied to the LEDs at 30 V.
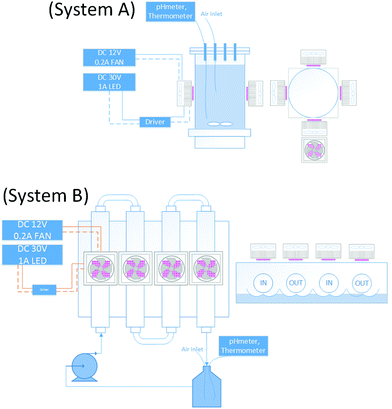 | ||
| Fig. 3 System A: Schematic for the batch photoreactor. System B: Schematic for the mini CPC photoreactor. | ||
For both systems, each LED consumed no more than 0.2 A at 30 VDC to give an irradiation output of 30 W m−2. Irradiation was about 1.2 W per LED and electrical consumption was about 6 W, which led to an optical efficiency of ca. 20%.
The MB concentration was determined using Spectroquant Pharo 300 Merck spectrophotometer at 660 nm using 10 mL of sample. Dissolved oxygen and pH was monitored using a multiparameter Orion 4Star. UV-A irradiation was measured for each LED using a radiometer Delta OHM HD 2102.2 UV-A at a distance of 1 cm from the LEDs. Photocatalytic degradation was normalized using C/C0, where C0 and C are the initial and final concentration of the dye, respectively. Mineralization of MB was measured with Total Organic Carbon Shimadzu TOC-V-CPH.
Operational conditions
All solutions were prepared with deionized water under normal pressure and temperature conditions. Air flow rate was ca. 0.5 L min−1 to provide enough dissolved oxygen and promote the mixing in the vessel. The system A operated at 200 rpm (Re > 30![[thin space (1/6-em)]](https://www.rsc.org/images/entities/char_2009.gif) 000), and the system B at 8.6 L min−1 (Re > 15
000), and the system B at 8.6 L min−1 (Re > 15![[thin space (1/6-em)]](https://www.rsc.org/images/entities/char_2009.gif) 000). The reactive volume used was 0.6 L; 10 mL of the aliquots was taken to monitor the degradation.
000). The reactive volume used was 0.6 L; 10 mL of the aliquots was taken to monitor the degradation.
Experimental procedure
First, the amount of catalyst that presented best degradation (catalyst load), keeping initial MB concentration constant was established. The amount of catalyst was varied from 0.2 to 1.6 g TiO2/L and from 5–20 ppm of MB. The best amount of catalyst load was selected for each system for the rest of the study.After the catalyst amount was selected, initial MB concentration was changed after 4 h of reaction. Finally, the electrical power of the light system was evaluated using the best catalyst load and initial MB concentration. The pH was 7.1 to promote good adsorption on the catalyst (cationic dye). The reactor was closed and was maintained in a dark period to allow the adsorption to equilibrate.
Results
Catalyst load effect
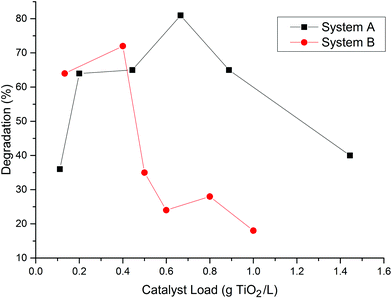
Fig. 4 shows the best results obtained in the MB degradation at 15 ppm of initial concentration for 2 h of reaction. Results shows that when over 0.4 g TiO2/L is used, there is a decrease in the MB degradation, which may be related to the screening effect of the solution for the system A. On the other hand, system B allowed a superior catalyst load showing a greater light penetration for the pyrex tubes.This suggests that system A is more efficient in light utilization than system B because it is able to reach the same photodegradation using a lower amount of catalyst.
It has been reported that even at dosages of about 1.0 g L−1 of TiO2, there is no screening effect in the photocatalytic effect.19 On the other hand, loads over 1.5 g TiO2/L, have been reported as inhibitory in the light utilisation due to the overshadow generated in the solution.7 This geometry was more effective with a lower catalyst dosage, which may be related to the geometry of the photoreactor, source of light, and the pyrex diameter. All the subsequent experimental data was done with the best catalyst load found for each geometry.
Methylene blue initial concentration effect
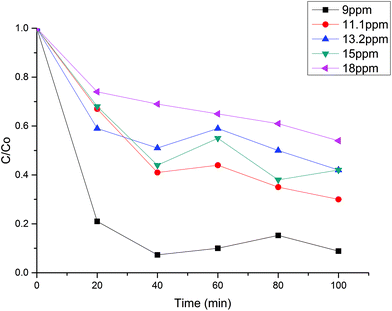
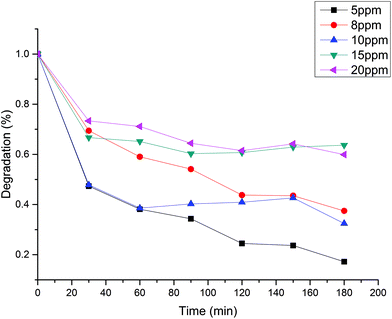
Initial MB concentration was evaluated between 5–20 ppm using the best TiO2 dosage in each system (Fig. 5 and 6). Results show that higher MB concentration decreases the degradation, reached at a similar reaction time. It may suggest the inhibition in the transfer of photons to the catalyst due to an increase in the absorbance of the substrate as it turns dark blue.Assuming negligible volume in the connecting lines, a perfectly stirred tank and the reaction occurring only in the reactor volume, the mass balance of a batch-recycle reactor can be written as follows:
 | (1) |
 | (2) |
 | (3) |
 | (4) |
Table 2 shows the apparent kinetic constant for different initial concentration at the best catalyst load for each system. It can be seen that the photocatalytic degradation is enhanced by the low MB concentration, with system B being 1.8 times faster than system A at an initial MB concentration of ca. 8 ppm. In spite of the higher specific velocity of reaction in the system B, the evolution of the MB degradation is faster for system A (Fig. 5 and 6) due to the lack of dilution of the reactive volume. However, the lower specific velocity of the reaction for system A may be related to a low light penetration of the vessel. This is enhanced in system B, where the light has an optical patch of less than 2 cm.
| Initial MB concentration (ppm) | k′ (10−2 min−1) | |
|---|---|---|
| System A (θ = 1) | System B (θ = 0.22) | |
| 5 | — | 6.51 |
| 9 | 1.82 | — |
| 8 | — | 3.41 |
| 11.1 | 1.13 | — |
| 10 | — | 2.26 |
| 13.2 | 0.67 | — |
| — | 2.19 | |
| 15 | 0.84 | — |
| 20 | — | 1.75 |
| 18 | 0.53 | — |
Supplied power effect
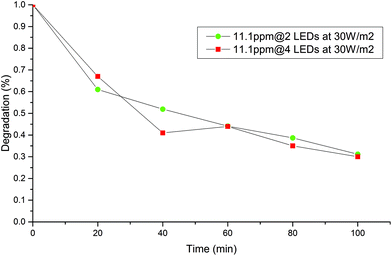
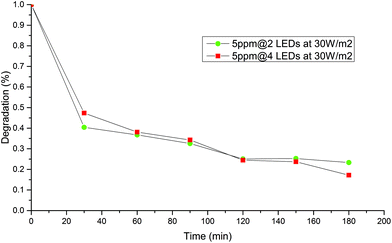
Fig. 7 and 8 shows the effect of decreasing the exposed area to the irradiation turning off 2 of the 4 LEDs at the best initial concentration and catalyst dosage. No significant difference in the decrease of MB concentration was observed when area of illumination was decreased to half. It may be possible that 4 LEDs of 30 W m−2 may provide more light than the system could exploit from the configuration for both systems. This means that kinetics become independent of the irradiation field and a zero order in the irradiance field is observed along with unnecessary energy consumption.20It is well known that the concentration of light is an important factor in achieving better photodegradation of pollutants, however, in this case, both geometries are over irradiated, and the chemical reaction is likely rate limiting under these working conditions. In light of this, geometry was a determinant factor for an appropriated light harvesting, and the batch system A was the best one.
Effect of the peroxide addition and the power
Hydrogen peroxide is a well-known electron acceptor for redox reactions on the semiconductor surface creating more hydroxyl radicals which promote the degradation kinetics.21 However, an excess of illumination led to low MB degradation, suggesting a competitive reaction with the oxidant species. Fig. 9 shows that over 20 W m−2, the efficiency of the MB oxidation drops from 97% to 74%. It could be related to the recombination process of hydroxyl, perhydroxyl or electron–hole pairs on the semiconductor.18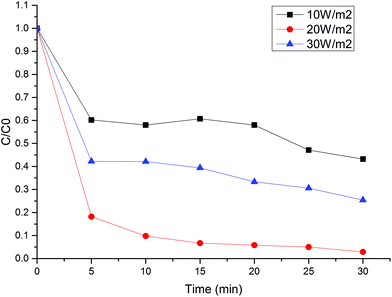 | ||
| Fig. 9 Hydrogen peroxide addition with different power irradiation. 5 ppm MB, 0.3 g L−1 TiO2, 10 mM H2O2, system B. | ||
Decolorization is the first step in the degradation of inks. According to the results in Fig. 10, although more than 80% of the MB degradation was achieved in 180 min (Fig. 6), not all the mineralization process was achieved during the photocatalytic oxidation. An optimization has to be done to achieve the lower energy consumption not only to the high UVLED power but also to the scavenger concentration. Despite the low amount of mineralization, system B resulted in a higher specific rate of reaction. This would be a better configuration to take an advantage of the artificial LED irradiation than system A. However, the dilution factor (θ) has to be increased closer to unit to warranty the total volume illuminated and to reduce the slow decrease of the MB concentration in the CPC system.
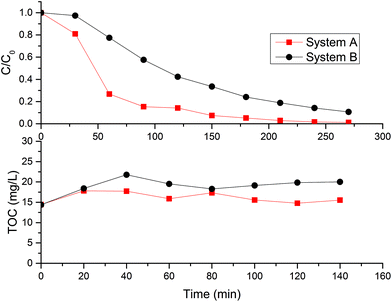 | ||
| Fig. 10 Mineralization of MB with hydrogen peroxide addition. 20 ppm MB, 10 mM H2O2, 20 W m−2 with 4 LEDs and best load for each system. | ||
Compared to other lamps and solar systems, UVLED photoreactors may be a suitable option not only for MB degradation but also for other types of pollutants. Although CPC reactors have been the geometry most appropriated to harvest the solar photon flux, it may be possible to distribute the radiative field in different geometries for LED UV arranges. In that case, no need of concentration of light may be necessary with focused LED UV light. Then, simpler and homogeneous flat plate UV photoreactors may be an option that benefits the optical patch and maintenance of the reactive system. In contrast, other authors have been able to degrade this dye, but with higher times of operation. The comparison with other studies using MB and TiO2/UVLED is shown in Table 3.
| System | Catalyst/light source | Degradation/time | MB degraded (g g−1 h−1) |
|---|---|---|---|
| Multipass quartz tube reactor | TiO2 supported on quartz tubes/15 UV-A LED 12 mW | 100%/300 min (ref. 22) | 1.7 |
| Submerged cylindrical LED UVA | TiO2-immobilized/UVA 8 mW cm−2 | 95% degradation/4 h (ref. 8) | 1.7 |
| Cylindrical batch | CdS/UVA LED 25 W | 100% degradation/3 h (ref. 9) | 18.5 |
| Coupled UV lamp + visible LED array | 0.5 mW/cm2 visible LED/Ni-TIO2 | 45%/180 min (ref. 23) | 92.6 |
| Cylindrical batch | LED visible/20 W/Ag3PO4/ZnFe2O4 | 90%/60 min (ref. 24) | 8.3 |
| Petri dish | Blue LED/3 W/PDMS-TiO2 | 73%/8 h (ref. 25) | 20.8 |
| Petri dish | White LED/3 W/BaFe12O19 | 70%/360 min (ref. 26) | 111.1 |
| Cylindrical cell | UV LED/3 W/m-TiO2 | 90%/120 min (ref. 27) | 16.7 |
| This study | UV LED/TiO2/20 W m−2 | 99%/30 min | 119.0 |
Conclusion
Two different geometries of the photoreactors were evaluated to enhance the degradation of MB using high power LED UV-A in a local fabricated photoreactor. Two geometries were evaluated: mini CPC (Cylindrical Parabolic Collector) and vertical cylindrical with external irradiation both coupled with LED UVA. Best configuration was the mini CPC because of its ability to concentrate the radiation and its low optical path although a lower dilution factor to avoid non-reactive dark volumes. Thus, it was evidenced that the LEDs are an effective source of light for the photocatalytic reactions. Hydrogen peroxide addition resulted in an increase in the photocatalytic treatment; however, excessive UV from the LEDs inhibited the MB degradation. Further examination is required to find the optimal operation conditions that could reach the high kinetic behavior at low energy consumption.Acknowledgements
To the Project “Recuperación de oro y tratamiento de aguas residuales CI 2832” from Colciencias-Univalle-SGC, and to the Project “Síntesis de catalizadores para tratamiento de aguas residuales de minería” CI 2827.References
- A. Houas, Appl. Catal., B, 2001, 31, 145–157 CrossRef CAS.
- X. Doménech, W. F. Jardim and M. I. Litter, Eliminacion de contaminantes por fotocatalisis heterogenea, CYTED, 2001 Search PubMed.
- W.-K. Jo and R. J. Tayade, Chin. J. Catal., 2014, 35, 1781–1792 CrossRef CAS.
- W. Jo and R. J. Tayade, Ind. Eng. Chem. Res., 2014, 53, 2073–2084 CrossRef CAS.
- R. J. Tayade, T. S. Natarajan and H. C. Bajaj, Ind. Eng. Chem. Res., 2009, 48, 10262–10267 CrossRef CAS.
- W. Kuen and R. J. Tayade, Chin. J. Catal., 2014, 35, 1781–1792 CrossRef.
- H. Huang, D. Y. C. Leung, P. C. W. Kwong, J. Xiong and L. Zhang, Catal. Today, 2013, 201, 189–194 CrossRef CAS.
- W.-K. Jo and R. J. Tayade, Biochem. Pharmacol., 2016, 4, 319–327 CAS.
- E. Repo, S. Rengaraj, S. Pulkka, E. Castangnoli, S. Suihkonen, M. Sopanen and M. Sillanpää, Sep. Purif. Technol., 2013, 120, 206–214 CrossRef CAS.
- K. Natarajan, T. S. Natarajan, H. C. Bajaj and R. J. Tayade, Chem. Eng. J., 2011, 178, 40–49 CrossRef CAS.
- L. C. Ferreira, M. S. Lucas, J. R. Fernandes and P. B. Tavares, J. Environ. Chem. Eng., 2016, 4, 109–114 CrossRef CAS.
- W.-K. Jo and R. J. Tayade, J. Mater. Eng. Perform., 2016, 25, 83–90 CrossRef CAS.
- K. Natarajan, H. C. Bajaj and R. J. Tayade, J. Ind. Eng. Chem., 2016, 34, 146–156 CrossRef CAS.
- J. Rodríguez-Chueca, L. C. Ferreira, J. R. Fernandes, P. B. Tavares, M. S. Lucas and J. A. Peres, J. Environ. Chem. Eng., 2015, 3, 2948–2956 CrossRef.
- M. Rasoulifard, M. Fazli and M. Eskandarian, J. Ind. Eng. Chem., 2014, 20, 3695–3702 CrossRef CAS.
- T. S. Natarajan, M. Thomas, K. Natarajan, H. C. Bajaj and R. J. Tayade, Chem. Eng. J., 2011, 169, 126–134 CrossRef CAS.
- T. Zhang, T. Oyama, A. Aoshima, H. Hidaka, J. Zhao and N. Serpone, J. Photochem. Photobiol., A, 2001, 140, 163–172 CrossRef CAS.
- K. Dai, L. Lu and G. Dawson, J. Mater. Eng. Perform., 2013, 22, 1035–1040 CrossRef CAS.
- L. C. Ferreira, M. S. Lucas, J. R. Fernandes and P. B. Tavares, J. Environ. Chem. Eng., 2016, 4, 109–114 CrossRef CAS.
- W. K. Jo and H. J. Kang, Chin. J. Catal., 2012, 33, 1672–1680 CrossRef CAS.
- K. Villa, S. Murcia-López, T. Andreu and J. R. Morante, Appl. Catal., B, 2015, 163, 150–155 CrossRef CAS.
- K. Natarajan, T. S. Natarajan, H. C. Bajaj and R. J. Tayade, Chem. Eng. J., 2011, 178, 40–49 CrossRef CAS.
- B. I. Stefanov, N. V. Kaneva, G. L. Puma and C. D. Dushkin, Colloids Surf., A, 2011, 382, 219–225 CrossRef CAS.
- M. Ge, Y. Chen, M. Liu and M. Li, J. Environ. Chem. Eng., 2015, 3, 2809–2815 CrossRef CAS.
- J. H. Lee, E. J. Park, D. H. Kim, M. Jeong and Y. D. Kim, Catal. Today, 2016, 260, 32–38 CrossRef CAS.
- C. Valero-Luna, S. A. Palomares-Sanchéz and F. Ruíz, Catal. Today, 2016, 266, 110–119 CrossRef CAS.
- N. G. Moustakas, A. G. Kontos, V. Likodimos, F. Katsaros, N. Boukos, D. Tsoutsou, A. Dimoulas, G. E. Romanos, D. D. Dionysiou and P. Falaras, Appl. Catal., B, 2013, 130–131, 14–24 CrossRef CAS.
| This journal is © The Royal Society of Chemistry and Owner Societies 2017 |

