 Open Access Article
Creative Commons Attribution 3.0 Unported Licence
The spectroscopic impact of interactions with the four Gouterman orbitals from peripheral decoration of porphyrins with simple electron withdrawing and donating groups
Angel
Zhang
 ,
Lydia
Kwan
and
Martin J.
Stillman
 *
*
Stillman Bioinorganic Group, Department of Chemistry, The University of Western Ontario, 1151 Richmond Street, London, Ontario, Canada N6A 5B7. E-mail: martin.stillman@uwo.ca
First published on 7th September 2017
Abstract
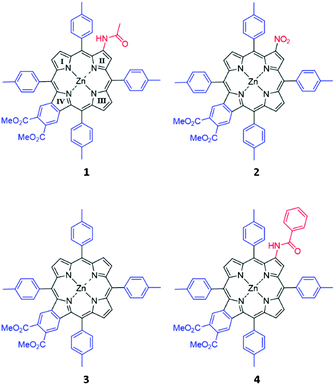
Tetrapyrroles are of great interest for solar cell and photodynamic therapy applications due to their structural analogy with chlorophyll, a natural photosensitizer. Unsubstituted symmetric porphyrins exhibit weak absorption in the red region which makes them unsuitable for these applications. The push–pull peripheral decoration modifies the energies of the frontier molecular orbitals, which in turn influences the tetrapyrrole's spectroscopic properties. The absorption, magnetic circular dichroism, and emission spectra were measured for four zinc tetratolylporphyrin compounds substituted peripherally with a fused dimethoxybenzo group as an electron withdrawing group (EWG) on one pyrrole and on the opposite pyrrole, a single acetamido (1), a nitro (2), a proton (3), or a benzoylamino (4) substituent. Unusually, the magnetic circular dichroism spectrum of 2 exhibited a negative A term for the lowest energy absorption band (the Q band) and its emission spectrum was also unlike those of 1, 3, and 4. A complete computational analysis was carried out to obtain the energies and electron distribution, shown by electron density surfaces, of the four Gouterman MOs. TD-DFT calculations showed that for 2, ΔLUMO was greater than ΔHOMO, which accounted for the observed negative A term. The trend in the estimated MCD A term magnitudes, normalized to the absorbance as [A/(dipole strength) BM], provides experimental confirmation of the computationally determined ratio of ΔLUMO/ΔHOMO data. The value of ΔHOMO was confirmed by the trend in oscillator strengths. A series of fictive porphyrins (F1–F5) incorporating simple push–pull substituents were designed and their electronic structures were investigated using TD-DFT calculations. The substituents in the five fictive molecules illustrate the differential effect of the donor and acceptor groups in the β-position of the pyrroles on the relative stabilities of the four Gouterman orbitals. NO2 groups result in the greatest splitting of the LUMO pair. We show that on using strong EWGs, opposite electron donating groups result in a ΔLUMO > 0, which red-shifts the Q band and introduces a strong dipole. With the nitro and formyl EWGs, ΔLUMO becomes greater than ΔHOMO, resulting in a complex electronic structure of the Q band, recognizable by a negative A term suggesting a design objective for future photosensitizers.
Introduction
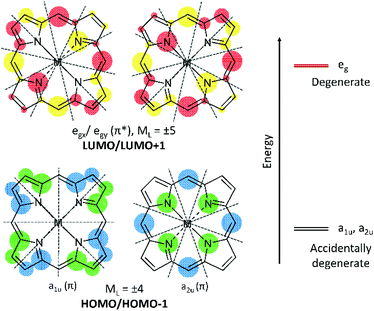
Natural tetrapyrroles exhibit remarkable and often astounding chemical and photophysical properties, for example, see the many reviews in “The Handbook of Porphyrin Science”.1 In particular, the photophysics of tetrapyrroles dominates all life.2,3 The aromaticity of the 18 π electrons results in a π electronic structure, which, in very basic terms, involves a series of both occupied (π) and unoccupied (π*) molecular orbitals (MOs).4–6 The highest occupied MO (HOMO) for tetrapyrroles is identified by the l = 4 orbital angular momentum quantum number that is associated with a principle quantum number of n = 4 of the 18 π electrons. Nominally, for the C16H162− parent of the 18 π electron tetrapyrrole, the HOMO and HOMO−1 of symmetry eu will be degenerate, each component with four nodes (at 450 to each other) and the lowest unoccupied molecular orbital (LUMO) and LUMO+1 will also be a degenerate eg pair but with five nodes each (Fig. 1). The introduction of the four-fold axis of the tetrapyrrole breaks the degeneracies of the eu orbitals into a1u and a2u orbitals defined by even angular momentum values, l = 2, 4, 6, etc. Typically for symmetric tetrapyrroles, the eg orbitals with odd-numbered angular momentum, l = 1, 5, 7, etc., remain degenerate. For porphyrins, a1u and a2u are often found to be accidentally degenerate, but this depends on the peripheral decoration. A split in these two orbitals usually result in the a2u being the highest occupied orbital.7 Critically important is the orientation of the nodes for the HOMOs and LUMOs as the orientation of the nodal planes has significant consequences for the optical and redox properties of both the natural and the synthetic porphyrins. Nature tunes the redox properties of the π ring, the energy of the first excited state (S1), and also the redox properties of the centrally coordinated metal to carry out a range of roles including the photochemistry of chlorophyll,8 the ligand binding of heme b,9 and the enzymatic chemistry of p450,10 as three examples. Nature achieves this through peripheral decoration, axial coordination of the metal, and the electrostatic environment of the ring. Of these many natural roles, the development of synthetic analogues of tetrapyrroles for photochemistry is perhaps of greatest current technological interest, with applications in solar cells11,12 and photodynamic therapy.13 For both these applications, the key requirement is a molecule with an intense and red absorbing lowest excited state.The spectroscopic properties of tetrapyrroles, particularly in this study, the porphyrins, have been interpreted as being primarily dependent on the two highest occupied and two lowest unoccupied MOs.14 Using fairly limited computational resources compared with today, Martin Gouterman and his group over a 20 year period were able to demonstrate how the relative energies of these four orbitals explained the spectra of tetrapyrroles, for example, porphyrins, chlorins, and phthalocyanines. The blue region band (S0 → S2), termed as the B or Soret band, originates from the allowed transitions between the four orbitals. The lowest energy absorption band in the red region (S0 → S1) arises from forbidden transitions and is termed as the Q band.4,6 In a symmetric molecule, the first excited state, S1, is a degenerate state comprising Qx and Qy components, which gives rise to a symmetric, positive Faraday A term in the MCD spectra. While it is true that these four frontier orbitals contribute significantly to the Q band of the simpler rings, the introduction of peripheral substitutions that interact with the π system can change the electronic structure significantly and dramatically change the orbital contributions to the Q band. It is these subtle modifications that can be used to tune the energies and oscillator strengths of the Q band of tetrapyrroles for technological advantages in solar energy conversion15–17 and photodynamic cancer therapy.13,18
Applications in both solar energy conversion and photodynamic therapy need a band in the red region to carry out electron transfer or singlet oxygen production, respectively. Tetrapyrroles, particularly porphyrins, can exhibit a dramatically increased absorption oscillator strength in the red region with the appropriate substituents. In other words, they can be tuned to exhibit a red-shifted and intense Q band. This can be achieved with peripherally substituted phthalocyanines because the aza-substitution of the four methine bridges in the ring selectively affects the a2u molecular orbital of the HOMO degenerate pair more than the a1u orbitals, introducing a significant energy split of over 2 eV. The splitting of the two usually degenerate orbitals breaks the selection rule that leads to the Q band being forbidden and allows borrowing of intensity from the fully allowed B band. Further red shifts of the Q band of phthalocyanines can be achieved with peripheral substituents that reduce the LUMO–HOMO gap by, for example, extensive delocalization using aromatic groups.19–24 We have previously reported the connection between EHOMO–(HOMO−1) (ΔHOMO) and the Q band oscillator strength and the connection between ELUMO–HOMO and the Q band energy.25 For both parameters, we reported a reasonably linear trend between the experimental data and the computational results.
While synthetic phthalocyanines do provide a strongly absorbing and red-shifted Q band, for example the linked porphyrin arrays of Kim and Osuka22 and the porphyrin tapes of Tsuda and Osuka,21 these molecules themselves are often poorly soluble, aggregate easily, and are expensive to make and purify in the bulk required for commercial applications. Nature has provided many guides to the tuning of porphyrins for specific tasks, particularly, the chlorophylls’ roles in photosynthesis.3,26–28 A key feature in the chlorophylls’ electronic structure is how the few atoms of specific peripheral substituents of the π ring break the degeneracy of both the LUMO and HOMO pair.29 These two properties result in the lowering of the LUMO energy from the introduction of a large ΔLUMO and also a concomitant increase in the magnitude of the ΔHOMO. The splitting of both the LUMO pair and HOMO pair results in an intense and red Q band.
In this paper, we describe the analysis of the optical properties of β-substituted zinc porphyrins using magnetic circular dichroism (MCD) spectroscopy to both identify the presence of an extensively split LUMO pair and support the results of computational analysis of the electronic states. The computational analysis provided the interpretation of the underlying reasons that both the HOMO and LUMO degenerate pairs split in energy as a function of specific substitutions. The results highlight the requirement for nonsymmetric delocalization on the pyrrole rings as a means of splitting the LUMO pair, which leads to a preferred red-shifted Q band. The combination of a red and intense Q band, a panchromatic response, and the transfer of electrons will result in efficient photosensitizers. We explore the effect of simple electron withdrawing and donating groups to reduce the HOMO–LUMO gap and to facilitate the electron displacement onto the frontier orbitals using a series of synthesized push–pull porphyrins and designed fictive molecules.
Materials and methods
The porphyrins shown in Fig. 2 were a gift from Prof. Hong Wang, Miami University, Ohio, and their synthesis and characterization have been previously described.30 The compounds were used as supplied. The sample solution was prepared by dissolving each compound in dichloromethane (DCM). Baseline corrections for MCD and UV-visible absorption spectroscopy were carried out using a 1 cm quartz cuvette containing DCM. The sample solutions were transferred into the same cuvette for measurement.Absorption and emission spectra
Absorption spectra were recorded on a Varian Cary 500 absorption spectrometer (Varian, Toronto, Canada), and emission spectra were recorded on a PTI Quanta Master instrument (PTI, London, Ontario, Canada) with a xenon lamp. All measurements were carried out at room temperature.MCD spectra
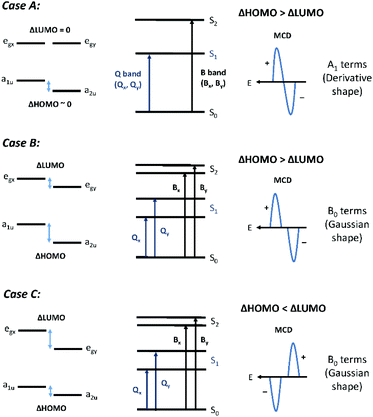
MCD spectra were recorded on a Jasco J-810 CD instrument (Jasco Inc., New Jersey, USA) using a 1.4 T permanent magnet (Olis Inc., Georgia, USA). MCD spectra are characterized by three band morphologies:31,32 the Faraday A term for transitions to a degenerate excited state, the Faraday B term for transitions to nondegenerate excited states, and the Faraday C term for transitions from an orbitally degenerate ground state. For the compounds described in this paper, only A and B terms were observed because the ground states were all orbitally nondegenerate. However, when the symmetry is lower than D4h, pseudo A terms comprising equal and opposite B terms will be the only morphology actually measured.Fig. 3 shows the three different band morphologies predicted for the effect of reduced electronic degeneracies as a function of peripheral substitution of the porphyrin ring. These experimental morphologies, while inherent in the original descriptions of the MCD spectral band shapes,31 were described specifically by Michl in 1978.33 Normally, for most tetrapyrroles, the degenerate Gouterman HOMO pair will split to different extents with either a1u or a2u as the HOMO. The LUMO pair remains degenerate. This splitting pattern, Case A, will result in strong positive A terms with a negative-to-positive sign pattern sequence with increasing energy. Case B represents the situation where both the LUMO and HOMO degeneracies are broken but ΔHOMO is greater than ΔLUMO. This is typical for very low symmetry porphyrins, and a pair of equal and oppositely signed B terms will be observed. The B term magnitudes will be weaker as the energy separation of the x,y components increases, but the sign pattern will remain unchanged. The sign sequence will again depend on the sign pattern of the A term parent. In Case C, geometrical and electronic effects split the LUMO pair significantly, so that ΔLUMO becomes greater than ΔHOMO. Under these conditions, a positive-to-negatively signed A term, or pair of B terms, will be measured with increasing energy. This inverted A term (a negative A term or pair of B terms) means that the angular momentum of the excited state is less than that of the ground state and so the state is very unusual for an aromatic molecule.
Computational methods
The models of the four compounds were drawn using the Scigress Modelling software.34 The Gaussian G09 program35 was used to carry out DFT ground state geometry optimizations and TD-DFT single point excited state calculations. The CAM-B3LYP functional and 6-31G(d,p) basis set were used for both DFT and TD-DFT calculations.Results
The optical data of compounds 1–4
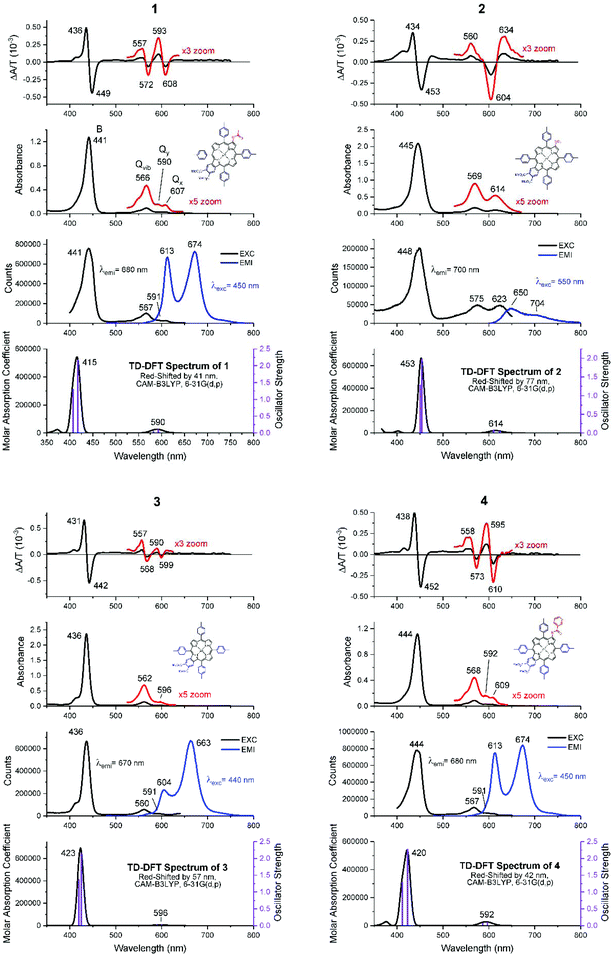
Fig. 4 shows the absorption, MCD, and emission spectra of the β-substituted porphyrins 1–4 shown in Fig. 2. In addition, Fig. 4 shows the calculated TD-DFT spectra to be discussed below, to allow a direct comparison with the experimental data. The absorption spectra of all four compounds are typical of those of tetra-aryl Zn-porphyrins (e.g. zinc tetraphenylporphyrin, ZnTPP),25 in which, the Q band (Q00) is significantly weaker than its higher energy vibronic component (Qvib) and overall, is less than ca. 10% of the intensity of the B band, reflecting the forbidden nature of the Q band.4,6 As we will see below, the origin of this very small (in fact approaching zero) oscillator strength is the accidental degeneracy of the two highest occupied orbitals and, therefore, the structure represented by the parent 18 π C16H162− polyene where the oscillator strength of the first excited state, fS1 = 0.5 The energies and electronic surfaces of the HOMO pair and LUMO pair for compounds 1–4 are shown in Fig. 5 and 6. The Q band of 2 is red-shifted by over 20 nm compared with 1, 3, and 4, with Q00 at 614 nm.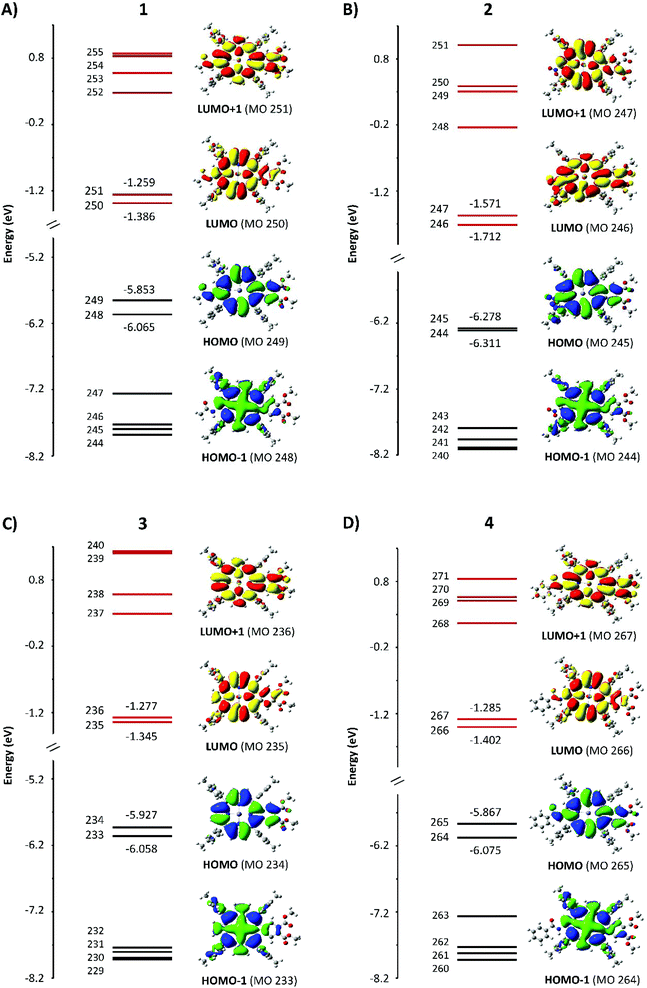 | ||
| Fig. 5 Energies of HOMO−5 to LUMO+5 with the electron density surfaces of the four Gouterman orbitals for the four compounds. | ||
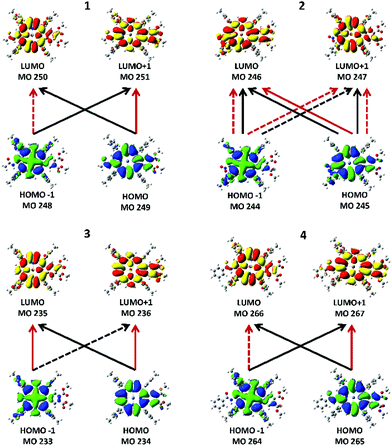 | ||
| Fig. 6 Major transitions between the four Gouterman MOs that give rise to the two Q band states from TD-DFT calculations. Black lines are transitions that contribute to the lower excited state, Q−1, and red lines show transitions that contribute to the upper excited state, Q+1. Each of the states can involve both positive and negative contributions from the two LUMOs and the two HOMOs. The solid lines represent positive contributions (+ in Table 2) and the dotted lines show transitions that contribute via a negative phase (− in Table 2). | ||
The MCD spectra of 1, 3, and 4 (top row in Fig. 4) also follow the pattern for tetra-aryl zinc porphyrins exhibiting the expected sequence of two positive A terms aligned with the Q band (Q00) and the higher energy vibronic band (Qvib). For 1 and 4, the MCD spectra indicate that Q00 is actually split into its Qx and Qy components (shown in Fig. 4). Using 1 as an example, the negative 608 nm peak in the MCD spectrum corresponds to the 607 nm absorption band (Qx) and the positive 593 nm MCD band corresponds to the absorption at 590 nm (Qy). The vibronic band at 566 nm is also observed to be a composite of multiple transitions. Note that because the MCD band shape is observed to be like an A term but Qx and Qy are split, the shape is referred to as a “pseudo A term” where it is composed of equal and opposite B terms (Fig. 3). The split Qx and Qy components observed in the absorption spectra are mirrored by the calculations, where two separate states are seen under the very weak Q band (row four in Fig. 4). The MCD spectrum of compound 2 is quite different as it is dominated by a negative A term (or pseudo A term) in the Q band region (Fig. 3). The B band region also shows the presence of negative A terms in the overall band envelope with the positive band at 476 nm. As mentioned above, the absorption spectra of all four compounds are similar and do not provide an indication of the difference in the electronic structure that results in a reversal on the angular momentum change between the ground and excited states in just compound 2. We will discuss the geometric and electronic origins of this angular momentum change below.
Row three in Fig. 4 shows the emission and excitation spectra of all four compounds. As for the MCD spectral data, the emission spectral data of compounds 1, 3, and 4 are typical of those of tetra-aryl-Zn porphyrins, with a pair of strong bands that mirror the Qx excited state and ground state vibrations. However, the peripheral substituents of compound 3 enhanced the ground state vibronic structure, making emission to the ground state vibration (663 nm) more intense. The emission of 2 is unlike the emission of the other species in that the 650 nm band is stronger than the 704 nm band and both are very weak. Also, there is a significant Stokes shift between the absorption and emission (∼25 nm) whereas the Stokes shifts of the other compounds are ca. 5–6 nm. In addition, the excitation spectrum of 2 does not match the absorption spectrum closely, which suggests that the excited state may be relaxed. This is important because the MCD spectra also indicated that the excited state is different when compared with those of 1, 3, and 4.
With respect to the visible absorption spectra of 1–4, the ratio of the B/Q relative intensities based on the TD-DFT calculated oscillator strengths, f, agree well with the relative intensities observed in the experimental spectra of approximately 10![[thin space (1/6-em)]](https://www.rsc.org/images/entities/char_2009.gif) :
:![[thin space (1/6-em)]](https://www.rsc.org/images/entities/char_2009.gif) 1. The TD-DFT calculations overestimate the S1 and S2 energies so the theoretical spectra were red-shifted manually to better match the experimental spectra as there is no ambiguity in the experimental assignments. ZINDO/s calculations would give a much better match to the experimental Q band energy. However, ZINDO/s calculations only consider the valence orbitals of the ring atoms, so the energies and the numbers of higher energy transitions that are more greatly influenced by core orbitals, starting with the B band (S2), are incorrectly calculated.
1. The TD-DFT calculations overestimate the S1 and S2 energies so the theoretical spectra were red-shifted manually to better match the experimental spectra as there is no ambiguity in the experimental assignments. ZINDO/s calculations would give a much better match to the experimental Q band energy. However, ZINDO/s calculations only consider the valence orbitals of the ring atoms, so the energies and the numbers of higher energy transitions that are more greatly influenced by core orbitals, starting with the B band (S2), are incorrectly calculated.
The electronic structures of compounds 1–4
The results of the DFT and TD-DFT calculations are shown in Fig. 5 and 6, with the TD-DFT calculated absorption spectra shown in row 4 in Fig. 4. The energy levels of the orbitals above and below the HOMO and LUMO largely control the optical and redox properties of tetrapyrroles. We have plotted HOMO to (HOMO−5) and LUMO to (LUMO+5), together with the electron density surfaces of HOMO, HOMO−1, LUMO, and LUMO+1. Table 1 shows the values of the HOMO–LUMO gap, ΔHOMO, and ΔLUMO. The four Gouterman orbitals of 1, 3, and 4 are split by an average of 0.18 eV for the HOMO pair and 0.1 eV for the LUMO pair. This difference in the energies of the four frontier MOs arises from the reduction of symmetry due to the β-substituents and their sensitive location on the aromatic ring periphery of the pyrrole rings. Compound 2 is unusual in which the ΔLUMO is four times greater than the ΔHOMO and its ΔHOMO is less than that of ZnTPP (0.07 eV).| eV | 1 | 2 | 3 | 4 |
|---|---|---|---|---|
| LUMO–HOMO | 4.467 | 4.566 | 4.582 | 4.465 |
| ΔHOMO | 0.212 | 0.033 | 0.131 | 0.207 |
| ΔLUMO | 0.127 | 0.141 | 0.068 | 0.118 |
The surfaces shown in Fig. 5 provide an excellent view of the electron distribution and show the nodal planes that identify the four Gouterman orbitals. For all four compounds, unusually for a porphyrin, the a1u orbitals, with nodes through the pyrrole nitrogen and methine bridges, lie above the a2u. Another significant feature is that the lowest energy eg orbital for 1, 3, and 4 has nodal planes through pyrroles I and III. For 2, the same orbital is LUMO+1. It is clear from the surfaces that the fused dimethoxybenzo group plays an important role in the electron distribution of the HOMO and LUMO orbitals. The single acetamido (1), the nitro (2), and the benzoylamino (4) groups at the β position on the opposite pyrrole only contribute to the a1u orbital, which is the HOMO in these compounds. In each of 1–4, there is only a single benzo group. Because 3 also has a1u as the HOMO, this indicates that the effect of the orbital energy is due to the presence of the dimethoxybenzo groups, resulting in a ΔHOMO of 0.13 eV. This can be compared with the ΔHOMO of 1.01 eV for zinc tetrabenzporphyrin (ZnTBP), and of 0.07 eV for ZnTPP (vide infra, Fig. 9), suggesting that the influence of the benzo group is actually mildly donating to the a1u orbital, which results in it being the HOMO. On the other hand, for 2, the introduction of the NO2 group is clearly strongly electron withdrawing because the energies of all four orbitals are stabilized, and the ΔHOMO reduces to 0.03 eV. This is important because this makes the ΔHOMO significantly less than the ΔLUMO (Table 1). We should note that the peripheral substituents can interact with the four Gouterman MOs in such a way that the nodal patterns clearly shown here are selectively lost.16,17
Origins of the optical spectra
Fig. 6 shows the electronic transitions between the four MOs that give rise to the Qx and Qy states. The lower energy state is labeled as Q−1 and arises from the transitions indicated by the black lines. The upper state is labeled as Q+1 and its transition composition is shown using red lines. Table 2 provides the molecular orbital contributions to the states. While the two states in 1, 3, and 4 show the typical combinations of tetraarylporphyrins involving two contributing transitions, each state in 2 unusually involves four transitions. The calculated optical spectra shown in row four in Fig. 4 are all very similar, with the B and Q bands both consisting of two states each, with the relative intensities typical of tetraarylporphyrins. The optical spectra show no indication of the more complex nature of the excited state contribution for 2.| Compound | State | State energy (nm) | Transition | Transition composition |
|---|---|---|---|---|
| 1 | Q−1 | 551.93 | 248 → 251 | 0.42190 |
| 249 → 250 | 0.55830 | |||
| Q+1 | 541.40 | 248 → 250 | −0.48243 | |
| 249 → 251 | 0.50623 | |||
| 2 | Q−1 | 546.06 | 244 → 246 | 0.39536 |
| 244 → 247 | −0.28872 | |||
| 245 → 246 | 0.32534 | |||
| 245 → 247 | 0.38236 | |||
| Q+1 | 532.94 | 244 → 246 | −0.32584 | |
| 244 → 247 | −0.36435 | |||
| 245 → 246 | 0.41095 | |||
| 245 → 247 | −0.28845 | |||
| 3 | Q−1 | 543.55 | 233 → 236 | −0.44622 |
| 234 → 235 | 0.53385 | |||
| Q+1 | 532.69 | 233 → 235 | 0.48435 | |
| 234 → 236 | 0.49898 | |||
| 4 | Q−1 | 553.08 | 264 → 267 | 0.41949 |
| 265 → 266 | 0.55194 | |||
| Q+1 | 542.73 | 264 → 266 | −0.47570 | |
| 265 → 267 | 0.50330 |
The electronic structures of fictive compounds
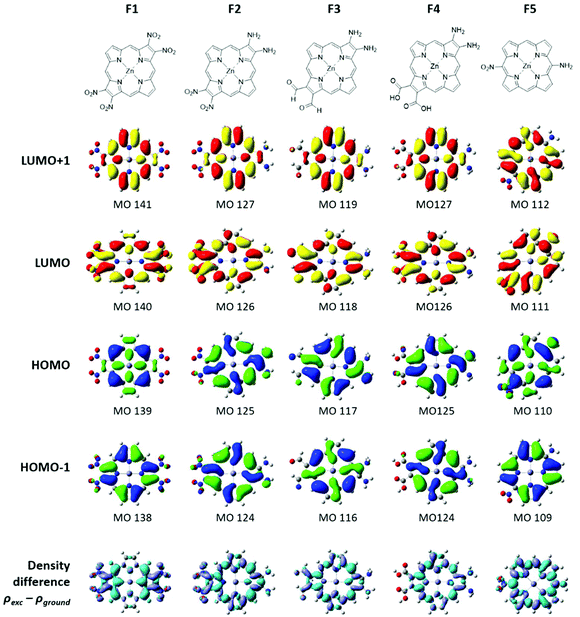
Five fictive compounds, labeled F1–F5 (Fig. 7), were designed with push and pull substituents to study the effect of NO2 on the pyrrole β-position. By substituting both β positions on opposite pyrroles, F1 mimics compound 2 in which both sides are electron withdrawing, although NO2 is a far more powerful withdrawing group than the dimethoxybenzo group. For F2, one pyrrole was replaced with the electron donating NH2 to achieve a push–pull functionality. For F3 and F4, one pyrrole was substituted with two NH2 groups and the opposite pyrrole was substituted with formyl (CHO) and carboxylic acid (COOH) groups, respectively. The formyl group is an important substituent in chlorophyll and carboxylic acid groups are the most commonly used anchor group for dye-sensitized solar cells.36 Finally, F5 was modelled to examine the effect of having the push–pull functionality on the meso- vs. β-position. A similar study has been reported previously when four CF3 groups were substituted on the meso- versus β-positions.37,38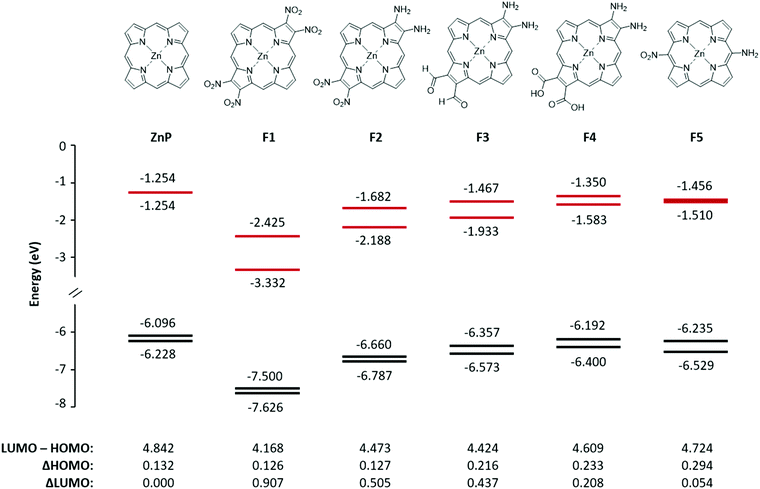 | ||
| Fig. 7 The structure, energy level diagram, and values of two HOMOs and two LUMOs in eV for the fictive molecules F1–F5. The frontier MO energies of ZnP are shown for comparison. | ||
Fig. 7 shows the energies of the four MOs for the five fictive compounds. The MO energies of zinc porphyrin (ZnP) are also shown for comparison. Being a symmetric molecule with a D4h symmetry, ZnP exhibits a degenerate pair of LUMOs and a nearly degenerate pair of HOMOs. When the electron withdrawing groups are present on opposite pyrroles (F1), the LUMO pair is seen to split significantly while the HOMO pair remains nearly degenerate. Replacing the pull–pull functionality in F1 with the push–pull functionality in F2, the value of the ΔHOMO remained relatively the same but the magnitude of the ΔLUMO became smaller (0.907 eV versus 0.505 eV). When NO2 was exchanged for CHO and COOH as weaker electron withdrawing groups, the ΔLUMO was seen to decrease while the ΔHOMO increased. Interestingly, even though COOH (F4) is considered to be more electron withdrawing than CHO (F3), it had a smaller effect on the splitting of the LUMO and LUMO+1 (0.208 eV versus 0.437 eV). This may be because the optimized structure of F4 had the COOH groups slightly tilted from the plane of the ring whereas the CHO groups in F3 were planar. The slight tilt probably lowered the extent of π conjugation onto the COOH groups, resulting in a smaller ΔHOMO and ΔLUMO. Compounds F1–F3 exhibit a relatively rare relationship of the ΔLUMO > ΔHOMO. The synthesis of compounds with the ΔLUMO > ΔHOMO will exhibit a reversed sign pattern in their MCD spectra, as observed for compound 2. Placing the push–pull functionality on the meso-position (F5) brought the LUMO pair back to near degeneracy. This means that the pyrrole β-position, which is along the x and y polarization axis, is a better substitution location for breaking the degeneracy of the LUMO pair. Compound F1, with the largest ΔLUMO, also has the smallest HOMO–LUMO gap which is expected since the stabilization of the LUMO brought it closer to the HOMO, and therefore, its Q band will be the most red-shifted compared to the other fictive molecules.
Electron density surfaces of fictive compounds
The electron density distribution of the fictive compounds for the four MOs is shown in Fig. 8. For all the compounds, the electron density is observed on the donating groups in the HOMO and on the withdrawing groups in the LUMO. The electron density differences between the excited and ground states are shown in the last row of Fig. 8. It is easy to see from these images that following photoexcitation, the electron density is moving from the donor group (cyan) to the acceptor group (purple). This is a required property for a photosensitizer in dye-sensitized solar cells.Discussion
In the quest for an intense red-shifted absorption band to allow for efficient energy conversion26 and singlet oxygen production, a large number of synthetic tetrapyrroles have been reported.1 Synthetic approaches have included extensive conjugation, symmetry reduction, and push–pull substituents to lower its energy and intensify the Q band. In each of these strategies, the intention is to change the Q band. Extensive conjugation reduces the HOMO–LUMO gap (e.g. naphthophthalocyanine) and red shifts the Q band.25 Symmetry reduction splits the HOMO and HOMO−1 which increases the oscillator strength.25 Push–pull substituents facilitate the electron transfer to the semiconductor in solar cells. Combining the red shift and intensification of the Q band, panchromatic absorption, and charge transfer to the semiconductor, are the four factors necessary for an efficient photosensitizer.11 The β-substitution in push–pull porphyrins is an attractive synthetic approach to destabilize the specific orbitals to achieve the desired red-shifted Q band and introduce a strong dipole moment.7,26,37–39 By studying a series of Zn porphyrins, 1–4, synthesized with combinations of simple electron withdrawing and electron donating groups on the β-position, we used MCD spectroscopy to probe the differences in their electronic structure. The computational aspects are vital for the design of effective photosensitizers because electron charge transfer is a necessary property and arises from an unequal electron distribution on MOs as a result of differential substitution. Molecular designs for effective charge transfer requires electron distribution information. To anchor the computational results, we analyzed the experimental results to ensure that we had reliability. We designed fictive molecules that exploited the split between the LUMO and LUMO+1 (ΔLUMO), which like chlorophyll, would reduce the HOMO–LUMO gap, thereby red-shifting the Q band.26Assessment of the computational results
Computational data can provide an understanding of the underlying electronic structure that results in the observed optical and redox properties. The difficulty in assessing the quality of computational results, particularly for use in a predictive role for the five fictive compounds described above, lies in overcoming and identifying the inaccuracies in the predicted properties.The energies of the two UV-visible region π–π* porphyrin bands (the Q and B bands) and their respective oscillator strengths are readily measured and can also be easily calculated using TD-DFT methods. However, the accuracy of the predicted spectral bands for tetrapyrroles is not good, with the Q band energy (S0 → S1) often overestimated, placing the absorption band of 40–100 nm to the blue of the observed Q band. In the presence of additional states, such as vibronic or charge transfer, this makes assigning the predicted band to a specific observed band often ambiguous. MCD spectra greatly assist the assignment accuracy by allowing the observed band to be characterized as having π–π* origins from the band morphologies (the A, B, or C terms). In 2005, we addressed the problem of inaccuracies in the computational band energies for the Q and B bands by assembling optical and computational data from 18 porphyrins and phthalocyanines25 using the MCD spectral properties to confidently identify the Q and B bands. We then reported the trends in the observed spectroscopic values as a function of calculated parameters. These trends provided a firm and wide-ranging foundation for understanding the connection between the electronic structure of these tetrapyrroles and their experimentally determined properties. We can use these trends to assess the reliability of the computational results for novel and fictive porphyrins. However, the computational methods used in 2005 are not the same as today. For the figures described next we have recalculated the computational data using the same functional and basis sets used for the four novel and five fictive porphyrins that are part of this present study (Walters and Stillman unpublished).
The goal of red-shifted Q bands: observed Q band energies trend linearly with the HOMO–LUMO gap
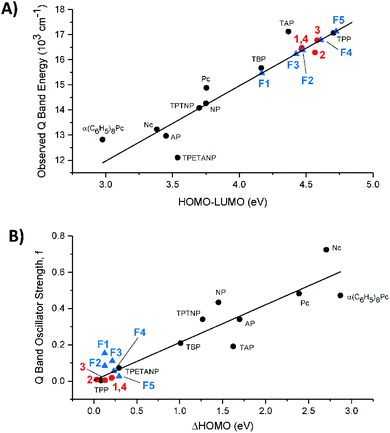
In Fig. 9A we compare the experimental Q band energy data for compounds 1–4 and the estimated Q band energy data for F1–F5 to the 10 legacy compounds as a function of their respective HOMO–LUMO energy gaps in eV. The use of the observed Q band as a function of the HOMO–LUMO energy gap removes the underlying errors in the calculation that may arise and introduce bias into the calculated data. The porphyrins and phthalocyanines used for the trend are complexes with purely extended π conjugation. The observed Q bands of 1–4 lie quite well on the trend line as shown in Fig. 9A, suggesting that the calculated HOMO–LUMO gap matches with the experimental Q band energy no matter what the substitution. However, for application purposes, compounds 1–4 are not likely to achieve a high power conversion efficiency in solar cells because they have a large HOMO–LUMO gap that corresponds to a high energy Q band.We included the five fictive molecules (F1–F5) using just the calculated HOMO–LUMO gap energies and placing the estimated Q band energy on the trend line. The slightly lower energy of F3versusF2 suggests that formyl substitution might red-shift the Q bands more than the NO2 substitution with the push of NH2. Molecule F1, where both sides are electron withdrawing, exhibited the largest ΔLUMO and the smallest HOMO–LUMO gap which would result in the most red-shifted Q band. Having withdrawing groups on opposite sides also creates strong equal and opposite dipoles and this additional dipole moment can possibly enhance the electron displacement onto the semiconductor.
The goal of strongly absorbing Q bands: calculated oscillator strengths trend linearly with the ΔHOMO
Fig. 9B assembles the trend between the calculated oscillator strengths (f) and ΔHOMO, of the 10 legacy molecules, 1–4, and F1–F5. A non-zero value for the ΔHOMO implies a splitting of the nominally degenerate pair of MOs from the C16H162− parent polyene. Again, the updated calculation of the 10 legacy molecules provides the same linearity in the trend: the increasing ΔHOMO dramatically increases the Q band absorbance.25 While determining the experimental values for f is not difficult for strongly absorbing tetrapyrroles, it is difficult to obtain reliable data for the weakly absorbing tetraphenyl compounds represented by 1–4 and F1–F5 because the absorbance is so low. Thus, we have used the calculated values for all the compounds in Fig. 9B. It is clear, however, from the optical data of 1–4, that the absorbance of the Q bands is very low, so the calculated values in 9B are likely to be very good estimations of the experimental data. The key conclusion from 9B is that the peripheral substitution of 1–4 does not significantly split the accidental degeneracy of the two top-filled MOs, and that the Q band absorbance will then be very weak. The meso tetraphenyl substitutions offset the presence of the pyrrole nitrogens so that for ZnTPP, the ΔHOMO approaches the zero of the parent polyene. Concomitantly, the Q band absorbance (f) drops to close to zero with the Q band located primarily from the MCD spectrum.How do the calculations compare with the experimental data of the β-substituted porphyrins?
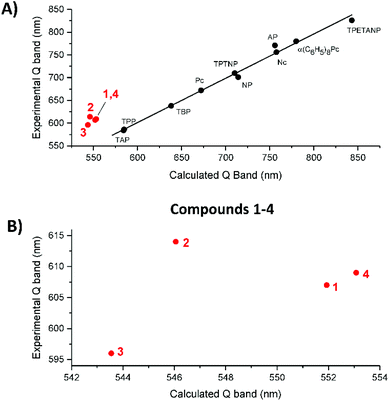
Fig. 10A shows the trend in the observed vs. calculated Q band energies for the 10 legacy molecules and compounds 1–4. The linearity in the legacy data is convincing, while the TD-DFT calculations over emphasize the S1 energy, resulting in blue shifted Q band predictions, the error is systematic so the trend line is linear. On the other hand, the data for 1–4 consistently lie off the trend line. This might suggest that TD-DFT calculates the effect of having electron withdrawing and electron donating groups around the porphyrin ring in a manner that is different from a purely conjugated system. Fig. 10B shows expanded views of the correlation between the observed and calculated Q band energies of 1–4, now identifying that 2 lies well off the possible linear trend of 1,3 and 4. In the absence of other experimental data, we cannot at this point generalize but we believe that the NO2 moiety's interaction with the π system, which resulted in the change in the π electronic structure, is responsible for the inaccurate calculation. Our conclusion is further supported by the effect the NO2 substitution has on the two lowest unoccupied π* orbitals, nominally, the degenerate pair of eg LUMOs.Splitting the two lowest unoccupied MOs: ΔLUMO
The calculations reported in Fig. 5 for 1–4 and Fig. 7 for F1–F5 show that each of the porphyrins with the electron withdrawing groups on the β-positions have a ΔLUMO > 0. Typically for tetrapyrroles, the ΔLUMO is essentially zero, for example, ZnP in Fig. 7 and all the legacy compounds in ref. 25. It is not surprising that the pair of HOMO orbitals might differ in energy in view of the low symmetry of the molecules with substitutions in electron density sensitive locations. However, it is unusual for the degenerate pair of LUMOs to split in energy. Here the influence of the electron withdrawing nature of the NO2 group in the β-position, which lies along the x and y polarization axis of the porphyrin, clearly causes substantial interference with the π* orbitals. Uniquely, of the four push–pull porphyrins, only 2 exhibits a red shifted Q band, an inverted, negatively signed A term, and unusual emission properties (Fig. 4). The calculations, Fig. 5, show that only for 2, the ΔLUMO is greater than the ΔHOMO. This inversion of the splitting, and indeed, the unusual presence of the split LUMO pair of orbitals, may be the cause of the systematic errors of the TD-DFT calculations. It is possible that TD-DFT does not cope well with an electronic structure where the LUMO pair is split greater than the HOMO pair. For all compounds except for 2, the order of the Q band wavelength obtained by TD-DFT matches well with the order observed in the experimental data. The calculated Q band wavelength for 2 was significantly more blue-shifted than that of the other three compounds whereas the observed Q band for 2 was the most red-shifted compared to those of 1, 3, and 4.Negative A term from MCD spectroscopy: proof of a split LUMO
Fig. 11 shows the A/D values for 1–4 and ZnTPP as a function of the difference in the ΔHOMO and ΔLUMO energies from the DFT calculations. A/D represents the difference in angular momentum between the ground and excited states. The A and D magnitudes were estimated from the MCD peak to the trough and the absorbance maximum for the same solution. This is not nearly as precise as using the method of moments40 but is close to the values from band shape fitting when the spectra are well resolved from other bands. For 1, 3, 4, and ZnTPP, the ΔLUMO is less than the ΔHOMO which is typically observed for metalloporphyrins. The trend shows how as the ΔHOMO–ΔLUMO approaches zero, the MCD +A/D magnitude diminishes for 3 then inverts for 2. The trend is convincing. The A/D value of −1.15 Bohr magneton for 2 is not hard to understand as the LUMO angular momentum is nominally ±5 vs. ±4 for the HOMO pair, so for the MCD A/D to invert, the LUMO angular momentum must be quenched to a much greater extent. Because there are, to our knowledge, no similar series that can be used for comparison, this figure represents the first experimental data that include MCD data from a series of like-compounds stretching from +A/D to −A/D.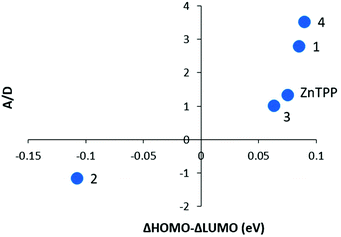 | ||
| Fig. 11 Experimental A/D values as a function of ΔHOMO–ΔLUMO. “A” was measured from the peak to the trough of the MCD Q00 band and is in units of ΔAL–R/T and “D” was measured from the Q00 absorption band maximum for the same solution used in the MCD spectrum. The ΔHOMO and ΔLUMO values are shown in Table 1. Subtraction between these two represents the difference in splitting of the two orbital pairs. | ||
Analysis of β-substitution using electron density surfaces of occupied MOs
One of the most important datasets obtained from the DFT calculations is the mapping of the electron density for each MO. For tetrapyrroles, the nodal patterns provide a direct indicator of the aromatic π system. We compare the electron density surfaces here for the occupied MOs and below for the unoccupied π* MOs. The surfaces indicate the influence of the peripheral decoration on the stability of the π system. Because the aromatic system is dominated by the angular momentum, especially for the HOMOs, the surfaces show where low symmetry effects of the substituents will result in electronic disturbances that will likely change the ground state angular momenta. Starting with 1–4, we readily see from the energies that except for 2, the nominally degenerate eu pair of MOs are split significantly and the single highest occupied MO is the a1u orbital. The a1u orbitals are not particularly sensitive, therefore, to the tetratolyl substituents or to the metal (Fig. 1). However, the a1u orbitals are sensitive to the substituents on the β-positions of the pyrroles. In addition, the density of the fused benzo group is included as in a benzoporphyrin, but the two methoxy substituents only contribute a small amount of density. This may be because there is not much delocalization onto those substituents. The electron withdrawing groups on the opposite pyrroles in 1, 2 and 4 are also included in the a1u density, introducing a significant axis of density stretching from the benzo group to the acetamido, nitro, and benzoylamino groups. The HOMO−1 in 1–4 is the a2u partner of the eu pair, now stabilized by the electron withdrawing properties of the β groups and the tolyl substituents on the methine bridge, as these are all now part of the electron density with the four nodes passing through the bonds, Fig. 1. The effect of the electron withdrawing groups, however, reduces the density on the ring, which means that for 2, the a1u and a2u orbitals become essentially degenerate. The ramification of these effects for these two Gouterman orbitals is that the Q band absorbance (and the calculated oscillator strength) of 1, 3, and 4 is greater than that of 2, as shown in Fig. 4. The nitro group only appears with a significant density of seven MOs below the HOMO. However, as we see below, the nitro group fully contributes to the LUMO (MO 246 in Fig. 5).A similar analysis of the HOMO and HOMO−1 surfaces of the five fictive compounds, F1–F5, reveals that the strength of the withdrawing group has a major effect on the energies of a1u and a2u. Because the nodes for a1u lie on the pyrrole nitrogen and methine bridges, its energy is heavily dependent on the substituent on the β-position. For F1 and F2, the presence of a strongly withdrawing NO2 group pulls the electron density from the ring and lowers the energy of a1u below that of a2u. The weaker withdrawing groups of formyl (F3) and carboxylic acid (F4) still pull the electron density from the ring, but not enough to lower the energy of a1u below a2u.
Analysis of β-substitution using electron density surfaces of unoccupied MOs
The electron densities of the LUMOs for 1, 3, and 4 are very similar, clearly showing the 5 nodes associated with the Gouterman LUMO pair. The dimethoxybenzo group is associated with LUMO+1. For 2, the NO2 and dimethoxybenzo groups form a single MO for the LUMO, which accounts for the complexity of the Q band state shown in Fig. 6. Like the LUMO electron density surface of 2, Fig. 5, the LUMO surfaces for the five fictive molecules all show a strong electron density on the electron withdrawing groups. The effect is that the HOMO/HOMO−1 to LUMO transitions of F1–F5 and 2 will involve a greater extent of charge transfer onto the electron withdrawing groups than in 1, 3 and 4, as shown in the density difference surfaces (Fig. 8).Conclusion
Spectral data allow the assessment of the computational analysis in showing that the presence of NO2 in the β-substitution position splits the LUMO pair, thereby reducing the HOMO–LUMO gap and introducing the dipole moment, all properties needed for a photosensitizer. The trends in the HOMO–LUMO gap and the ΔHOMO confirm the reliability of the computational results. The inverted A term in the MCD spectrum of the nitro-benzo porphyrin (2) is correlated with the ΔLUMO being greater than the ΔHOMO which is interpreted to mean that the angular momentum of the first excited state is less than that of the ground state; an unusual situation for a porphyrin. The experimental data for 1–4 anchor the interpretive results from the computational analysis. Based on the confidence in the analysis of 1–4, we designed five fictive molecules to test the effect of strongly electron withdrawing and electron donating groups opposite to each other. The computational studies showed in detail the predicted properties and the fact that the presence of the NO2 group strongly influenced the degeneracy of the LUMO and LUMO+1. An effective charge transfer is needed in photosensitizers to transfer the ground state electron to the semiconductor.Conflicts of interest
There are no conflicts to declare.Acknowledgements
We would like to thank the Natural Sciences and Engineering Research Council (NSERC) of Canada for a Discovery Grant to M. J. S. and the Ontario Government for the Ontario Graduate Scholarship to A. Z. We thank Mr Kyle Jeffs for preliminary studies. We acknowledge the essential assistance of Mr John Vanstone and the Electronics and IT Team in maintaining and upgrading our instruments and computational resources. We thank Fujitsu Poland for access to the latest Scigress Program. We also thank Dr Viktor N. Staroverov for helpful discussions and Mr Evan Walters for the archival porphyrin data in Fig. 9.References
- Handbook of Porphyrin Science, ed. K. M. Kadish, K. M. Smith and R. Guilard, World Scientific Publishing, Singapore, 2011 Search PubMed.
- L. R. Milgrom, The Colours of Life: An Introduction to the Chemistry of Porphyrins and Related Compounds, Oxford University Press, New York, 1997 Search PubMed.
- R. Croce and H. van Amerongen, Nat. Chem. Biol., 2014, 10, 492–501 CrossRef CAS PubMed.
- M. J. Stillman, in Handbook of Porphyrin Science, World Scientific Publishing, Singapore, 2011, vol. 14, ch. 65, pp. 461–524 Search PubMed.
- M. Gouterman, J. Mol. Spectrosc., 1961, 6, 138–163 CrossRef CAS.
- M. Gouterman, in The Porphyrins, ed. D. Dolphin, Academic Press, New York, 1978, vol. 3, ch. 1, pp. 1–165 Search PubMed.
- R. A. Binstead, M. J. Crossley and N. S. Hush, Inorg. Chem., 1991, 30, 1259–1264 CrossRef CAS.
- H. Tamiaki and M. Kunieda, in Handbook of Porphyrin Science, ed. K. M. Kadish, K. M. Smith and R. Guilard, World Scientific Publishing, Singapore, 2011, vol. 11, pp. 223–290 Search PubMed.
- E. Antonini and M. Brunori, Hemoglobin and Myoglobin in their Reactions with Ligands, North-Holland Publishing Company, Netherlands, 1971 Search PubMed.
- Y. Sun, W. Zeng, A. Benabbas, X. Ye, I. Denisov, S. G. Sligar, J. Du, J. H. Dawson and P. M. Champion, Biochemistry, 2013, 52, 5941–5951 CrossRef CAS PubMed.
- T. Higashino and H. Imahori, Dalton Trans., 2015, 44, 448–463 RSC.
- H. Imahori, K. Kurotobi and M. G. Walter, in Handbook of Porphyrin Science, ed. K. M. Kadish, K. M. Smith and R. Guilard, World Scientific Publishing, Singapore, 2012, vol. 18, ch. 80, pp. 57–121 Search PubMed.
- M. Ethirajan, Y. Chen, P. Joshi and R. K. Pandey, Chem. Soc. Rev., 2011, 40, 340–362 RSC.
- M. Gouterman, J. Chem. Phys., 1959, 30, 1139–1161 CrossRef CAS.
- S. Mathew, A. Yella, P. Gao, R. Humphry-Baker, B. F. Curchod, N. Ashari-Astani, I. Tavernelli, U. Rothlisberger, M. K. Nazeeruddin and M. Gratzel, Nat. Chem., 2014, 6, 242–247 CrossRef CAS PubMed.
- S. Yamamoto, A. Zhang, M. J. Stillman, N. Kobayashi and M. Kimura, Chem. – Eur. J., 2016, 22, 18760–18768 CrossRef CAS PubMed.
- M. Kimura, H. Suzuki, Y. Tohata, T. Ikeuchi, S. Yamamoto and N. Kobayashi, Asian J. Org. Chem., 2017, 6, 544–550 CrossRef CAS.
- J. L. Sessler and E. Tomat, Acc. Chem. Res., 2007, 40, 371–379 CrossRef CAS PubMed.
- J. Weiss and J. Wytko, in N4-Macrocyclic Metal Complexes, ed. J. H. Zagal, F. Bedioui and J.-P. Dodelet, Springer New York, New York, NY, 2006, pp. 603–724, DOI:10.1007/978-0-387-28430-9_13.
- N. Kobayashi, W. A. Nevin, S. Mizunuma, H. Awaji and M. Yamaguchi, Chem. Phys. Lett., 1993, 205, 51–54 CrossRef CAS.
- A. Tsuda and A. Osuka, Science, 2001, 293, 79–82 CrossRef CAS PubMed.
- D. Kim and A. Osuka, J. Phys. Chem. A, 2003, 107, 8791–8816 CrossRef CAS.
- T. D. Lash, Syntheses of Novel Porphyrinoid Chromophores, Academic Press, San Diego, 2000 Search PubMed.
- A. V. Cheprakov, in Handbook of Porphyrin Science, ed. K. M. Kadish, K. M. Smith and R. Guilard, World Scientific Publishing, Singapore, 2011, vol. 13, ch. 58, pp. 1–149 Search PubMed.
- J. Mack, Y. Asano, N. Kobayashi and M. J. Stillman, J. Am. Chem. Soc., 2005, 127, 17697–17711 CrossRef CAS PubMed.
- J. M. Yuen, M. A. Harris, M. Liu, J. R. Diers, C. Kirmaier, D. F. Bocian, J. S. Lindsey and D. Holten, J. Photochem. Photobiol., 2015, 91, 331–342 CrossRef CAS PubMed.
- P. D. Harvey, C. Stern and R. Guilard, in Handbook of Porphyrin Science, ed. K. M. Kadish, K. M. Smith and R. Guilard, World Scientific Publishing, Singapore, 2011, vol. 11, ch. 49, pp. 1–179 Search PubMed.
- M. O. Senge and S. A. MacGowan, in Handbook of Porphyrin Science, ed. K. M. Kadish, K. M. Smith and R. Guilard, World Scientific Publishing, Singapore, 2011, vol. 13, ch. 61, pp. 253–297 Search PubMed.
- C. Weiss, Ann. N. Y. Acad. Sci., 1975, 244, 204–213 CrossRef CAS PubMed.
- R. G. W. Jinadasa, Y. Fang, Y. Deng, R. Deshpande, X. Jiang, K. M. Kadish and H. Wang, RSC Adv., 2015, 5, 51489–51492 RSC.
- S. B. Piepho and P. N. Schatz, Group Theory in Spectroscopy with Applications to Magnetic Circular Dichroism, Wiley, New York, 1983 Search PubMed.
- N. Kobayashi, A. Muranaka and J. Mack, Circular Dichroism and Magnetic Circular Dichroism Spectroscopy for Organic Chemists, Royal Society of Chemistry, Cambridge, 2012 Search PubMed.
- J. Michl, J. Am. Chem. Soc., 1978, 100, 6812–6818 CrossRef CAS.
- Scigress Molecular modeling software. FQS Poland, 2016. Retreived from http://www.fqs.pl/chemistry_materials_life_science/products/scigress.
- M. J. Frisch, G. W. Trucks, H. B. Schlegel, G. E. Scuseria, M. A. Robb, J. R. Cheeseman, G. Scalmani, V. Barone, B. Mennucci, G. A. Petersson, H. Nakatsuji, M. Caricato, X. Li, H. P. Hratchian, A. F. Izmaylov, J. Bloino, G. Zheng, J. L. Sonnenberg, M. Hada, M. Ehara, K. Toyota, R. Fukuda, J. Hasegawa, M. Ishida, T. Nakajima, Y. Honda, O. Kitao, H. Nakai, T. Vreven, J. A. Montgomery Jr., J. E. Peralta, F. Ogliaro, M. Bearpark, J. J. Heyd, E. Brothers, K. N. Kudin, V. N. Staroverov, T. Keith, R. Kobayashi, J. Normand, K. Raghavachari, A. Rendell, J. C. Burant, S. S. Iyengar, J. Tomasi, M. Cossi, N. Rega, J. M. Millam, M. Klene, J. E. Knox, J. B. Cross, V. Bakken, C. Adamo, J. Jaramillo, R. Gomperts, R. E. Stratmann, O. Yazyev, A. J. Austin, R. Cammi, C. Pomelli, J. W. Ochterski, R. L. Martin, K. Morokuma, V. G. Zakrzewski, G. A. Voth, P. Salvador, J. J. Dannenberg, S. Dapprich, A. D. Daniels, O. Farkas, J. B. Foresman, J. V. Ortiz, J. Cioslowski and D. J. Fox, Gaussian 09, Revision E.01, Gaussian, Inc., Wallingford CT, 2013 Search PubMed.
- M. Grätzel, J. Photochem. Photobiol., C, 2003, 4, 145–153 CrossRef.
- Y. Terazono, B. O. Patrick and D. H. Dolphin, Inorg. Chem., 2002, 41, 6703–6710 CrossRef CAS PubMed.
- Y. Terazono and D. Dolphin, J. Org. Chem., 2003, 68, 1892–1900 CrossRef CAS PubMed.
- P. Yadav, R. Kumar, A. Saxena, R. J. Butcher and M. Sankar, Eur. J. Inorg. Chem., 2017, 2017, 3269–3274 CrossRef CAS.
- E. Ough, T. Nyokong, K. A. M. Creber and M. J. Stillman, Inorg. Chem., 1988, 27, 2724–2732 CrossRef CAS.
| This journal is © The Royal Society of Chemistry 2017 |

