 Open Access Article
Creative Commons Attribution 3.0 Unported Licence
Prolonged bioluminescence imaging in living cells and mice using novel pro-substrates for Renilla luciferase†
Mingliang
Yuan‡
a,
Xiaojie
Ma‡
b,
Tianyu
Jiang
a,
Yuqi
Gao
a,
Yuanyuan
Cui
a,
Chaochao
Zhang
a,
Xingye
Yang
a,
Yun
Huang
c,
Lupei
Du
a,
Ilia
Yampolsky
de and
Minyong
Li
 *af
*af
aDepartment of Medicinal Chemistry, Key Laboratory of Chemical Biology (MOE), School of Pharmacy, Shandong University, Jinan, Shandong 250012, China. E-mail: mli@sdu.edu.cn; Fax: +86-531-8838-2076; Tel: +86-531-8838-2076
bDepartment of Otorhinolaryngology, Qilu Hospital of Shandong University, Jinan, Shandong 250012, China
cCentre for Epigenetics and Disease Prevention, Institute of Biosciences and Technology, Department of Molecular and Cellular Medicine, College of Medicine, Texas A&M University, Houston, TX 77030, USA
dShemyakin-Ovchinnikov Institute of Bioorganic Chemistry of the Russian Academy of Sciences, Miklukho-Maklaya, 16/10, Moscow 117997, Russia
ePirogov Russian National Research Medical University, Ostrovitianov 1, Moscow 117997, Russia
fState Key Laboratory of Microbial Technology, Shandong University, Jinan, Shandong 250100, China
First published on 16th November 2017
Abstract
The prodrug or caged-luciferin strategy affords an excellent platform for persistent bioluminescence imaging. In the current work, we designed and synthesized ten novel pro-substrates for Renilla luciferase by introducing ester protecting groups of different sizes into the carbonyl group of the free luciferin 1. Taking advantage of intracellular esterases, lipases, and nucleophilic substances, the ester protecting groups were hydrolyzed, resulting in the release of a free luciferin and a bioluminescence signal turn-on. Among the tested pro-substrates, the butyryloxymethyl luciferin 7 exhibited low cytotoxicity and a prolonged luminescence signal both in cellulo and in vivo. Therefore, the butyryloxymethyl luciferin 7 can act as a promising substrate for noninvasive extended imaging in diagnostic and therapeutic fields.
Introduction
Noninvasive bioluminescence imaging (BLI) for real-time monitoring of biological events in living cells and animals has been widely adopted in both basic research and translation applications, including gene therapy, stem cell tracking, tumor growth assessment, drug development, and probing protein–protein interactions.1–7 BLI employs luciferases such as Renilla luciferase as reporters to generate visible light during the catalytic oxidation of the corresponding luciferins. Compared with fluorescence imaging (FLI), BLI is endowed with many intrinsic advantages including no requirement for excitation light, negligible background signal, high sensitivity, broad dynamic ranges, superior biocompatibility and versatility in the choices of luciferases and cognate luciferins.8–13 Therefore, BLI has become an important imaging method for biomedical research.The two most commonly utilized BLI reporters are Firefly luciferase (Fluc, 61 kDa) and Renilla luciferase (Rluc, 36 kDa).14 Fluc can catalyze the oxidation of its natural substrate D-luciferin to produce yellow-green light (540–615 nm) in the presence of O2, adenosine triphosphate (ATP), and Mg2+. The Fluc/D-luciferin pair has gained wide popularity in cellular and animal imaging given the strong emission signals and biocompatibility.15 However, the consumption of ATP during the bioluminescence reaction might perturb the metabolic state of cells, thus increasing the experimental complexity. On the other hand, Rluc and coelenterazine (CTZ), only requiring molecular oxygen, constitute an alternative BLI system.16–19 The Rluc/CTZ pair emits blue-green light with a spectral peak of 475 nm. Moreover, Rluc has been successfully expressed in mammalian cells with good biocompatibility.20 Aside from being a useful reporter in cellular assays, Rluc/CTZ has the potential for in vivo imaging because of its versatility as well as the lack of ATP requirements.21 Rluc has also been utilized as an energy donor to be paired with the green fluorescent protein (GFP) or its variants as an energy acceptor in bioluminescence resonance energy transfer (BRET) for investigating protein–protein interactions.22,23 The current BRET systems are mainly divided into BRET1, BRET2, and eBRET. BRET1 and BRET2, respectively, employ coelenterazine h and DeepBlueC™ as the Rluc substrate. eBRET utilizes a protected form of coelenterazine h, called EnduRen™, which can be used to monitor protein–protein interactions in real time for up to 6 h.24 In addition, the Rluc/CTZ system has been applied in the real-time monitoring of reactive oxygen species, gene expression, and neural stem cell transplantations.25–28
However, the wide application of the Rluc/CTZ pair is hindered owing to the following factors: Firstly, the chemical stability of CTZ is suboptimal in aqueous solution, with the half-life at 37 °C estimated to be approximately 15 min;29,30 Secondly, CTZ is also unstable in serum and plasma, resulting in a non-ignorable background signal (autoluminescence);31 Last but critical, the fast catalytic oxidation of CTZ generates bioluminescence signals that decay rapidly, not conducive to prolonged real-time imaging in vitro and in vivo.32 It has been well established that CTZ can be stabilized by introducing protecting groups at the reaction site, the 3-carbonyl position of the imidazopyrazinone moiety, thus temporarily prohibiting its recognition with Rluc. When triggered by specific enzymes or small molecules, the caged luciferins can be converted into free luciferins and then combined with Rluc so as to generate a luminescent signal, thereby leading to a longer half-life and a lower autoluminescence.15,18 Along this line, some Rluc substrates or probes have been well developed. Jelena Levi et al. synthesized four DeepBlueC™ derivatives that displayed the potential for improving the BRET2 assays with good light signal sustainability.33 ViviRen™ and EnduRen™, produced by Promega Corporation and containing small protecting groups that can be cleaved by intracellular esterases and lipases, presented longer kinetics and diminished autoluminescence.34 Eric Lindberg et al. designed and synthesized two β-galactosidase recognition probes with β-galactose caging groups, displaying improved kinetic profiles and high signal-to-noise ratios when assayed in cellulo.35 Recently, a caged furimazine was developed as the pro-substrate for an engineered luciferase NanoLuc to enable live tissue imaging.36 Altogether, the caged-luciferin strategy affords an excellent platform for persistent bioluminescence imaging.37–41
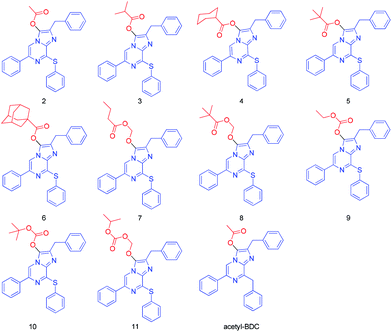
In previous work, we described a sulfur-containing CTZ analogue 1 with an improved light signal compared to DeepBlueC™.42–44 The synthesis of the analogues with a sulfur heteroatom was performed from 2-aminopyrazine based on the Suzuki coupling reaction. Key pyrazine intermediates were obtained by reaction of bromo derivatives with the thiol in dry DMF with sodium hydride as the base. The final step of the convergent synthesis of the coelenterazine analogues was achieved by condensation of intermediates, with a diethoxy derivative in ethanol with concentrated HCl. The sulfur heteroatom replacement of the methylene bridge in DeepBlueC™ leads to a bathochromic shift in the bioluminescence reaction with Rluc. The bioluminescence spectra exhibited a significant red-shift (36 nm) for free luciferin 1 compared to DeepBlueC™. As the closer to red the better, the shift toward red is of great interest in vivo. Based on this, we designed and synthesized ten novel pro-substrates for Renilla luciferase by introducing ester protecting groups of different sizes into the carbonyl group of the free luciferin 1 (Fig. 1). Compounds 2–8 have a carboxylic ester group and the others are luciferin carbonic esters. Upon cell uptake, these prodrug-inspired luciferin derivatives, termed luciferin esters, could be hydrolyzed by intracellular esterases, lipases, and nucleophilic substances to slowly release the free luciferin 1. Subsequently, a catalytic luciferin–luciferase reaction was activated, thereby resulting in the production of light with a longer half-life and lower background noise (Scheme 1). To demonstrate this hypothesis, we firstly investigated the stability of the luciferin esters in aqueous solution and then performed imaging studies by using a cooled charge coupled-device (CCD) detector in living cells and mice. Of the ten luciferin esters, three compounds can produce detectable signals even after 24 h exposure to the cells. Indeed, the butyryloxymethyl luciferin 7 was of low cytotoxicity and displayed sustained luminescence signals that last >24 h in cellulo and in vivo. Therefore, the butyryloxymethyl luciferin 7 can serve as a promising long-term bioluminescence imaging probe.
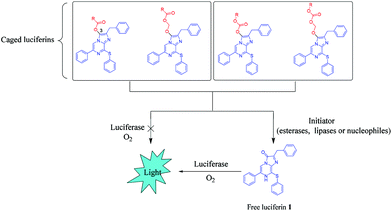 | ||
| Scheme 1 Design strategy for prolonged bioluminescent pro-substrates that are compatible with Renilla luciferase. | ||
Results and discussion
Stability assay
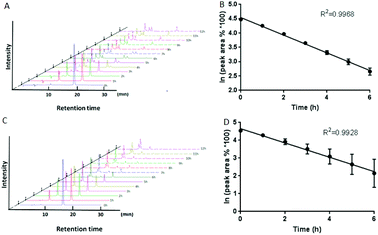
We investigated the stability of the luciferin derivatives in aqueous solution by HPLC and UV analysis. As shown in Fig. 2B and C, the peak at 19.28 min assigned to the luciferin acetyl ester 2 decreased significantly. A new peak belonging to the free luciferin 1 at 10.66 min appeared remarkably. It indicated that the luciferin acetyl ester 2 was extremely unstable, and was easily hydrolyzed to release the free luciferin 1. Then the obtained data were analyzed by using GraphPad Prism 5.0 software. As the first order reaction is characterized by a ln![[thin space (1/6-em)]](https://www.rsc.org/images/entities/char_2009.gif) c–t plot, the half-life is independent of the initial concentration and inversely proportional to the rate constant. The half-life for the luciferin acetyl ester 2 was determined as 2.25 h under the first-order conditions and the apparent rate constant k = (0.3084 ± 0.007868) h−1. When subjected to UV analysis, the calculated half-life of the luciferin acetyl ester 2 was 2.80 h (270 nm) and 2.59 h (358 nm), which was almost consistent with that obtained by HPLC (Fig. S1†). In addition, the hydrolysis process of the luciferin isobutyryl ester 3 (Fig. S2A and B†) also belonged to the first-order reaction: k = (0.0564 ± 0.0008645) h−1, t1/2 = ln
c–t plot, the half-life is independent of the initial concentration and inversely proportional to the rate constant. The half-life for the luciferin acetyl ester 2 was determined as 2.25 h under the first-order conditions and the apparent rate constant k = (0.3084 ± 0.007868) h−1. When subjected to UV analysis, the calculated half-life of the luciferin acetyl ester 2 was 2.80 h (270 nm) and 2.59 h (358 nm), which was almost consistent with that obtained by HPLC (Fig. S1†). In addition, the hydrolysis process of the luciferin isobutyryl ester 3 (Fig. S2A and B†) also belonged to the first-order reaction: k = (0.0564 ± 0.0008645) h−1, t1/2 = ln![[thin space (1/6-em)]](https://www.rsc.org/images/entities/char_2009.gif) 2/k = 12.29 h (Fig. S2†). So did the carboxylic ester 4 (Fig. S2C and D†): k = (0.008899 ± 0.0006395) h−1, t1/2 = ln
2/k = 12.29 h (Fig. S2†). So did the carboxylic ester 4 (Fig. S2C and D†): k = (0.008899 ± 0.0006395) h−1, t1/2 = ln![[thin space (1/6-em)]](https://www.rsc.org/images/entities/char_2009.gif) 2/k = 77.89 h; compound 5 (Fig. S2E and F†): k = (0.004157 ± 0.001384) h−1, t1/2 = ln
2/k = 77.89 h; compound 5 (Fig. S2E and F†): k = (0.004157 ± 0.001384) h−1, t1/2 = ln![[thin space (1/6-em)]](https://www.rsc.org/images/entities/char_2009.gif) 2/k = 166.74 h; compound 6 (Fig. S2G and H†): k = (0.01079 ± 0.004182) h−1, t1/2 = ln
2/k = 166.74 h; compound 6 (Fig. S2G and H†): k = (0.01079 ± 0.004182) h−1, t1/2 = ln![[thin space (1/6-em)]](https://www.rsc.org/images/entities/char_2009.gif) 2/k = 64.24 h; carbonic ester 9 (Fig. S2N and M†): k = (0.04267 ± 0.001234) h−1, t1/2 = ln
2/k = 64.24 h; carbonic ester 9 (Fig. S2N and M†): k = (0.04267 ± 0.001234) h−1, t1/2 = ln![[thin space (1/6-em)]](https://www.rsc.org/images/entities/char_2009.gif) 2/k = 16.24 h; carbonic ester 10 (Fig. 2C and D): k = (0.4025 ± 0.01534) h−1, t1/2 = ln
2/k = 16.24 h; carbonic ester 10 (Fig. 2C and D): k = (0.4025 ± 0.01534) h−1, t1/2 = ln![[thin space (1/6-em)]](https://www.rsc.org/images/entities/char_2009.gif) 2/k = 1.72 h; carbonic ester 11 (Fig. S2O and P†): k = (0.005784 ± 0.0007733) h−1, t1/2 = ln
2/k = 1.72 h; carbonic ester 11 (Fig. S2O and P†): k = (0.005784 ± 0.0007733) h−1, t1/2 = ln![[thin space (1/6-em)]](https://www.rsc.org/images/entities/char_2009.gif) 2/k = 119.84 h; for carboxylic ester derivatives 4, 5, 6 with large steric hindrance and carbonic esters 9, 10, 11, we found that they were fairly stable and almost did not undergo hydrolysis. Therefore, we concluded that the hydrolysis process of the luciferin carboxylic esters was commensurate with the characteristics of the first-order reaction, and that the stability of the luciferin derivatives depends on the size of the protecting group. The butyryloxymethyl luciferin 7 (Fig. S2I and J†) was also commensurate with the characteristics of the first-order reaction, as k = (0.006972 ± 0.0006517) h−1, t1/2 = ln
2/k = 119.84 h; for carboxylic ester derivatives 4, 5, 6 with large steric hindrance and carbonic esters 9, 10, 11, we found that they were fairly stable and almost did not undergo hydrolysis. Therefore, we concluded that the hydrolysis process of the luciferin carboxylic esters was commensurate with the characteristics of the first-order reaction, and that the stability of the luciferin derivatives depends on the size of the protecting group. The butyryloxymethyl luciferin 7 (Fig. S2I and J†) was also commensurate with the characteristics of the first-order reaction, as k = (0.006972 ± 0.0006517) h−1, t1/2 = ln![[thin space (1/6-em)]](https://www.rsc.org/images/entities/char_2009.gif) 2/k = 99.42 h. t-Butyryloxymethyl luciferin 8 (Fig. S2K and L†) had almost no hydrolysis under the same conditions. Collectively, the size and the type of the protecting group and the solubility seem to govern the stability of the luciferin esters in aqueous solution.
2/k = 99.42 h. t-Butyryloxymethyl luciferin 8 (Fig. S2K and L†) had almost no hydrolysis under the same conditions. Collectively, the size and the type of the protecting group and the solubility seem to govern the stability of the luciferin esters in aqueous solution.
Ionic effect
Considering the effect of inorganic ions on the stability in aqueous solution, we treated the luciferin esters with various representative cations (NH4+, Mg2+, Ca2+, Fe2+, Fe3+, Cu2+, Al3+, Mn2+, Pb2+, Hg2+, Zn2+) and anions (CH3COO−, HCO3−, HSO3−, H2PO4−, S2−, N3−, SCN−, I−, BO3−, S2O32−). As shown in Fig. 3, we can see that the above ions induced little or negligible luminescence alterations. Besides some inorganic salts, there are many nucleophilic substances such as reactive sulfur species (glutathione, cysteine, homocysteine etc.) in the complex cellular environments. In general, these nucleophilic substances can accelerate the hydrolysis of the luciferin esters. Hence we did not perform further research. Overall, the results indicated that inorganic ions had little impact on the stability of the luciferin esters in aqueous solution, which is critical for their potential application in biomedical imaging.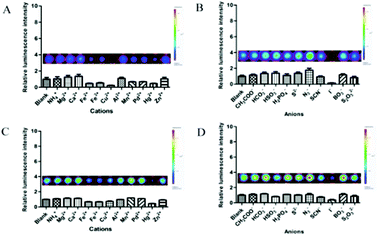 | ||
| Fig. 3 Effects of various inorganic ions on the stability of representative luciferin esters 2 (A and B) and 9 (C and D) in aqueous solution. | ||
Cytotoxicity test
The luciferin esters as imaging agents should have the characteristic of low cytotoxicity. Therefore, the cell viability was investigated by sulphorhodamine B (SRB) assays. After incubation with varying concentrations of luciferin esters for 24 h, no marked cytotoxicity was observed and the IC50 values of these luciferin esters were much greater than the concentration (40 μM) used in cell imaging, demonstrating good biocompatibility with live cells (Table S1†). Therefore, we plan to further investigate the feasibility of luciferin esters for imaging in living systems.Real-time imaging in live cells
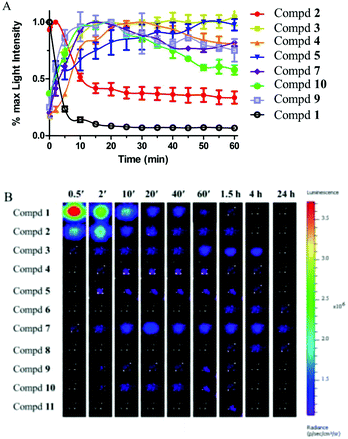
To explore whether the luciferin esters can serve as a long-term tracking tool, we firstly performed real-time imaging experiments at the cellular level. ES-2 cells stably expressing Renilla luciferase were treated with the luciferin esters and then the light signal was recorded every five minutes. From the kinetics of the bioluminescence (Fig. 4A), the unprotected luciferin 1 displayed rapid luminescent signal decay and lost approximately 80% of its initial light intensity at 10 min. The luciferin acetyl ester 2 easily hydrolyzed by cellular esterases exhibited a maximum light signal at 2 min and then descended rapidly. By contrast, other luciferin esters showed a longer time to peak and slower kinetics owing to the bulkier protecting groups. As for the signal half-life when the initial light intensity falls by half, every compound almost has a half-life period of more than 1 h except for the acetyl ester 2 (Fig. 4A and Fig. S3†). Moreover, of the ten luciferin esters, there were three compounds (6, 7 and 8) with the observable signal after 24 h exposure to the cells (Fig. 4B). However, the light intensity of luciferin esters was inevitably reduced. The corresponding solution to improve the light signal is to simply increase the concentration of the substrates. In addition, the luciferin derivatives with the carbonate structure were unstable in aqueous solution and they showed poor luminescence properties at the cellular level, so we did not carry out further study for such compounds. Significantly, the butyryloxymethyl luciferin 7 displayed wonderful light signal sustainability. The peak was observed at 15–20 min and remained stable for more than 4 hours. Besides the light intensity of the butyryloxymethyl luciferin 7 was relatively high. Therefore, we chose this compound for imaging of small living animals to further validate its utility in vivo.In vivo imaging
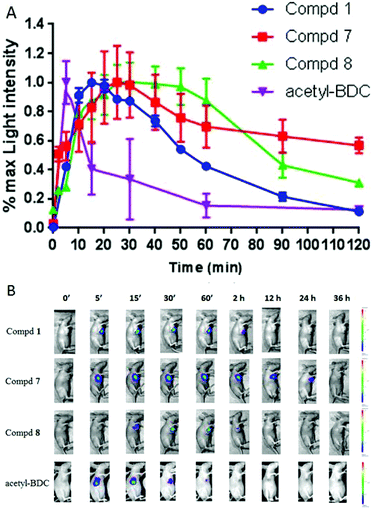
Based on the above-mentioned results, in vivo real-time and long-term tumor imaging was further explored. At present, there are few reports of coelenterazine derivatives applied in vivo, because such substrates can be oxidized by some substances such as serum and produce background signals. In addition, coelenterazine derivatives can be rapidly and irreversibly catalyzed by Renilla luciferase, so that the resulting signal cannot last long. In order to demonstrate that our luciferin esters can serve as a long-term imaging tool in vivo, we established a subcutaneous xenotransplanted tumor model of ES-2-Rluc cells in nude mice. When the anesthetized mice were administered intraperitoneally the free luciferin 1 or butyryloxymethyl luciferin 7, a high autoluminescence signal in the abdominal area was observed. At the same time, the subcutaneous tumors showed weak luminescence (images not shown). Hence the compounds were then injected directly into the tumor site. As shown in Fig. 5A and S4,† the luminous intensity peaked at 15 min after the free luciferin 1 injection and then declined at a faster rate over 2 h. In contrast, the luciferin esters exhibited improved kinetics of the luminescence reaction. Although the signal of the pivaloyloxymethyl luciferin 8 reached a plateau after 20 min, the relatively weak intensity decreased by half at 2 h. While the butyryloxymethyl luciferin 7 had a half-life period of more than 2 h and reached its maximum at 25 min. Surprisingly, the light signal of the butyryloxymethyl luciferin 7 could be detected after 24 h (Fig. 5B). The O-acetylated bisdeoxy coelenterazine acetyl-BDC was used as a control in order to compare the strength of the bioluminescence signal in vivo. The light intensity reached the peak during 5 minutes. After that, the signal dropped rapidly. The rate of maximum light was lower than that of compounds 1, 7 and 8. As shown in Fig. 5A, acetyl-BDC reached its maximum intensity in a short time, but the duration was short, and the bioluminescence intensity was almost impossible to capture after 1 h.Subsequently, we evaluated the bioluminescence imaging potential of compounds 1, 7 and 8 in a xenografted mouse model. The intensity of the butyryloxymethyl luciferin 7 was weaker as expected because the free luciferin 1 was released from the butyryloxymethyl luciferin 7. This indicated that the butyryloxymethyl luciferin 7 was hydrolyzed at a slower rate, so it is more suitable for long-time and stable imaging study. Taken as a whole, our studies demonstrated that the butyryloxymethyl luciferin 7 is a promising long-acting imaging substrate in vivo.
Experimental
Materials and apparatus
All chemicals were purchased from commercial suppliers and used without further purification. Ultrapure water was purified with a Mill-Q filtration system. UV-visible absorbance spectra were obtained on a PUXI TU-1901 spectrophotometer. High-pressure liquid chromatography (HPLC) spectra and the purity of the compounds were determined by analytical reverse-phase HPLC (Agilent, 1200 Infinity) on a Phenomenex C-18 column (250 × 4.6 mm). The pH test was performed using a pH-meter (OHAUS, STARTER3100). Melting points were measured using a Mel-Temp apparatus and were not corrected. 1H and 13C NMR spectra were obtained using Bruker AV-300 or AV-600 spectrometers. Mass spectral analyses were performed on an API 4000 (ESI-HRMS).Renilla luciferase was supplied by RayBiotech. ES-2-Rluc cells (a human ovarian cancer cell line stably expressing Renilla luciferase) were purchased from Shanghai BioDiagnosis Co., Ltd. Female nude mice (BALB/cA-nu) were purchased from the Animal Center of China Academy of Medical Sciences (Beijing, China). Luminescence imaging was recorded using an IVIS Kinetic (Caliper Life Sciences, USA) equipped with a cooled charge-coupled device (CCD) camera. Circular specified regions of interest (ROIs) were drawn over the areas, and the total flux was calculated using the Living Image software version 4.0 (Caliper Life Sciences).
Synthesis
The free luciferin 1 was synthesized according to our previous work.42 In this paper, we prepared a total of ten luciferin esters by simple esterification or etherification. Note that the free luciferin is unstable, so the reactions should be isolated from air. The detailed synthesis protocols and structural characterization are presented in the ESI.†Stability in aqueous solution
The stability of the free luciferin 1 and the luciferin esters was monitored by analytical HPLC and UV. For HPLC analysis, a reverse phase HPLC column from Phenomenex (C18, 250 mm × 4.6 mm) was used. Absorbance was monitored at 276 and 335 nm. The mobile phase was 60% acetonitrile in H2O containing 0.1% trifluoroacetic acid. The flow was 1.0 mL min−1 and the injection volume was 20.0 μL. All compounds were dissolved in Tris-HCl buffer (50 mM, pH = 7.4)–methanol (2![[thin space (1/6-em)]](https://www.rsc.org/images/entities/char_2009.gif) :
:![[thin space (1/6-em)]](https://www.rsc.org/images/entities/char_2009.gif) 3, v/v) at a final concentration of 60 μM. The samples were incubated at room temperature and measured at an interval of 1 h. When subjected to UV analysis, all compounds were also dissolved in Tris-HCl buffer (50 mM, pH = 7.4)–methanol (2
3, v/v) at a final concentration of 60 μM. The samples were incubated at room temperature and measured at an interval of 1 h. When subjected to UV analysis, all compounds were also dissolved in Tris-HCl buffer (50 mM, pH = 7.4)–methanol (2![[thin space (1/6-em)]](https://www.rsc.org/images/entities/char_2009.gif) :
:![[thin space (1/6-em)]](https://www.rsc.org/images/entities/char_2009.gif) 3, v/v) at a final concentration of 60 μM. Samples for absorption measurements were analysed using a sealed cuvette at room temperature. At appropriate time intervals, absorbance spectra were obtained on a PUXI TU-1901 spectrophotometer against blank solution. All kinetic experiments were performed in duplicate with similar results.
3, v/v) at a final concentration of 60 μM. Samples for absorption measurements were analysed using a sealed cuvette at room temperature. At appropriate time intervals, absorbance spectra were obtained on a PUXI TU-1901 spectrophotometer against blank solution. All kinetic experiments were performed in duplicate with similar results.
Ionic effects
Luminescence assays were performed with a cooled charge-coupled device (CCD) camera. Various inorganic ions, including NH4+, Mg2+, Ca2+, Fe2+, Fe3+, Cu2+, Al3+, Mn2+, Pb2+, Hg2+, Zn2+, CH3COO−, HCO3−, HSO3−, H2PO4−, S2−, N3−, SCN−, I−, BO3− and S2O32−, were dissolved in 50 mM Tris-HCl buffer (pH = 7.40) up to a concentration of 2 mM. Renilla luciferase (2 μg mL−1) and the luciferin esters (80 μM) were also diluted with the same Tris-HCl buffer. The detailed procedure is as follows: a volume of 50 μL of luciferin esters was added to an equivalent volume of various ions and incubated at 25 °C for 30 min in a black 96-well plate. After adding 100 μL of Renilla luciferase, the bioluminescent signal was immediately recorded with an exposure time of 30 s. As a blank control, Tris-HCl buffer without inorganic ions was added under the same experimental conditions. The experiment was carried out three times with similar results.Cytotoxicity test
Sulphorhodamine B (SRB) dye was used to determine the in vitro cytotoxicity of the luciferin esters towards ES-2 cells. After the cells (104 per well) were incubated in 96-well plates overnight, the culture medium was removed, and serial dilutions of the luciferin esters (0 μM, 22.5 μM, 45 μM, 90 μM, 180 μM, 360 μM, 720 μM, and 1.44 mM) in complete growth medium were added. The following standard procedure is described in ref. 41. Finally, a microplate reader (BMG, POLARstar® Omega) was used to record the absorbance signal at 540 nm. All the assays were performed in triplicate. IC50 values of the luciferin esters were calculated using non-linear regression analysis in the Prism 5.0 GraphPad software.Real-time imaging in live cells
ES-2-Rluc cells were cultured in Dulbecco's modified Eagle's Medium (DMEM) supplemented with 10% Fetal Bovine Serum (FBS) and 0.5 μg mL−1 puromycin. All compounds were dissolved in DMEM (containing 0.1% F-127, no Fetal Bovine Serum) to a gradient concentration (0, 5 μM, 10 μM, 20 μM, 40 μM, 60 μM, 80 μM, and 100 μM). One night before imaging experiments, ES-2-Rluc cells were seeded in a 96-well culture plate (4 × 10⁴ cells per well). After the medium was removed and cells were washed with DMEM, ES-2-Rluc cells were treated with 100 μL of various concentrations of compounds. Luminescence signals were immediately recorded every 5 min with an exposure time of 100 s. We conducted the experiments in triplicate with similar results.In vivo imaging
All animal studies were approved by the Ethics Committee and IACUC of Cheeloo College of Medicine, Shandong University, and were conducted in compliance with European guidelines for the care and use of laboratory animals. The subcutaneous xenotransplanted tumor model in nude mice was established following a reported approach.8 5-Week-old female nude mice (BALB/cA-nu) were purchased and group-housed in a room maintained at 25 °C with 40–60% humidity. A total of 5 × 10⁷ ES-2-Rluc cells were implanted subcutaneously in the right armpit region of each mouse. After 2–3 weeks, the mice bearing tumors of about 1.0 cm diameter were selected for imaging. The free luciferin was dissolved in ethanol and other compounds were dissolved in dimethylsulfoxide (DMSO) as stock. Then they were diluted with saline to a final concentration of 3.75 mM (containing 0.5% Pluronic F-127). After being anesthetized with isoflurane, tumor-bearing nude mice were injected with 50 μL of compounds in the tumor site. Then bioluminescence imaging was immediately performed with an exposure time of 60 s. The light signal was recorded every 5 min until it disappeared. The control group received an equal volume of saline only. Each compound was evaluated using at least three nude mice.Conclusions
In summary, the prodrug or caged-luciferin strategy affords an excellent platform for persistent bioluminescence imaging.45–51 By introducing ester protecting groups of different sizes into the carbonyl group of the free luciferin, we designed and synthesized ten novel pro-substrates for Renilla luciferase. These precursors could be effectively activated by intracellular esterases, lipases or nucleophilic substances, leading to a bioluminescence enhancement. After careful evaluation in vitro, in cellulo and in vivo, we found that butyryloxymethyl luciferin 7 with low cytotoxicity displayed prolonged bioluminescence imaging in living cells and mice. Therefore, this molecule can serve as a long-acting substrate for noninvasive extended bioluminescence imaging.Author contributions
M. L., L. D., I. Y., Y. H., M. Y. and X. M. designed the experiments. M. Y., T. J., Y. G., Y. C. and C. Z. synthesized the molecules. M. Y., X. M., X. Y. and Y. H. performed the biological evaluations of the molecules. M. L. and L. D. wrote the main manuscript text, and Y. H. and X. M. prepared all of the figures.Conflicts of interest
There are no conflicts to declare.Acknowledgements
This work was supported by grants from the National Program on Key Basic Research Project (no. 2013CB734000), the National Natural Science Foundation of China (no. 81673393), the Taishan Scholar Program at Shandong Province, the Qilu Scholar Program at Shandong University, the Shandong Provincial Natural Science Foundation (no. ZR2013HQ055), the American Cancer Society (no. RSG-16-215-01 TBE), the Russian Science Foundation (no. 17-14-01169) and the Major Project of Science and Technology of Shandong Province (no. 2015ZDJS04001).Notes and references
- K. Pinel, J. Lacoste, G. Plane, M. Ventura and F. Couillaud, Gene Ther., 2014, 21, 434–439 CrossRef CAS PubMed.
- J. R. Pribaz, N. M. Bernthal, F. Billi, J. S. Cho, R. I. Ramos, Y. Guo, A. L. Cheung, K. P. Francis and L. S. Miller, J. Orthop. Res., 2012, 30, 335–340 CrossRef PubMed.
- J. E. Kim, S. Kalimuthu and B. C. Ahn, Nucl. Med. Mol. Imaging, 2015, 49, 3–10 CrossRef CAS PubMed.
- D. M. Yurek, A. M. Fletcher, M. McShane, T. H. Kowalczyk, L. Padegimas, M. R. Weatherspoon, M. D. Kaytor, M. J. Cooper and A. G. Ziady, Mol. Imaging, 2011, 10, 327–339 CAS.
- Y. Inoue, F. Sheng, S. Kiryu, M. Watanabe, H. Ratanakanit, K. Izawa, A. Tojo and K. Ohtomo, Mol. Imaging, 2011, 10, 377–385 CAS.
- J. Huang, Y. M. Li, Q. Cheng, D. A. Vallera and W. A. Hall, Mol. Med. Rep., 2015, 12, 5163–5168 CrossRef CAS PubMed.
- A. Dragulescu-Andrasi, C. T. Chan, A. De, T. F. Massoud and S. S. Gambhir, Proc. Natl. Acad. Sci. U. S. A., 2011, 108, 12060–12065 CrossRef CAS PubMed.
- W. X. Wu, J. Li, L. Z. Chen, Z. Ma, W. Zhang, Z. Z. Liu, Y. N. Cheng, L. P. Du and M. Y. Li, Anal. Chem., 2014, 86, 9800–9806 CrossRef CAS PubMed.
- X. D. Tian, Z. Y. Li, C. W. Lau and J. Z. Lu, Anal. Chem., 2015, 87, 11325–11331 CrossRef CAS PubMed.
- P. Feng, H. T. Zhang, Q. K. Deng, W. Liu, L. H. Yang, G. B. Li, G. Chen, L. P. Du, B. W. Ke and M. Y. Li, Anal. Chem., 2016, 88, 5610–5614 CrossRef CAS PubMed.
- D. M. Mofford, S. T. Adams, G. S. K. K. Reddy, G. R. Reddy and S. C. Miller, J. Am. Chem. Soc., 2015, 137, 8684–8687 CrossRef CAS PubMed.
- H. Takakura, R. Kojima, M. Kamiya, E. Kobayashi, T. Komatsu, T. Ueno, T. Terai, K. Hanaoka, T. Nagano and Y. Urano, J. Am. Chem. Soc., 2015, 137, 4010–4013 CrossRef CAS PubMed.
- Y. Yuan, F. Q. Wang, W. Tang, Z. L. Ding, L. Wang, L. L. Liang, Z. Zheng, H. F. Zhang and G. L. Liang, ACS Nano, 2016, 10, 7147–7153 CrossRef CAS PubMed.
- Z. M. Kaskova, A. S. Tsarkova and I. V. Yampolsky, Chem. Soc. Rev., 2016, 45, 6048–6077 RSC.
- J. Li, L. Chen, L. Du and M. Li, Chem. Soc. Rev., 2013, 42, 662–676 RSC.
- W. W. Lorenz, R. O. McCann, M. Longiaru and M. J. Cormier, Proc. Natl. Acad. Sci. U. S. A., 1991, 88, 4438–4442 CrossRef CAS.
- E. P. Coutant and Y. L. Janin, Chem. – Eur. J., 2015, 21, 17158–17171 CrossRef CAS PubMed.
- T. Y. Jiang, L. P. Du and M. Y. Li, Photochem. Photobiol. Sci., 2016, 15, 466–480 CAS.
- J. C. Woo, M. H. Howell and A. G. Von Arnim, Protein Sci., 2008, 17, 725–735 CrossRef CAS PubMed.
- S. Bhaumik and S. S. Gambhir, Proc. Natl. Acad. Sci. U. S. A., 2002, 99, 377–382 CrossRef CAS PubMed.
- H. Zhao, T. C. Doyle, R. J. Wong, Y. Cao, D. K. Stevenson, D. Piwnica-Worms and C. H. Contag, Mol. Imaging, 2004, 3, 43–54 CrossRef CAS PubMed.
- K. D. G. Pfleger and K. A. Eidne, Nat. Methods, 2006, 3, 165–174 CrossRef CAS PubMed.
- S. H. Sun, X. B. Yang, Y. Wang and X. H. Shen, Int. J. Mol. Sci., 2016, 17, 1704 CrossRef PubMed.
- M. Paola, I. Casella and T. Costa, Acta Pharmacol. Sin., 2006, 27, 405–405 Search PubMed.
- L. Saleh and C. Plieth, Nat. Protoc., 2010, 5, 1635–1641 CrossRef CAS PubMed.
- Y. H. Jeon, S. A. Bae, Y. J. Lee, Y. L. Lee, S. W. Lee, G. S. Yoon, B. C. Ahn, J. H. Ha and J. Lee, Mol. Imaging, 2010, 9, 343–350 CAS.
- T. Kimura, K. Hiraoka, N. Kasahara and C. R. Logg, J. Gene Med., 2010, 12, 528–537 CrossRef CAS PubMed.
- L. Mezzanotte, M. Aswendt, A. Tennstaedt, R. Hoeben, M. Hoehn and C. Lowik, Contrast Media Mol. Imaging, 2013, 8, 505–513 CrossRef CAS PubMed.
- L. J. Kricka, Anal. Chem., 1993, 65, R460–R462 CrossRef.
- M. Mirasoli and E. Michelini, Anal. Bioanal. Chem., 2014, 406, 5529–5530 CrossRef CAS PubMed.
- N. Vassel, C. D. Cox, R. Naseem, V. Morse, R. T. Evans, R. L. Power, A. Brancale, K. T. Wann and A. K. Campbell, Luminescence, 2012, 27, 234–241 CrossRef CAS PubMed.
- T. Y. Jiang, X. F. Yang, X. Y. Yang, M. L. Yuan, T. C. Zhang, H. T. Zhang and M. Y. Li, Org. Biomol. Chem., 2016, 14, 5272–5281 CAS.
- J. Levi, A. De, Z. Cheng and S. S. Gambhir, J. Am. Chem. Soc., 2007, 129, 11900–11903 CrossRef CAS PubMed.
- M. Otto-Duessel, V. Khankaldyyan, I. Gonzalez-Gomez, M. C. Jensen, W. E. Laug and M. Rosol, Mol. Imaging, 2006, 5, 57–64 Search PubMed.
- E. Lindberg, S. Mizukami, K. Ibata, A. Miyawaki and K. Kikuchi, Chemistry, 2013, 19, 14970–14976 CrossRef CAS PubMed.
- M. Hattori, G. Kawamura, R. Kojima, M. Kamiya, Y. Urano and T. Ozawa, Anal. Chem., 2016, 88, 6231–6238 CrossRef CAS PubMed.
- Z. F. Walls, S. V. Gupta, G. L. Amidon and K. D. Lee, Bioorg. Med. Chem. Lett., 2014, 24, 4781–4783 CrossRef CAS PubMed.
- P. L. Meisenheimer, H. T. Uyeda, D. P. Ma, M. Sobol, M. G. McDougall, C. Corona, D. Simpson, D. H. Klaubert and J. J. Cali, Drug Metab. Dispos., 2011, 39, 2403–2410 CrossRef CAS PubMed.
- F. F. Craig, A. C. Simmonds, D. Watmore, F. Mccapra and M. R. H. White, Biochem. J., 1991, 276, 637–641 CrossRef CAS PubMed.
- M. Nakamura, T. Suzuki, N. Ishizaka, J. Sato and S. Inouye, Tetrahedron, 2014, 70, 2161–2168 CrossRef CAS.
- M. L. Yuan, X. J. Ma, T. Y. Jiang, C. C. Zhang, H. Chen, Y. Q. Gao, X. Y. Yang, L. P. Du and M. Y. Li, Org. Biomol. Chem., 2016, 14, 10267–10274 CAS.
- M. L. Yuan, T. Y. Jiang, L. P. Du and M. Y. Li, Chin. Chem. Lett., 2016, 27, 550–554 CrossRef CAS.
- G. Giuliani, A. Cappelli, S. Vomero and M. Anzini, WO2011007314, 2011 Search PubMed.
- G. Giuliani, P. Molinari, G. Ferretti, A. Cappelli, M. Anzini, S. Vomero and T. Costa, Tetrahedron Lett., 2012, 53, 5114–5118 CrossRef CAS.
- L. Cui, Y. Zhong, W. P. Zhu, Y. F. Xu, Q. S. Du, X. Wang, X. H. Qian and Y. Xiao, Org. Lett., 2011, 13, 928–931 CrossRef CAS PubMed.
- Y. Cheng, F. Huang, X. Min, P. Gao, T. Zhang, X. Li, B. Liu, Y. Hong, X. Lou and F. Xia, Anal. Chem., 2016, 88, 8913–8919 CrossRef CAS PubMed.
- M. Bio, P. Rajaputra, G. Nkepang and Y. J. You, J. Med. Chem., 2014, 57, 3401–3409 CrossRef CAS PubMed.
- F. Kong, Z. Liang, D. Luan, X. Liu, K. Xu and B. Tang, Anal. Chem., 2016, 88, 6450–6456 CrossRef CAS PubMed.
- H. Seki, S. Xue, S. Pellet, P. Silhar, E. A. Johnson and K. D. Janda, J. Am. Chem. Soc., 2016, 138, 5568–5575 CrossRef CAS PubMed.
- W. Hakamata, S. Tamura, T. Hirano and T. Nishio, ACS Med. Chem. Lett., 2014, 5, 321–325 CrossRef CAS PubMed.
- C. Perez, K. B. Daniel and S. M. Cohen, ChemMedChem, 2013, 8, 1662–1667 CrossRef CAS PubMed.
Footnotes |
| † Electronic supplementary information (ESI) available: The details of preparation of the luciferin esters and their NMR and HR-MS spectra. See DOI: 10.1039/c7ob01656e |
| ‡ These authors contributed equally. |
| This journal is © The Royal Society of Chemistry 2017 |

