 Open Access Article
Creative Commons Attribution 3.0 Unported Licence
Ratiometric electrochemical detection of hydrogen peroxide and glucose†
Sean
Goggins
 *,
Ellen A.
Apsey
,
Mary F.
Mahon
and
Christopher G.
Frost
Department of Chemistry, University of Bath, Claverton Down, Bath, BA2 7AY, UK. E-mail: s.goggins@bath.ac.uk
First published on 21st February 2017
Abstract
Hydrogen peroxide (H2O2) detection is of high importance as it is a versatile (bio)marker whose detection can indicate the presence of explosives, enzyme activity and cell signalling pathways. Herein, we demonstrate the rapid and accurate ratiometric electrochemical detection of H2O2 using disposable screen-printed electrodes through a reaction-based indicator assay. Ferrocene derivatives equipped with self-immolative linkers and boronic acid ester moieties were synthesised and tested, and, through a thorough assay optimisation, the optimum probe showed good stability, sensitivity and selectivity towards H2O2. The optimised conditions were then applied to the indirect detection of glucose via an enzymatic assay, capable of distinguishing 10 μM from the background within minutes.
Introduction
Hydrogen peroxide (H2O2) is an important small molecule used in many industrial applications, such as paper-bleaching and in the manufacture of disinfectants and explosives.1 In nature, it has been recently established that H2O2 is involved within a number of crucial roles related to cell signalling.2 Abnormally high concentrations of H2O2 can be cytotoxic to cells3 but more significantly, however, it is a precursor to the indiscriminately reactive hydroxyl radical (˙OH).4 This, along with other reactive oxygen species (ROS),5 have been shown to contribute to oxidative stress, a major factor in the onset of various diseases.6 Additionally, H2O2 is produced as a by-product in numerous enzyme-catalysed processes such as the aerobic oxidation of alcohols,7 urates,8 amino acids,9 and certain carbohydrates,10 including glucose.11 Moreover, H2O2 has become a popular signal propagator within signal amplification methodologies used to enhance the sensitivity of diagnostic assays.12,13 Since H2O2 can be used as a reactive biomarker for effective disease diagnosis, and disease monitoring, as well as to infer the presence of trace amounts of explosives,14 there is therefore a significant interest in the development of accurate and reliable hydrogen peroxide detection methods.Conventional H2O2 detection is typically achieved through optical techniques, namely using luminescent,15 or fluorescent methods.16 However, the need for transparent samples as well as the use of expensive optical equipment, prohibits their use at the point-of-need setting. Electrochemistry is therefore gaining increasing popularity due to its low-cost, inherent miniaturisation capability and simple incorporation into point-of-care (POC) devices.17 Despite this, the adoption of electrochemical (bio)sensors into POC devices is hampered by inaccurate and unreliable results caused by a number of issues; primarily significant variations in screen-printed electrode surface areas. One method to improve the accuracy and reliability of electrochemical (bio)sensors is through the employment of dual-reporter or ratiometric detection systems. Over recent years, the electrochemical sensing community have developed a variety of such innovative protocols for the detection of DNA,18 enzyme activity,19 proteins,20 heavy metals,21 and small molecules,22 among others.23 Continuing our endeavour into developing ratiometric electrochemical methods towards more accurate and more reliable electrochemical biosensors, we describe herein, the development of a ferrocene-derived probe specifically designed for the facile ratiometric electrochemical detection of H2O2 and demonstrate its application towards a reliable electrochemical glucose chemodosimeter.
Results and discussion
Optimisation of probe structure
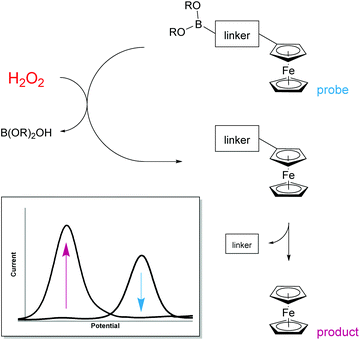
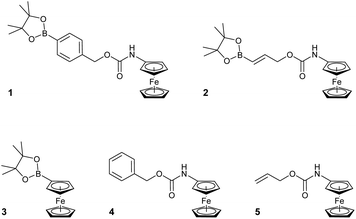
H2O2 is itself electrochemically active but only at a high oxidation potential.24 In order to decrease this overpotential and increase specificity, previous electrochemical methods for the detection of H2O2 have focussed upon modifying electrodes using advanced materials.25 However, the use of modified electrodes is unfeasible at the point-of-need setting as they can be expensive and difficult to manufacture, and are currently unable to be easily mass produced. To obtain a ratiometric detection method at facile oxidation potentials,‡ without the need for modified electrodes, we looked to begin our investigation by utilising ferrocene as a redox-active label. Also, by coupling a boronic acid trigger moiety into the design of the ferrocene-based probe, we hypothesised that oxidation and subsequent hydrolysis of the boronic acid trigger would only occur selectively in the presence of H2O2,26 allowing for an irreversible reaction-based detection method to be achieved (Fig. 1).27Towards this end, compounds 1–5 were designed and synthesised (see ESI†) with the aim of identifying the optimum structural criteria needed to attain a selective ratiometric electrochemical detection method for H2O2 (Fig. 2). Since different self-immolative linkers exhibit different elimination kinetics in response to H2O2,28 compounds 1–3 were designed to determine the linker that delivered the quickest release of an electron-rich ferrocene reporter unit. Specifically, compound 1 utilised the commonly employed p-benzyl carbamate linker (the definitive structure of which was confirmed by X-ray crystallography (Fig. 3)),29 compound 2 contained a recently-described allyl carbamate linker,30 and compound 3 contained no linker at all. Compounds 4–5, structural analogs of compounds 1–2 without the boronic acid trigger, were designed to determine and confirm that the specificity of the reactivity towards H2O2 arises from the boronic acid ester trigger unit.
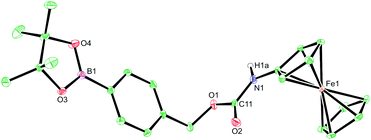 | ||
| Fig. 3 X-ray crystal structure of probe 1. Ellipsoids are depicted at 30% probability and C–H hydrogen atoms have been omitted for clarity. Atom colours: C, green; O, red; B, magenta; N, blue; Fe, orange.§ | ||
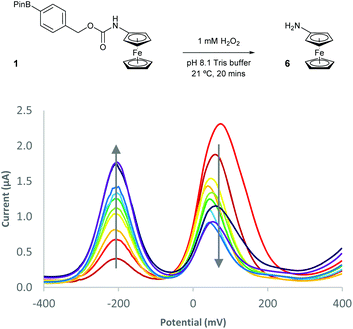
With probes 1–5 in hand, 100 μM concentrations of the probes in pH 8.1 tris(hydroxymethyl)methylamine (Tris) buffer were exposed to a solution containing 1 mM (10 equivalents) of H2O2 and the assay analysed after 20 minutes using differential pulse voltammetry (DPV). When the reaction assays regarding probes 1 and 2 were analysed, complete disappearance of the oxidation peak corresponding to the substrate and a new peak, at a significantly lower oxidation potential, was observed (Fig. 4). This peak was found to be at an identical oxidation potential as that of aminoferrocene 6, which was synthesised separately according to a literature procedure.31 As such, this observation of a ratiometric electrochemical detection method can be attributed to the as-designed H2O2-mediated oxidation of the boronic acid moiety to its corresponding alcohol, which is followed by subsequent linker elimination and carbamate decarboxylation to release aminoferrocene 6.
The analysis of the peroxide assay with probe 3 also revealed the disappearance of the probe peak but no expected peak at a lower oxidation potential was seen. This could be due to H2O2-mediated oxidation of the ferroceneboronic acid probe 3 to hydroxyferrocene 7 but due to the known instability of 7 in aqueous conditions,32 rapid decomposition of the product occurred. When probes 4 and 5 were exposed to H2O2, no peak corresponding to aminoferrocene 6 was observed showing that the carbamate functionality is stable towards alkaline peroxide and confirms that the boronic acid ester trigger moieties are essential for achieving peroxide selectivity within reaction-based assays.
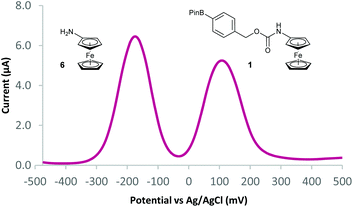
Two separate equimolar solutions (100 μM total ferrocene concentration) containing probe 1 and aminoferrocene 6 (Fig. 5), and probe 2 and 6 (see ESI†) were analysed by DPV. Differences in oxidation potentials (ΔEox) between probe and reporter were found to be 268 mV (±14 mV)¶ and 232 mV (±4 mV)¶ respectively. These values can be considered more than sufficient to deliver a ratiometric detection method as an ideal difference in oxidation potential between substrate and product has previously been suggested to be between 100–200 mV to ensure both compounds are not oxidised at the same oxidation potential.33 This allows for, through integration of the peaks on the voltammogram, reaction conversions to be calculated via:
In order to determine which probe showed the greatest reactivity towards H2O2, as well as the quickest elimination kinetics, 100 μM concentrations of the probes were exposed to differing concentrations of H2O2 and monitored over time through ratiometric electrochemical analysis (Fig. 6 and ESI†). Pleasingly, all concentrations of 1 eq. H2O2 and higher afforded positive production of compound 6. Importantly, a <2% background rate was also observed exemplifying the excellent stability of probes with carbamate linkages in aqueous buffers. This allowed a 100 μM concentration of H2O2 to be determined from the background. Despite improved solubility in the aqueous medium, probe 1 was taken forward over probe 2 for further optimisation due to its increased reactivity and the greater ΔEox observed between substrate and product, which is likely caused by its increased hydrophobicity.34
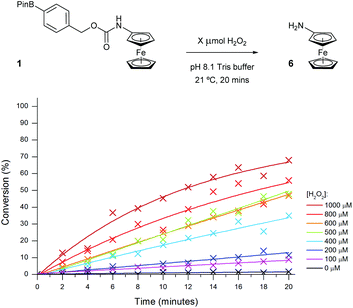 | ||
| Fig. 6 Conversion of probe 1 (100 μM) to aminoferrocene 6 in 50 mM pH 8.1 Tris buffer in the presence of various concentrations of H2O2. | ||
Assay optimisation
In order to improve the sensitivity of the assay, a number of reaction parameters were investigated. First, a range of different alkaline buffers were tested to determine if the buffer type had any effect on the reactivity of the probe. Unfortunately, any diversion away from the originally chosen Tris buffer either led to the appearance of significant artefacts on the voltammogram or caused substantial decomposition of the ferrocene probes. As such, ideal like-for-like comparisons could not be made since accurate peak integrations, and therefore precise reaction conversions, were unable to be obtained.The pH of the assay was next to be studied since peroxide reactivity and linker elimination can both be affected through changes in pH.35 The useful working pH range of Tris buffer is 7–9 and as such, the assay was conducted at various pH values within this range (Fig. 7).36 As expected, decreasing the pH of the assay medium led to a significant reduction in conversion due to the shift in equilibrium from the hydroxide anion (HOO−) to its neutral species (H2O2) and also due to the increase in stability of the resultant phenol intermediate post-oxidation of probe 1. Increasing the pH above 8.1 had the desired effect of enhancing the reactivity of H2O2 towards probe 1, enabling near quantitative conversion to aminoferrocene 6 to be obtained within 20 minutes in the presence of 500 μM (5 eq.) of H2O2.
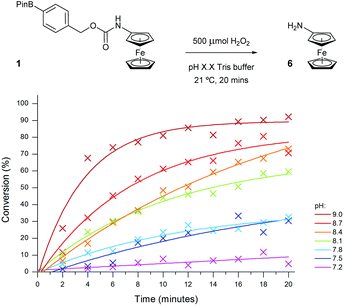 | ||
| Fig. 7 Conversion of probe 1 (100 μM) to aminoferrocene 6, varying the pH of 50 mM Tris buffer in the presence of 500 μM of H2O2. | ||
Finally, in a bid to improve the sensitivity of the assay further, the temperature of the reaction was next to be looked at (see ESI†). Increasing the temperature of the assay from room temperature to 37 °C was found to only slightly increase reaction conversion. Increasing the temperature further led to a dramatic rate increase with near quantitative conversions being obtained within 20 minutes in the presence of only 250 μM (2.5 eq.) H2O2. However, at these elevated temperatures, fluctuating conversions can be seen thought to be due to the slow disappearance of the aminoferrocene 6 product peak and thus indicating decomposition of the product. This can be rationalised by the increased oxidation rate, and subsequent fragmentation, of aminoferrocene 6 at these high temperatures via known oxidation pathways.37 To minimise product oxidation, all subsequent assays were performed at room temperature. Importantly however, at all temperatures tested, minimal background conversions were observed (<2%), which reinforces the high stability of the carbamate functionality to undesired background hydrolysis.
The optimised assay parameters were then applied to the detection of different H2O2 concentrations using probe 1 (Fig. 8) and a calibration curve obtained (Fig. 9). Overall, the optimisation allowed for near quantitative conversions to aminoferrocene 6 to be achieved in just 20 minutes in the presence of 10 equivalents of H2O2 and importantly, in the absence of any peroxide, no conversion was seen. A linear dynamic range between 0 and 800 μM of H2O2 could also be observed.
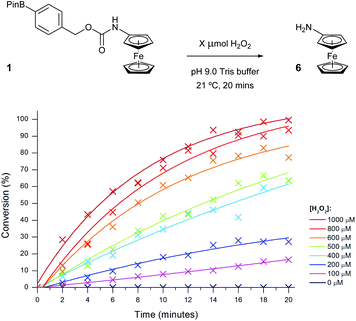 | ||
| Fig. 8 Conversion of probe 1 (100 μM) to aminoferrocene 6 in 50 mM pH 9 Tris buffer in the presence of various concentrations of H2O2. | ||
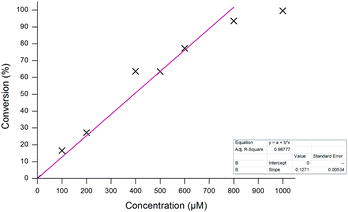 | ||
| Fig. 9 Calibration curve for the conversion of probe 1 (100 μM) to aminoferrocene 6 after 20 minutes at varying H2O2 concentrations. | ||
Peroxide selectivity studies
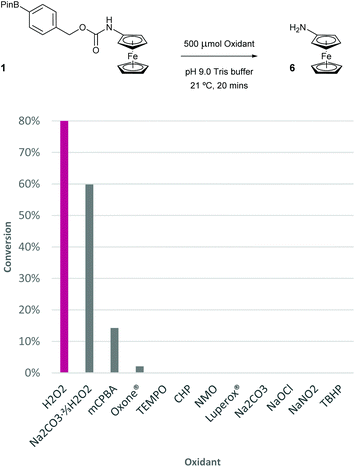
To determine the selectivity of the probe for H2O2, a range of different peroxides, oxidants and salts were screened (Fig. 10). Specifically, a 100 μM solution of probe 1 was exposed to 5 equivalents of the oxidant and after 20 minutes of vigorous stirring, a sample of the assay was taken and subjected to DPV analysis. Of all oxidants screened, sodium percarbonate was the only oxidant other than H2O2 to give >15% conversion of probe 1 to aminoferrocene 6. Sodium carbonate itself delivered 0% confirming that the conversion observed for sodium percarbonate is caused by the ≈66% contained H2O2. meta-Chloroperbenzoic acid (mCPBA) furnished 14% conversion over the same time period but significant decomposition of both 1 and 6 was observed in this case, presumably due to oxidation of the iron(II) centre. Other peroxides, such as Oxone®, cumene hydroperoxide (CHP), Luperox® and tert-butylhydrogen peroxide (TBHP), all gave little to no conversion showing the excellent selectivity of probe 1 to H2O2. Other ROS, including free radicals (TEMPO), N-oxides (NMO), hypochlorite and nitrite, among others (see ESI† for full oxidant screen), also afforded minimal conversion if any.Ratiometric electrochemical glucose detection
According to the World Health Organisation, an estimated 422 million people suffer with diabetes globally and approximately 90% suffer with Type II; the type most commonly caused by behavioural and environmental risk factors.38 Left unregulated, elevated blood glucose levels can inflict significant capillary vessel damage and, depending on its location in the body, can go on to cause retinopathy, kidney failure and the onset of cardiovascular disease.39 Evidently, glucose concentrations in blood needs to be regularly measured reliably and to a high level of accuracy (±20% for concentrations above 5.6 mM or within ±0.83 mM for below).40 Surprisingly however, many currently commercially available glucose biosensors do not meet this standard.41 There is therefore still significant room for improvement regarding improving the accuracy and reliability of glucose detection.Selective enzymatic reactions are often employed within electrochemical analyte detection methods to minimise noise from the possible presence of electrooxidisable interferents in the sample matrix.42 For electrochemical glucose sensing, glucose oxidase (GOx) is most commonly chosen,43 and in the process of oxidising glucose to D-glucono-δ-lactone, the mechanism of action for GOx also reduces molecular oxygen to hydrogen peroxide (H2O2).44 As such, we hypothesised that we could also apply probe 1 under our previously optimised conditions towards the ratiometric electrochemical detection of glucose.
Initially, we sought to investigate the level of GOx activity needed to achieve full conversion of probe 1 in the shortest time (see ESI†), to help facilitate implementation of the methodology into a point-of-need device in the future. The concentration of glucose within the assay was chosen to be 5 mM (50 eq.) to ensure that enough H2O2 would be released to deliver full conversion of 1. As expected, high levels of GOx activity (>50 U mL−1) delivered full conversion of 1 to 6 within the 20-minute assay time. Lowering the concentration of the enzyme led to a much slower conversion since the rate of glucose oxidation, and therefore H2O2 production, would be greatly reduced. Importantly, in the absence of GOx, neither conversion of 1 to aminoferrocene 6, or any shift in oxidation potential,45 was observed showing that conversion of the probe was not occurring through a supramolecular interaction between the boronic acid ester and glucose.46
As both high sensitivity for the analyte and a quick time-to-response are both critical factors in the implementation of diagnostic assays within point-of-need biosensors, we chose to take forward the highest concentration of GOx previously tested. Thus, to attain the sensitivity of the ratiometric electrochemical assay towards glucose, a range of glucose concentrations were screened in the presence of 100 U mL−1 GOx (Fig. 11).
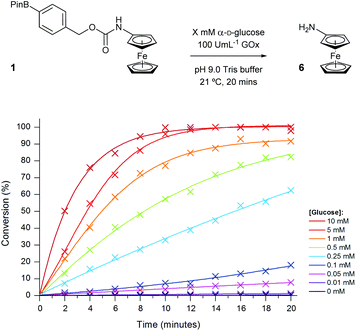 | ||
| Fig. 11 Conversion of probe 1 (100 μM) to aminoferrocene 6 in 50 mM pH 9.0 Tris buffer in the presence of 100 U mL−1 GOx with varying concentrations of α-D-glucose. | ||
Similar to previous, high concentrations of glucose (>5 mM) were able to successfully achieve full conversion of probe 1 to 6 within the 20-minute timeframe. Again, in the absence of the sugar, no conversion was observed which highlights the selectivity of the probe towards the enzyme-catalysed production of H2O2 and not through any undesired interaction with the enzyme. The assay also demonstrated a good dynamic range over two orders of magnitude allowing for glucose concentrations between 10 μM and 1 mM to be easily distinguishable after just 10 minutes (Fig. 12). Glucose concentrations in blood, and other bodily fluids, are typically found within this range,47 which lends this ratiometric detection method towards such application if desired. As all ratiometric electrochemical conversions have been determined through the use of screen-printed carbon electrodes, subsequent work will involve the implementation of the methodology into a point-of-need biosensor with the aim of developing a device with an improved accuracy over those which are currently commercially available.
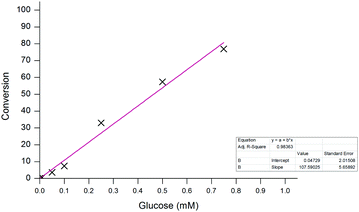 | ||
| Fig. 12 Calibration curve for the conversion of probe 1 (100 μM) to aminoferrocene 6 after 10 minutes. | ||
Conclusions
In conclusion, two ferrocene-derived probes were designed for the ratiometric electrochemical detection of hydrogen peroxide (H2O2) and synthesised to contain two different self-immolative linkers for comparison. The probe containing a benzyl carbamate linker was found to give a larger difference in oxidation potential between probe and product and exhibited faster elimination kinetics than the probe containing an allyl carbamate linker. An optimisation of the diagnostic assay parameters found that pH 9 tris(hydroxymethyl)methylamine (Tris) buffer at room temperature afforded efficient conversion of probe to product while minimising electrochemical artefacts and any undesired product oxidation. The probe was also found to be very selective for H2O2 compared with a range of other common oxidants.The ratiometric electrochemical detection methodology was then applied to the detection of glucose through the concomitant glucose oxidase (GOx)-catalysed reduction of O2 to H2O2. The optimum enzyme concentration was initially found prior to the determination of the sensitivity of the glucose assay. Glucose concentrations as low as 50 μM could be determined from the background rate within 20 minutes and the assay also exhibited a good dynamic range over 2 orders of magnitude.
Acknowledgements
The authors would like to thank Atlas Genetics Ltd for the kind donation of a potentiostat and for providing the screen-printed carbon electrodes. They would also like to acknowledge the use of nuclear magnetic resonance (NMR) and mass spectrometry (MS) facilities within the Chemical Characterisation and Analysis Facility (CCAF) at the University of Bath for compound characterisation.Notes and references
- C. W. Jones, Applications of Hydrogen Peroxide and Derivatives, The Royal Society of Chemistry, Cambridge, 1999, ch. 6, pp. 231–251 Search PubMed.
- (a) Z. A. Wood, L. B. Poole and P. A. Karplus, Science, 2003, 300, 650 CrossRef CAS PubMed; (b) S. G. Rhee, Science, 2006, 312, 1882 CrossRef PubMed; (c) E. A. Veal, A. M. Day and B. A. Morgan, Mol. Cell, 2007, 26, 1 CrossRef CAS PubMed.
- (a) S. K. Jonas, P. A. Riley and R. L. Willson, Biochem. J., 1989, 264, 651 CrossRef CAS PubMed; (b) A. M. Gardner, F.-H. Xu, C. Fady, F. J. Jacoby, D. C. Duffey, Y. Tu and A. Lichtenstein, Free Radical Biol. Med., 1997, 22, 73 CrossRef CAS; (c) C. Richter-Landsberg and U. Vollgraf, Exp. Cell Res., 1998, 244, 218 CrossRef CAS PubMed; (d) U. Vollgraf, M. Wegner and C. Richter-Landsberg, J. Neurochem., 1999, 73, 2501 CrossRef CAS PubMed; (e) P. Daroui, S. D. Desai, T.-K. Li, A. A. Liu and L. F. Liu, J. Biol. Chem., 2004, 279, 14587 CrossRef CAS PubMed.
- (a) R. G. Zepp, B. C. Faust and J. Hoigne, Environ. Sci. Technol., 1992, 26, 313 CrossRef CAS; (b) Y. Sun and J. J. Pignatello, Environ. Sci. Technol., 1993, 27, 304 CrossRef CAS; (c) M. I. Stefan, A. R. Hoy and J. R. Bolton, Environ. Sci. Technol., 1996, 30, 2382 CrossRef CAS.
- C. C. Winterbourn, Nat. Chem. Biol., 2008, 4, 278 CrossRef CAS PubMed.
- (a) T. Finkel and N. J. Holbrook, Nature, 2000, 408, 239 CrossRef CAS PubMed; (b) M. Giorgio, M. Trinei, E. Miglaccio and P. G. Pelicci, Nat. Rev. Mol. Cell Biol., 2007, 8, 722 CrossRef CAS PubMed; (c) M. T. Lin and M. F. Beal, Nature, 2006, 443, 787 CrossRef CAS PubMed; (d) N. Houstis, E. D. Rosen and E. S. Lander, Nature, 2006, 440, 944 CrossRef CAS PubMed; (e) J. P. Fruehauf and F. L. Meysken Jr., Clin. Cancer Res., 2007, 448, 789 CrossRef PubMed.
- A. M. Azevedo, D. M. F. Prazeres, J. M. S. Cabral and L. P. Fonseca, Biosens. Bioelectron., 2005, 21, 235 CrossRef CAS PubMed.
- K. Kahn, P. Serfozo and P. A. Tipton, J. Am. Chem. Soc., 1997, 119, 5435 CrossRef CAS.
- M. S. Pilone, Cell. Mol. Life Sci., 2000, 57, 1732 CrossRef CAS PubMed.
- E. W. van Hellemond, N. G. H. Leferink, D. P. H. M. Heuts, M. W. Fraaije and W. J. H. van Berkel, Advances in Applied Microbiology, Elsevier, San Diego, 2006, vol. 60, ch. 2, pp. 17–45 Search PubMed.
- R. Wilson and A. P. F. Turner, Biosens. Bioelectron., 1992, 7, 165 CrossRef CAS.
- For reviews: (a) P. Scrimin and L. J. Prins, Chem. Soc. Rev., 2011, 40, 4488 RSC; (b) O. V. Makhlynets and I. V. Korendovych, Biomolecules, 2014, 4, 402 CrossRef PubMed; (c) S. Goggins and C. G. Frost, Analyst, 2016, 141, 3157 RSC.
- For specific examples: (a) E. Sella and D. Shabat, J. Am. Chem. Soc., 2009, 131, 9934 CrossRef CAS PubMed; (b) M. Avital-Shmilovici and D. Shabat, Bioorg. Med. Chem., 2010, 18, 3643 CrossRef CAS PubMed; (c) E. Sella, A. Lubelski, J. Klafter and D. Shabat, J. Am. Chem. Soc., 2010, 132, 3945 CrossRef CAS PubMed; (d) N. Karton-Lifshin and D. Shabat, New J. Chem., 2012, 36, 386 RSC; (e) K. Yeung, K. M. Schmid and S. T. Phillips, Chem. Commun., 2013, 49, 394 RSC; (f) E. Sella and D. Shabat, Org. Biomol. Chem., 2013, 11, 5074 RSC; (g) T. Yoshii, S. Onogi, H. Shigemitsu and I. Hamachi, J. Am. Chem. Soc., 2015, 137, 3360 CrossRef CAS PubMed.
- Y. Salinas, R. Martínez-Máñez, M. D. Marcos, F. Sancenón, A. M. Costero, M. Parra and S. Gil, Chem. Soc. Rev., 2012, 41, 1261 RSC.
- (a) M. Schäferling, D. B. M. Grögel and S. Schreml, Microchim. Acta, 2011, 174, 1 CrossRef; (b) O. S. Wolfbeis, A. Dürkop, M. Wu and Z. Lin, Angew. Chem., Int. Ed., 2002, 41, 4495 CrossRef CAS; (c) Y.-C. Shiang, C.-C. Huang and H.-T. Chang, Chem. Commun., 2009, 3437 RSC; (d) O. Seven, F. Sozmen and I. S. Turan, Sens. Actuators, B, 2017, 239, 1318 CrossRef CAS.
- (a) L.-C. Lo and C.-Y. Chen, Chem. Commun., 2003, 2728 RSC; (b) A. E. Albers, V. S. Okreglak and C. J. Chang, J. Am. Chem. Soc., 2006, 128, 9640 CrossRef CAS PubMed; (c) B. C. Dickinson, C. Huynh and C. J. Chang, J. Am. Chem. Soc., 2010, 132, 5906 CrossRef CAS PubMed; (d) N. Karton-Lifshin, E. Segal, L. Omer, M. Portnoy, R. Satchi-Fainaro and D. Shabat, J. Am. Chem. Soc., 2011, 133, 10960 CrossRef CAS PubMed; (e) D. Srikun, E. W. Miller, D. W. Domaille and C. J. Chang, J. Am. Chem. Soc., 2008, 130, 4596 CrossRef CAS PubMed; (f) X. Sun, S.-Y. Xu, S. E. Flower, J. S. Fossey, X. Qian and T. D. James, Chem. Commun., 2013, 49, 8311 RSC; (g) X. Sun, M. Odyniec, A. C. Sedgwick, K. Lacina, S. Xu, T. Qiang, S. Bull, F. Marken and T. D. James, Org. Chem. Front., 2017 10.1039/C6QO00448B.
- (a) J. Wang, Biosens. Bioelectron., 2006, 21, 1887 CrossRef CAS PubMed; (b) N. J. Ronkainen, H. B. Halsall and W. R. Heineman, Chem. Soc. Rev., 2010, 39, 1747 RSC.
- (a) Y. Du, B. J. Lim, B. Li, Y. S. Jiang, J. L. Sessler and A. D. Ellington, Anal. Chem., 2014, 86, 8010 CrossRef CAS PubMed; (b) F. Gao, L. Du, Y. Zhang, D. Tang and Y. Du, Anal. Chim. Acta, 2015, 883, 67 CrossRef CAS PubMed; (c) E. Xiong, X. Zhang, Y. Liu, J. Zhou, P. Yu, X. Li and J. Chen, Anal. Chem., 2015, 87, 7291 CrossRef CAS PubMed; (d) T. Wang, L. Zhou, S. Bai, Z. Zhang, J. Li, X. Jing and G. Xie, Biosens. Bioelectron., 2016, 78, 464 CrossRef CAS PubMed; (e) B. Wei, J. Zhang, H. Wang and F. Xia, Analyst, 2016, 141, 4313 RSC.
- (a) A. Sagi, J. Rishpon and D. Shabat, Anal. Chem., 2006, 78, 1459 CrossRef CAS PubMed; (b) S. Goggins, B. J. Marsh, A. T. Lubben and C. G. Frost, Chem. Sci., 2015, 6, 4978 RSC; (c) X. Cao, J. Xia, H. Liu, F. Zhang, Z. Wang and L. Lu, Sens. Actuators, B, 2017, 239, 166 CrossRef CAS.
- (a) K. Ren, J. Wu, F. Yan and H. Ju, Sci. Rep., 2014, 4, 4360 Search PubMed; (b) P. Yu, J. Zhou, L. Wu, E. Xiong, X. Zhang and J. Chen, J. Electroanal. Chem., 2014, 732, 61 CrossRef CAS; (c) K. Ren, J. Wu, F. Yan, Y. Zhang and H. Ju, Biosens. Bioelectron., 2015, 66, 345 CrossRef CAS PubMed; (d) P. Yu, X. Zhang, J. Zhou, E. Xiong, X. Li and J. Chen, Sci. Rep., 2015, 5, 16015 CrossRef CAS PubMed; (e) F. Gao, Y. Qian, L. Zhang, S. Dai, Y. Lan, Y. Zhang, L. Du and D. Tang, Biosens. Bioelectron., 2015, 71, 158 CrossRef CAS PubMed; (f) S. Goggins, C. Naz, B. J. Marsh and C. G. Frost, Chem. Commun., 2015, 51, 561 RSC; (g) Y. Liu, Y. Liu, Z. Matharu, A. Rahimian and A. Revzin, Biosens. Bioelectron., 2015, 64, 43 CrossRef CAS PubMed; (h) C. Deng, X. Pi, P. Qian, X. Chen, W. Wu and J. Xiang, Anal. Chem., 2017, 89, 966 CrossRef CAS PubMed.
- (a) X. Chai, L. Zhang and Y. Tian, Anal. Chem., 2014, 86, 10668 CrossRef CAS PubMed; (b) E. Xiong, L. Wu, J. Zhou, P. Yu, X. Zhang and J. Chen, Anal. Chim. Acta, 2015, 853, 242 CrossRef CAS PubMed; (c) J. Jia, H. G. Chen, J. Feng, J. L. Lei, H. Q. Luo and N. B. Li, Anal. Chim. Acta, 2016, 908, 95 CrossRef CAS PubMed.
- (a) H. Cheng, X. Wang and H. Wei, Anal. Chem., 2015, 87, 8889 CrossRef CAS PubMed; (b) X. Zhang, L. Wu, J. Zhou, X. Zhang and J. Chen, J. Electroanal. Chem., 2015, 742, 97 CrossRef CAS; (c) P. Yeng, Y. Liu, X. Zhang, J. Zhou, E. Xiong, X. Li and J. Chen, Biosens. Bioelectron., 2016, 79, 22 CrossRef PubMed; (d) Y. Liu, X. Zhang, J. Yang, E. Xiong, X. Zhang and J. Chen, Can. J. Chem., 2016, 94, 509 CrossRef; (e) M. Kesavan, V. Mani and S.-T. Huang, RSC Adv., 2016, 6, 71727 RSC; (f) H. Li, N. Arroyo-Currás, D. King, F. Ricci and K. W. Plaxco, J. Am. Chem. Soc., 2016, 138, 15809 CrossRef CAS PubMed.
- W.-J. Shen, Y. Zhuo, Y.-Q. Chai and R. Yuan, Anal. Chem., 2015, 87, 11345 CrossRef CAS PubMed.
- S. Alegret, F. Céspedes, E. Martínez-Fàbregas, D. Martorell, A. Morales, E. Centelles and J. Muñoz, Biosens. Bioelectron., 1996, 11, 35 CrossRef CAS.
- W. Chen, S. Cai, Q.-Q. Ren, W. Wen and Y.-D. Zhao, Analyst, 2012, 137, 49 RSC.
- A. R. Lippert, G. C. van de Bittner and C. J. Chang, Acc. Chem. Res., 2011, 44, 793 CrossRef CAS PubMed.
- D.-G. Cho and J. L. Sessler, Chem. Soc. Rev., 2009, 38, 1647 RSC.
- J. L. Major Jourden, K. B. Daniel and S. M. Cohen, Chem. Commun., 2011, 47, 7968 RSC.
- S. Gnaim and D. Shabat, Acc. Chem. Res., 2014, 47, 2970 CrossRef CAS PubMed.
- A. D. Brooks, K. Yeung, G. G. Lewis and S. T. Phillips, Anal. Methods, 2015, 7, 7186 RSC.
- D. C. D. Butler and C. J. Richards, Organometallics, 2002, 21, 5433 CrossRef CAS.
- (a) A. N. Nesmeyanov, V. A. Sazonova and V. N. Drozd, Tetrahedron Lett., 1959, 1, 13 CrossRef; (b) R. Epton, G. Marr and G. K. Rogers, J. Organomet. Chem., 1976, 110, C42 CrossRef CAS.
- C. J. McNeil, I. J. Higgins and J. V. Bannister, Biosensors, 1987/88, 3, 199 Search PubMed.
- B. J. Marsh, L. Hampton, S. Goggins and C. G. Frost, New J. Chem., 2014, 38, 5260 RSC.
- A. Alouane, R. Labruère, T. Le Saux, F. Schmidt and L. Jullien, Angew. Chem., Int. Ed., 2015, 54, 7492 CrossRef CAS PubMed.
- R. G. Bates and V. E. Bower, Anal. Chem., 1956, 28, 1322 CrossRef CAS.
- (a) H. Hagan, P. Marzenell, E. Jentzsch, F. Wenz, M. R. Veldwijk and A. Mokhir, J. Med. Chem., 2012, 55, 924 CrossRef PubMed; (b) P. Marzenell, H. Hagan, L. Sellner, T. Zenz, R. Grinyte, V. Pavlov, S. Daum and A. Mokhir, J. Med. Chem., 2013, 56, 6935 CrossRef CAS PubMed; (c) A. Leonidova, P. Anstaett, V. Pierroz, C. Mari, B. Spingler, S. Ferrari and G. Gasser, Inorg. Chem., 2015, 54, 9740 CrossRef CAS PubMed; (d) M. Schikora, A. Reznikov, L. Chaykovskaya, O. Sachinska, L. Polyakova and A. Mokhir, Bioorg. Med. Chem. Lett., 2015, 25, 3447 CrossRef CAS PubMed.
- Global Report on Diabetes, World Health Organisation (WHO), Geneva, 2016 Search PubMed.
- D. M. Nathan, N. Engl. J. Med., 1993, 328, 1676 CrossRef CAS PubMed.
- In Vitro Diagnostic Test Systems – Requirements for Blood Glucose Monitoring Systems for Self-Testing in Managing Diabetes Mellitus (ISO 15197:2013), International Organisation for Standardisation (ISO), Geneva, 2013 Search PubMed.
- C. Tack, H. Pohlmeier, T. Behnke, V. Schmid, M. Grenningloh, T. Forst and A. Pfützner, Diabetes Technol. Ther., 2012, 14, 330 CrossRef CAS PubMed.
- A. Heller and B. Feldman, Chem. Rev., 2008, 108, 2482 CrossRef CAS PubMed.
- R. Wilson and A. P. F. Turner, Biosens. Bioelectron., 1992, 7, 165 CrossRef CAS.
- S. B. Bankar, M. V. Bule, R. S. Singhal and L. Ananthanarayan, Biotechnol. Adv., 2009, 27, 489 CrossRef CAS PubMed.
- H.-C. Wang, H. Zhou, B. Chen, P. M. Mendes, J. S. Fossey, T. D. James and Y.-T. Long, Analyst, 2013, 138, 7146 RSC.
- X. Sun and T. D. James, Chem. Rev., 2015, 115, 8001 CrossRef CAS PubMed.
- E. Witkowska Nery, M. Kundys, P. S. Jeleń and M. Jönsson-Niedziółka, Anal. Chem., 2016, 88, 11271 CrossRef CAS PubMed.
Footnotes |
| † Electronic supplementary information (ESI) available: General information, materials, electrochemical methods, synthetic routes and procedures for ferrocene probes, additional differential pulse voltammograms, additional assay figures, full details of the oxidant screen and copies of NMR spectra for novel compounds. CCDC 1528331. For ESI and crystallographic data in CIF or other electronic format see DOI: 10.1039/c7ob00211d |
| ‡ Facile oxidation potentials are considered to be 0 mV (±500 mV) vs. Ag/AgCl as this minimises the risk of interfering redox reactions from taking place and where the background current is lowest. |
§ Crystal data for compound 1. C24H28NO4FeB, M = 461.13, triclinic, space group P![[1 with combining macron]](https://www.rsc.org/images/entities/char_0031_0304.gif) (no. 2), a = 9.8839(4), b = 9.9233(4), c = 13.1134(5) Å, α = 109.219(4), β = 93.721(3), γ = 115.017(4)°, U = 1068.78(7) Å3, Z = 2, T = 150 K, μ(Cu Kα) = 5.914 mm−1, Dc = 1.433 g cm−3, 10 (no. 2), a = 9.8839(4), b = 9.9233(4), c = 13.1134(5) Å, α = 109.219(4), β = 93.721(3), γ = 115.017(4)°, U = 1068.78(7) Å3, Z = 2, T = 150 K, μ(Cu Kα) = 5.914 mm−1, Dc = 1.433 g cm−3, 10![[thin space (1/6-em)]](https://www.rsc.org/images/entities/char_2009.gif) 333 reflections measured (10.32° ≤ 2θ ≤ 143.94°), 4176 unique (Rint = 0.0448) which were used in all calculations. The final R1 was 0.0421 (I > 2σ(I)) and wR2 was 0.1112 (all data). CCDC 1528331 contains the supplementary crystallographic data for 1. 333 reflections measured (10.32° ≤ 2θ ≤ 143.94°), 4176 unique (Rint = 0.0448) which were used in all calculations. The final R1 was 0.0421 (I > 2σ(I)) and wR2 was 0.1112 (all data). CCDC 1528331 contains the supplementary crystallographic data for 1. |
| ¶ Differences in oxidation potentials (ΔEox) were calculated as the mean average from a set of 8 separate electrochemical experiments (DPV) performed on the same sample solution. ± errors are the standard deviation from this mean (n = 8). |
| This journal is © The Royal Society of Chemistry 2017 |

