
Intermolecular interactions boost aggregation induced emission in carbazole Schiff base derivatives†
Xiaoping
Gan
ab,
Guangjin
Liu
a,
Mingjie
Chu
a,
Wengang
Xi
b,
Zili
Ren
a,
Xiuli
Zhang
a,
Yupeng
Tian
b and
Hongping
Zhou
 *b
*b
aDepartment of Applied Chemistry, School of Science, Anhui Agricultural University, 230036 Hefei, P. R. China
bCollege of Chemistry and Chemical Engineering, Anhui University and Key Laboratory of Functional Inorganic Materials Chemistry of Anhui Province, 230601, Hefei, P. R. China. E-mail: zhpzhp@263.net; Fax: +86-551-63861279; Tel: +86-551-63861279
First published on 21st November 2016
Abstract
Six D–π-A model compounds (compounds 1–6) were conveniently synthesized and characterized by 1H NMR, 13C NMR, MS and single crystal X-ray diffraction. One photon absorption and emission properties were studied by using a series of UV-visible and fluorescence spectra and theoretical calculations were applied to investigate the structure–property relationships, which showed that all six compounds possessed an obvious intramolecular charge transfer process which could be attributed to their optical properties. We simultaneously investigated their fluorescence emission performance in water/acetonitrile mixtures and found that they all have outstanding aggregation induced emission properties. Scanning electron microscopy testing illustrated that orderly aggregation was the main reason for their aggregation induced emission properties. Cytotoxicity tests indicated that all these compounds had good biocompatibility for living cells, and bio-imaging studies highlighted the potential application of the six compounds in one-photon fluorescence microscopy imaging domains.
1 Introduction
Organic molecules with a strong fluorescence emission ability are useful as sensitizers for dye-sensitized solar cells (DSSCs), emitters for organic light emitting diodes (OLEDs) and stains for bio-imaging in a variety of applications.1–3 An effective strategy to construct strong fluorescence emission organic molecules is to form special structure patterns which have the electron donating group (donor, D) linked to an electron accepting group (acceptor, A) by a π-bridge due to their strong absorption and emission properties originating from the intramolecular charge transfer (ICT) excitation from the donor to acceptor moiety of the dipole molecules. One of the noteworthy structural features of D–π-A molecules is that the electron density of the highest occupied molecular orbital (HOMO) is localized over the π-conjugated system close to the donor part, and that of the lowest unoccupied molecular orbital (LUMO) is localized over the acceptor part. Thus, the increase in the electron-donating abilities of donors and the electron-accepting abilities of acceptors, respectively, leads to enhancement of the ICT progress and decrease of the energy gap between the HOMO and LUMO, which could strengthen the fluorescence emission ability.4 Moreover, choosing a different π-bridge will also influence the molecular conformation and then adjust the electron distribution to suit the requirements for optoelectronic devices, luminescent materials and bio-imaging applications.5 For these reasons, a variety of such compounds which possessed the D–π-A model have been synthesized and described in the literature,6–8 including several stilbene derivatives. For example, Mark and co-workers reported that a series of highly fluorescent stilbene derivatives exhibit remarkable fluorescence properties.9 Nevertheless, many of the D–π-A model molecules only emitted strong fluorescence in a dilute solution but quenched the fluorescence in a high-concentration solution or in the solid state, which limited their application in biological domains such as bio-imaging in living cells, because the environment in living cells is water soluble, which may induce organic molecules aggregating to quench the fluorescence. Thereby, the concept of aggregation induced emission (AIE), which was proposed by Tang and co-workers,10 has been widely applied to develop the fluorescent biological stain. For instance, Neckers’ group synthesized a cyano-stilbene derivative replaced by bis-carbazole groups showed obviously aggregation induced enhance emission (AIEE) and successfully applied it to cell imaging.11 Our group also focused on the development of organic fluorescent molecules with AIE properties and synthesized a series of D–π-A model triphenylamine Schiff base derivatives,12 which have different optical properties in the aggregation state. We systematically studied their optical and physical properties and found that the multiple weak interactions especially for C–H⋯π interactions played a remarkable role in generating AIE performance in partial compounds, while some of these compounds showed aggregation caused quenching (ACQ) due to π⋯π stacking between the adjacent molecules. The results illustrated that different aromatic rings would produce different weak interactions, which generated a different influence on the luminescence performance in the aggregation state.Based on this, we utilized the carbazole ring instead of triphenylamine as the electron donor considering that the carbazole ring possessed better planarity than the latter, which could produce more weak interactions originating from the aromatic rings. Meanwhile, carbazole is an electron-rich aromatic heterocycle with a nitrogen atom having lone pair electrons which could act as the electron donor.13 Moreover, carbazole derivatives possess high thermal stability, easy functionalization and excellent photophysical properties, and have many potential applications in a variety of fields.14–16 In general, Schiff bases have strong coordination abilities with different coordination models, good biological activity and moderate electron withdrawing ability, so they are one of the effective candidates for the biological fluorescent probe. But pure Schiff bases possess a smaller conjugated system and lower intramolecular charge transfer efficiency, thus constructing a Schiff base derivative through an appropriate π-bridge linked electron donating group to extend its conjugate system is expected to have more applications as luminescent materials.17,18
Herein, we designed and synthesized a series of D–π-A structure carbazole Schiff base derivatives (Scheme 1) containing carbazole as an electron donating group and stilbene as a π-bridge, and simultaneously adjusted their ICT progress through changing the structure of Schiff base moieties. Then we researched their linear optical properties in solutions and in the aggregation state through one photon absorption spectra (OPA) and one photon emission fluorescence spectra (OPEF); the results showed that all six compounds possessed AIE performance, but only compounds 1 and 6 possessed obvious fluorescence emission ability in solution, which illustrated that the change of Schiff base structure had a significant influence on their luminescence ability. Furthermore, we discussed their structure–property relationship using crystal structure data and theoretical calculations, which revealed that the conformation of the molecules affected their emission properties even more. Meanwhile, the existence of multiple weak interactions had an important impact on their optical properties in the aggregation state. Finally, as expected, all six compounds had excellent living cell imaging abilities due to their good biocompatibility and suitable AIE properties. So we successfully explored the application of the six compounds in bio-imaging.
 | ||
| Scheme 1 Synthetic routes to compounds 1–6. | ||
2 Results and discussion
2.1 Synthesis
Six compounds were prepared according to the synthetic routes shown in Scheme 1. The experimental details and structure characterization data are described in the Experimental section and ESI.†2.2 Crystal structures
To investigate the structure–property relationship of the synthesized compounds, we elucidated the molecule structure in the solid state. Fortunately, the single crystals of compounds 1, 2, 3, 5 and 6 were obtained by slow evaporation from a dichloromethane and ethanol mixture solution. Their molecular structure diagrams with atom numbering scheme and stacking structures involved some weak interactions among the adjacent molecules that are depicted in Fig. 1–3. The crystallographic data are summarized in Table S1.† From Fig. 1a, we could see that compound 1 maintained good planarity at the styrene π-bridge with a dihedral angle (θ2) between the plane (P1) that consisted of C13, C14, C15, C16, C17, C18, C19 and the plane (P2) of C21, C22, C23, C24, C25, C26 was 10.186(98)°, the bond length of the π-bridge in compound 1, including C16–C19, C19![[double bond, length as m-dash]](https://www.rsc.org/images/entities/char_e001.gif) C20 and C20–C21, was 1.474(4) Å, 1.324(5) Å and 1.470(4) Å, respectively, which meant that there existed a good delocalization system in a section of these compounds. Whereas the dihedral angle (θ1) between the carbazole plane and the plane P1 was 62.274(74)°, and the dihedral angle (θ3) between the terminal pyridine ring (P3) and the plane P2 was 52.885(101)°, which indicated that the donor (carbazole ring) and the acceptor (pyridine Schiff base moieties) deviated the plane of the styrene, resulting in a poor planarity in the whole molecule. Why were the donor and acceptor not coplanar with the styrene π-bridge? One reason for the structure feature was that the existence of the intramolecular hydrogen bond (C30–H30⋯N2, d = 2.463 Å, ∠C30–H30–N2 = 100.786(394)°) restricted the rotation of the pyridine ring around the carbon–carbon single bond (C28–C29). Another reason could be seen from the stacking structures shown in Fig. 1b. We could see that the intermolecular interactions including a rare but reasonable H⋯H interaction19–21 (H11⋯H32, d = 2.354(53) Å, in which H11 is located at the electron-rich carbazole ring having a high electron cloud density and H32 is located at the electron-poor pyridine ring having a low electron cloud density) and C–H⋯π weak interaction (C22–H22⋯π, d = 2.201(23) Å) played a significant role in the growth of 1D chains along the a-axis, especially for the H⋯H interactions, which not only connected two adjacent molecules into a dimer adopting J-aggregation with a head to tail model, but also restricted the rotations of the two terminal aromatic rings around the single bond. We also cautiously calculated the H⋯H interaction's energy through theoretical calculations based on the crystal structure and the result was 28 kJ mol−1, which was located in the normal range of the weak interactions22–25 and further illustrated the rationality of its existence. As a result, the whole molecule had a non-planar conformation and prevented the formation of π⋯π stacking. Then the 2D layer structure formed through C–H⋯π weak interactions (C2–H2⋯π, d = 2.702(38) Å), which were generated from the C–H of the carbazole ring with another carbazole ring in the adjacent molecule (Fig. 1c). All the results illustrated that the carbazole unit had an important control function on the molecular stacking structure.
C20 and C20–C21, was 1.474(4) Å, 1.324(5) Å and 1.470(4) Å, respectively, which meant that there existed a good delocalization system in a section of these compounds. Whereas the dihedral angle (θ1) between the carbazole plane and the plane P1 was 62.274(74)°, and the dihedral angle (θ3) between the terminal pyridine ring (P3) and the plane P2 was 52.885(101)°, which indicated that the donor (carbazole ring) and the acceptor (pyridine Schiff base moieties) deviated the plane of the styrene, resulting in a poor planarity in the whole molecule. Why were the donor and acceptor not coplanar with the styrene π-bridge? One reason for the structure feature was that the existence of the intramolecular hydrogen bond (C30–H30⋯N2, d = 2.463 Å, ∠C30–H30–N2 = 100.786(394)°) restricted the rotation of the pyridine ring around the carbon–carbon single bond (C28–C29). Another reason could be seen from the stacking structures shown in Fig. 1b. We could see that the intermolecular interactions including a rare but reasonable H⋯H interaction19–21 (H11⋯H32, d = 2.354(53) Å, in which H11 is located at the electron-rich carbazole ring having a high electron cloud density and H32 is located at the electron-poor pyridine ring having a low electron cloud density) and C–H⋯π weak interaction (C22–H22⋯π, d = 2.201(23) Å) played a significant role in the growth of 1D chains along the a-axis, especially for the H⋯H interactions, which not only connected two adjacent molecules into a dimer adopting J-aggregation with a head to tail model, but also restricted the rotations of the two terminal aromatic rings around the single bond. We also cautiously calculated the H⋯H interaction's energy through theoretical calculations based on the crystal structure and the result was 28 kJ mol−1, which was located in the normal range of the weak interactions22–25 and further illustrated the rationality of its existence. As a result, the whole molecule had a non-planar conformation and prevented the formation of π⋯π stacking. Then the 2D layer structure formed through C–H⋯π weak interactions (C2–H2⋯π, d = 2.702(38) Å), which were generated from the C–H of the carbazole ring with another carbazole ring in the adjacent molecule (Fig. 1c). All the results illustrated that the carbazole unit had an important control function on the molecular stacking structure.
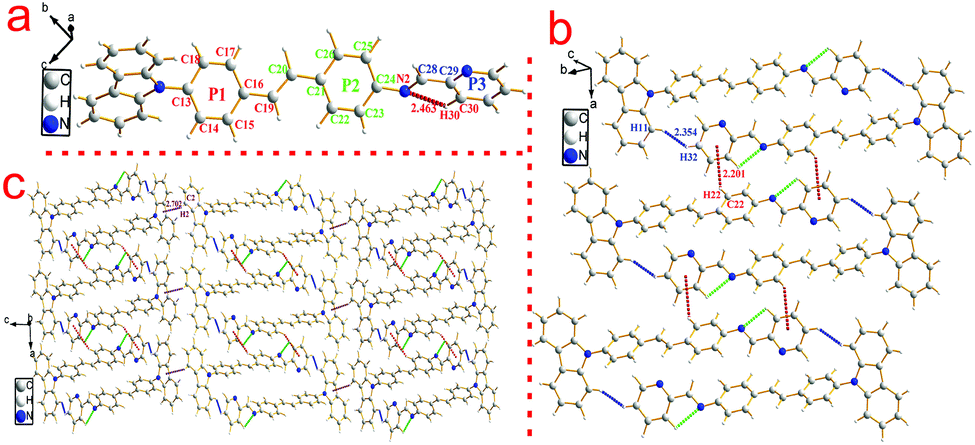 | ||
| Fig. 1 Crystal structure of compound 1: (a) single molecule, (b) 1D chain structure and (c) 2D layer structure. | ||
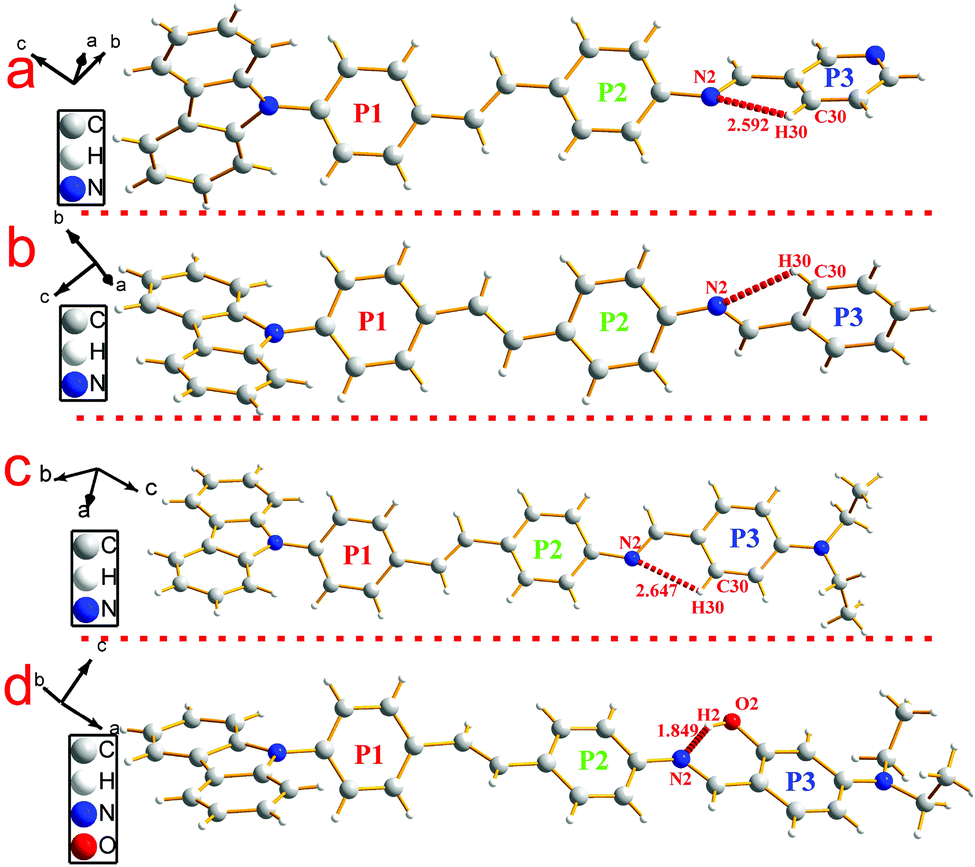 | ||
| Fig. 2 Single molecule structures of compounds 2 (a), 3 (b), 5 (c) and 6 (d). | ||
 | ||
| Fig. 3 2D chain structures of compounds 2 (a), 3 (b), 5 (c) and 6 (d). | ||
Similar to compound 1, compounds 2 and 3 possessed a uniform molecule configuration. The dihedral angle (θ1) was 13.270(139)° for compound 2, 8.006(129)° for compound 3, the dihedral angle (θ2) was 58.199(104)° for compound 2, 59.134(108)° for compound 3, and the dihedral angle(θ3) was 39.404(182)° for compound 2, 36.185(159)° for compound 3, respectively.
Different from compounds 1, 2 and 3, compounds 5 and 6 have a distinct molecule configuration which is shown in Fig. 2. We could see that the styrene sections in compounds 5 and 6 were non-planar with a large dihedral angle (θ1) of 29.396(201)° and 32.399(142)°, respectively. While the dihedral angle (θ3) (0.618(222)° for compound 5 and 11.644(110)° for compound 6) was smaller than that in compounds 1, 2 and 3, which illustrated that the Schiff base moieties maintained good planarity with the plane of P2. The result stated that different acceptors had an outstanding influence on the molecular configuration, especially for the molecule planarity. The stacking structures of compounds 2, 3, 5 and 6 are illustrated in Fig. 3. We could see that they were all different from compound 1 in that there was non-existence of strong H⋯H interactions which could connect two adjacent molecules to a dimer. The absence of H⋯H interactions resulted in the free rotation of the terminal groups in these molecules.
2.3 One-photon absorption and emission properties
The one photon absorption and fluorescence emission spectra of compound 1 in six solvents of varying polarities are depicted in Fig. 4. The absorption spectra of the other five compounds (2–6) are depicted in Fig. S2–S6.† It could be seen from Fig. 4a that compound 1 had two absorption peaks located at ∼280 nm and ∼360 nm, the former was assigned to the π–π* electronic transitions caused by the carbazole core26 whereas the latter is likely ascribed to intramolecular charge transfer between the carbazole ring and the terminal Schiff base group. From Fig. S2–S6,† it could be seen that the other five compounds had similar features in absorption spectra. | ||
| Fig. 4 One photon absorption (a) and fluorescence (b) spectra of compound 1 in six organic solvents of different polarities with a concentration of 1 × 10⁻⁵ mol L−1. | ||
The fluorescence spectra showed obvious differences from compound 1 to 6. It could be seen from Fig. 4b and S2b–S6b† that only compounds 1 and 6 emitted a strong fluorescence while the other four compounds (2–5) showed noisy PL signals without discernable peaks under the same measurement conditions. The emission peak of compound 1 in different polarity solvents located at about 430 nm, which could be assigned to the ICT emission.27 While compound 6 emitted two fluorescence peaks located at ∼500 nm and ∼530 nm in different polarity solvents, which could be assigned to the ICT emission and excited state intramolecular proton transfer (ESIPT) emission,28 respectively. The result stated that fine adjustment of the acceptor moieties could control the fluorescence emission in the compound series. To further investigate the influence of different electron acceptors on charge transfer of the six compounds, time-dependent density functional theory (TDDFT) was carried out to investigate the electron cloud density distribution of the ground and excited states. The Gaussian 03 program and B3LYP/6-31G basis sets were used for calculations; the isosurfaces of the highest occupied and the lowest unoccupied molecular orbital (HOMO and LUMO) are shown in Fig. 5. It could be seen that all six compounds produced ICT progress upon photoexcitation, the HOMO and LUMO of compounds 1–4 were obviously dominated by the orbitals from the donor (carbazole ring) and the acceptor (Schiff base moieties), respectively, while those of compounds 5 and 6 were inconspicuous due to the decrease of the electron-withdrawing ability of the acceptor caused by the introduction of the diethylamino group. The calculation results illustrated the existence of the ICT progress and were in accord with the absorption spectra, but could not explain why compounds 2, 3, 4 and 5 were nonluminous in solution and compounds 1 and 6 were luminous. Hence, we tried to explain the difference in their fluorescence emission abilities from the molecular configuration calculated from the crystal structure and found that the carbazole ring deviated the plane of the styrene obviously in compounds 1, 2, 3, 5 and 6 with a dihedral angle of 62.274(24), 58.199(104), 59.134(108), 63.418(156) and 65.784(130) and the Schiff base moieties in compounds 1, 2 and 3 deviated the plane of the styrene with a dihedral angle of 52.885(101), 39.404(182), and 36.185(159), respectively, which showed that the carbazole ring and the Schiff base moieties were not conjugated with the styrene well and could rotate freely. The rotation of aromatic rings could consume energy which resulted in fluorescence quenching. While in compound 1, the existence of the H⋯H interactions could connect two adjacent molecules into a dimer which adopted J-aggregation and restricted the rotations of the two terminal aromatic rings around the single bond. The same situations in the other compounds were not observed, which could explain why compound 1 could emit fluorescence in solution. Whereas for compound 6, the carbazole ring contributed less to the energy levels and the electron densities were mainly located on the styrene, the existence of ESIPT could also explain the emission peak at long wavelengths, thus compound 6 could emit fluorescence in solution.
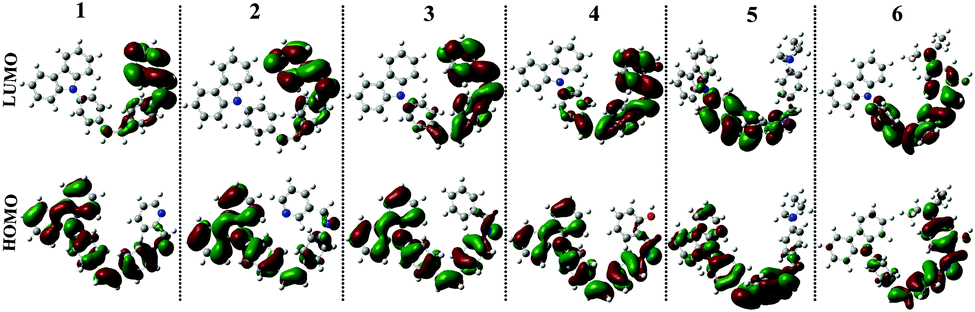 | ||
| Fig. 5 Electron cloud distributions of compounds 1–6 calculated using the B3LYP/6-31G program. | ||
2.4 Aggregation-induced emissions
As the six compounds are non-luminous or weakly luminous in solution and they are all insoluble in water but soluble in organic solvents such as acetonitrile, we determined the absorption and emission spectra of the diluted solutions or suspensions of compounds 1–6 in acetonitrile–water mixtures with different water fractions (fw, the volume percentage of water in organic–water mixtures) that can adjust the solvent polarity subtly. This is revealed by the images in Fig. 6, 7 and S7–S10.† As all six compounds possess similar absorption and fluorescence emission properties in acetonitrile–water mixture solutions, we just used compound 1 as an example to discuss in detail. | ||
| Fig. 6 Absorption (a) and fluorescence (b) spectra of compound 1 in water/acetonitrile mixtures with different fw at 2.0 × 10⁻⁵ M. | ||
 | ||
| Fig. 7 Absorption (a) and fluorescence (b) spectra of compound 6 in water/acetonitrile mixtures with different fw at 2.0 × 10⁻⁵ M. | ||
The absorption spectrum of compound 1 (20 μM) has been recorded and is shown in Fig. 6a. We can see that compound 1 shows two absorption peaks in dilute acetonitrile solution which are located at ∼293 nm and ∼350 nm. Meanwhile, the spectra of the mixtures with high fw (≥70%) values start to show level-off tails in the long wavelength region caused by the Mie scattering effect, which suggested the formation of nanoaggregates.29 As can be seen from Fig. 7 and S7–S9,† the other five compounds also showed similar characteristics of the absorption spectrum as compound 1 in the aggregation state.
The fluorescence spectrum of compound 1 (20 μM) in the water–acetonitrile mixtures with different water contents is shown in Fig. 6b, which showed obvious AIE properties; the fluorescence intensity primarily increased with the increase of fw when fw ≤ 50%, and the highest fluorescence intensity at fw = 50% was about 17.5-fold higher than that in the pure acetonitrile solution. Then it decreased with the increase of fw when fw > 50%. The inset depicts the changes in integrated intensity for different water fractions. The fluorescence spectra (Fig. S7–S9†) of compounds 2, 3 and 5 (20 μM) in the water–acetonitrile mixtures were similar to those of compound 1; their fluorescence maxima were reached at fw = 50%, 30%, 20%, respectively.
The fluorescence spectra of compounds 4 and 6 (20 μM) in water–acetonitrile mixtures with different water contents showed different features than those of compounds 1, 2, 3 and 5 which are depicted in Fig. 7b and S9b.† It could be seen from Fig. 7b that the two emission peaks of compound 6 changed with the increase of the water fractions; the high energy emission peak located at 425 nm which was attributed to the ICT emission gradually increased with the increase of water content when fw ≤ 50%, and then decreased with the increase of water content when fw ≥ 50%, while the low energy emission peak located at 510 nm which was attributed to the ESIPT emission increased with the increase of water content and reached its maxima at fw = 70%, and then decreased gradually with the increase of water fraction. Meanwhile, the latter split into two peaks little by little. The result showed that both the emission peaks which were generated from different energy levels could be affected by the aggregation progress, while the ESIPT emission was stronger than the ICT emission at high water content perhaps due to the fact that more the water molecules in solution, the easier the ESIPT progress generated. Compound 4 also showed similar characteristics of the fluorescence emission spectrum as compounds 6 in the aggregation state.
2.5 Mechanisms of AIE
To gain further insight into the influence of morphology on AIE properties, we also carried out scanning electron microscope (SEM) tests for compounds 1–6 at different water fractions. The SEM images of compounds 1–6 are depicted in Fig. 8; we could see that the aggregates were formed as cubic nanoparticles in the mixture solution of compounds 1–3 and as clubbed nanoparticles in the mixture solution of compounds 4–6 when they reached their fluorescence maxima, respectively, while unordered aggregates appeared in the mixture at fw = 90%. | ||
| Fig. 8 SEM images of compounds 1–6 (20 μM) in acetonitrile/water mixtures with different water fractions: (a) 1 in acetonitrile/water (50/50 v/v); (b) 2 in acetonitrile/water (50/50 v/v); (c) 3 in acetonitrile/water (70/30 v/v); (g) 4 in acetonitrile/water (70/30 v/v); (h) 5 in acetonitrile/water (80/20 v/v); (i) 6 in acetonitrile/water (30/70 v/v); (d, e, f, j, k, l) compounds 1–6, respectively, in acetonitrile/water (10/90 v/v). | ||
The results illustrated that ordered aggregation had an important influence on the emission in aggregates. The reason may be that the weak intermolecular interactions could work efficiently under ordered aggregation conditions, while under disorderly aggregation conditions, some weak interactions such as C–H⋯π and H⋯H interactions could not work effectively due to the aperiodic orientation of molecules. From the theoretical calculations, we could see that compounds 1–4 have ICT progress which was generated from the donor (carbazole ring) to the acceptor (Schiff base moieties) through a π-bridge (styrene), while that in compound 5 was from carbazole to styrene and that in compound 6 was from Schiff base moieties to styrene, respectively. The result illustrated that the carbazole ring and Schiff base moieties hold an important contribution to the energy level of the molecular orbital, whereas in the crystal structure, multiple intermolecular interactions, especially C–H⋯π interactions generated from the carbazole ring, restricted the rotation of terminal groups including the carbazole ring and Schiff base moieties; thereby all six compounds possessed AIE performance in the aggregation state. In one word, the existence of C–H⋯π interactions generated from carbazole rings, which was a common structure in all six compounds, played a significant role in producing AIE properties. These findings could provide a reference to design new AIE compounds.
2.6 Cytotoxicity tests
Cytotoxicity is a potential side effect of compounds that must be controlled when dealing with living cells or tissues.Considering their application in cell imaging, the MTT assay30,31 was performed to ascertain the cytotoxic effect of compounds 1–6 against HeLa cells over a period of 24 h. Fig. S11† shows the cell viability for HeLa cells treated with compounds 1–6 at different concentrations. The results clearly indicated that no obvious cell viability decrease occurred; even when the concentrations of the compounds reached up to 20 μM, the cell viability was still greater than 80%. The low cytotoxicity of the target compounds over a period of at least 24 h indicated that it was suitable for cellular imaging applications. This is an important factor in further potential live cell imaging applications due to their relatively low cytotoxicity.
2.7 Bio-imaging
To explore the applications of the six AIE compounds, the bio-imaging experiments were carried out by confocal laser scanning microscopy using HepG2 (human liver cancer cells) as an example; the tested compounds were dissolved in DMSO and then serially diluted in complete culture medium. Then we carried out bio-imaging studies in living HepG2 cells stained with compounds 1–6 by one photon microscopy. The excitation wavelength was fixed at their optimal excitation wavelength in one-photon microscopy imaging, respectively. As shown in Fig. 9, bright green fluorescence with a similar intensity from the cells indicated that all the six compounds could be effectively internalized by HepG2 cells. The six compounds all went through the membrane and localized uniformly in the cytoplasm, which suggested that only the cell cytoplasm could be labelled by these compounds. | ||
| Fig. 9 One-photon fluorescence microscopy images of HepG2 cells with compounds 1–6: (a) dark-field images, (b) bright-field images, and (c) merged images. | ||
3 Conclusions
In this work, we reported a series of carbazole Schiff base dipole molecules to realize AIE performance through the restriction of terminal groups which was caused by the multiple weak interactions generated from the carbazole ring and Schiff base moieties. The existence of the H⋯H interactions and C–H⋯π interactions played a significant role in their luminescence properties in solution and/or in the aggregation state, especially for the dihydrogen bonds, which not only contributed to the fluorescence emission of compound 1 in pure acetonitrile solution, but also in favor of AIE. The structure–property relationship was summarized clearly and all the results showed that the carbazole ring could generate multiple weak interactions effectively, which could provide a reference for designing new AIE compounds.4 Experimental section
4.1 General procedures
All commercially available chemicals were of analytical grade. Every solvent was purified using conventional methods beforehand. 1H and 13C NMR spectra were recorded on a Bruker AV 400 Ultrashield spectrometer using dimethylsulfoxide-d6 (DMSO-d6) or CD3COCD3 as solvents. Chemical shifts were reported in parts per million (ppm) relative to internal TMS (0 ppm) and coupling constants in Hz. Splitting patterns were described as singlet (s), doublet (d), triplet (t), quartet (q), or multiplet (m). IR spectra were recorded with a Nicolet FT-IR S10 spectrometer (ATR model) in the 4000–525 cm−1 region. Melting points (uncorrected) were determined using an XT4 MP apparatus (Taike Corp., Beijing, China). The mass spectra were obtained using an LTQ-Orbitrap XL mass spectrometer. The X-ray diffraction measurements were performed on a CCD area detector using graphite monochromated MoKα radiation (λ = 0.71069 Å) at 298(2) K. Intensity data were collected in the variable ω/2θ-scan mode. The structures were solved by direct methods and difference Fourier syntheses. The non-hydrogen atoms were refined anisotropically and hydrogen atoms were introduced geometrically. Calculations were performed using the SHELXTL-97 program package. Crystallographic data of the structures reported in this paper have been deposited with the Cambridge Crystallographic Data Centre as supplementary publication no. CCDC 1040856 (for 1), 1487391 (for 2), 1040859 (for 3), 1040861 (for 5) and 1040862 (for 6), respectively.4.2 Optical measurements
The one-photon absorption (OPA) spectra were recorded using a UV-3600 spectrophotometer. The one-photon emission fluorescence (OPEF) spectra were recorded using a Hitachi F-7000 fluorescence spectrophotometer. In the measurements of emission and excitation spectra, the pass width was 10 nm for all compounds. OPA and OPEF of compounds 1–6 were measured in six organic solvents with different polarities at the concentration of 2 × 10⁻⁵ mol L−1. The quartz cuvettes used were of 1 cm path length.4.3 Cytotoxicity assays in cells
To ascertain the cytotoxic effect of the six compounds, the 3-(4,5-dimethylthiazol-2-yl)-2,5-diphenyltetrazolium bromide (MTT) assay was performed. HepG2 cells were trypsinized and plated to ∼70% confluence in 96-well plates 24 h before treatment. Prior to the compounds’ treatment, Dulbecco's modified Eagle medium (DMEM) was removed and replaced with fresh DMEM, and aliquots of the compound stock solutions (1 mM DMSO) were added to obtain the final concentrations of 5, 10, 20, 40 and 60 mM. The treated cells were incubated for 24 h at 37 °C and under 5% CO2. Subsequently, the cells were treated with 5 mg mL−1 MTT (40 μL per well) and incubated for an additional 4 h (37 °C, 5% CO2). Then, DMEM was removed, the formazan crystals were dissolved in DMSO (150 μL per well), and the absorbance at 570 nm was recorded. The cell viability (%) was calculated according to the following equation:| Cell viability% = OD570 (sample)/OD570 (control) × 100 |
4.4 Cell imaging
HepG2 cells were seeded and grown in 6 well plates at a density of 2 × 10⁵ cells per well for 96 h. For live cell imaging, cell cultures were incubated with the complexes (PBS![[thin space (1/6-em)]](https://www.rsc.org/images/entities/char_2009.gif) :cell media = 1:9) at a concentration of 20 μM and maintained at 37 °C under an atmosphere of 5% CO2 and 95% air for incubation times with 2 h. Then the cells were washed with PBS (3 × 3 mL per well) and 3 mL of PBS was added to each cell. The cells were imaged using confocal laser scanning microscopy and water immersion lenses, and then the fluorescence emission was measured at 520–560 nm with optimal excitation energy.
:cell media = 1:9) at a concentration of 20 μM and maintained at 37 °C under an atmosphere of 5% CO2 and 95% air for incubation times with 2 h. Then the cells were washed with PBS (3 × 3 mL per well) and 3 mL of PBS was added to each cell. The cells were imaged using confocal laser scanning microscopy and water immersion lenses, and then the fluorescence emission was measured at 520–560 nm with optimal excitation energy.
4.5 Synthesis and characterization
Compound 1, 4-((E)-4-(9H-carbazol-9-yl)styryl)-N-(pyridin-2-ylmethylene)aniline, yellow powder, 0.41 g, yield: 59%, melting point: 206.5–207.4 °C. FT-IR (ATR, cm−1): 1595.48 (w), 1515.26 (m), 1479.07 (w), 1451.52 (s), 1435.11 (m), 1365.23 (m), 1335.10 (m), 1316.28 (m), 1230.84 (s), 1184.19 (w), 950.82 (w), 832.65 (m), 746.57 (s), 723.20 (s), 623.81 (m). 1H NMR (400 MHz, DMSO-d6, δ): 8.75–8.74 (1 H, d, J = 4.0), 8.68 (1 H, s), 8.27–8.26 (2 H, d, J = 4.0), 8.20–8.18 (1 H, d, J = 8.0), 8.00–7.96 (1 H, t, J = 8.0, 8.0), 7.94–7.91 (2 H, d, J = 12.0), 7.77–7.75 (2 H, d, J = 8.0), 7.67–7.65 (2 H, d, J = 8.0), 7.56–7.54 (1 H, m), 7.45–7.43 (8 H, m), 7.32–7.29 (2 H, m). 13C NMR (100 MHz, DMSO-d6, δ): 160.33, 154.06, 149.72, 139.98, 137.07, 135.94, 135.76, 127.62, 127.52, 126.81, 126.27, 125.65, 121.84, 121.23, 120.53, 120.10, 113.83, 109.70. MS (ESI) m/z: found, [M + H]+, 450.1981; molecular formula C32H23N3 requires [M + H]+, 450.1971.
Compound 2, 4-((E)-4-(9H-carbazol-9-yl)styryl)-N-(pyridin-3-ylmethylene)aniline, yellow powder, 0.46 g, yield: 74%, melting point: 186.1–187.2 °C. FT-IR (ATR, cm−1): 1625.21 (w), 1595.16 (w), 1514.53 (m), 1478.98 (m), 1451.01 (s), 1335.15 (m), 1316.23 (m), 1231.16 (m), 1183.27 (m), 1119.07 (m), 1016.23 (m), 991.81 (m), 833.42 (m), 747.91 (s), 722.00 (s). 1H NMR (400 MHz, DMSO-d6, δ): 9.09 (1 H, s), 8.81 (1 H, s), 8.73–8.72 (1 H, d, J = 4.0), 8.36–8.34 (1 H, d, J = 8.0), 8.28–8.26 (2 H, d, J = 8.0), 7.93–7.91 (2 H, d, J = 8.0), 7.77–7.75 (2 H, d, J = 8.0), 7.65–7.63 (2 H, d, J = 8.0), 7.56–7.53 (1 H, m), 7.45–7.39 (8 H, m), 7.31–7.29 (2 H, m). 13C NMR (100 MHz, DMSO-d6, δ): 158.13, 154.57, 151.94, 150.45, 139.98, 136.37, 135.91, 135.41, 134.96, 131.58, 128.01, 127.36, 126.27, 124.08, 122.74, 121.74, 120.53, 120.10, 113.93, 109.70. MS (ESI) m/z: found, [M + H]+, 450.1987; molecular formula C32H23N3 requires [M + H]+, 450.1971.
Compound 3, 4-((E)-4-(9H-carbazol-9-yl)styryl)-N-benzylideneaniline, deep yellow powder, 0.40 g, yield: 64%, melting point: 233.3–234.6 °C. FT-IR (ATR, cm−1): 1594.96 (m), 1512.72 (m), 1478.12 (w), 1449.34 (s), 1408.15 (w), 1334.77 (w), 1315.75 (m), 1227.11 (s), 1102.84 (w), 961.86 (m), 839.33 (s), 748.65 (s), 723.67 (s). 1H NMR (400 MHz, DMSO-d6, δ): 8.71 (1 H, s), 8.27–8.25 (2 H, d, J = 8.0), 8.03–7.87 (4 H, m), 7.81–7.21 (17 H, m). 13C NMR (100 MHz, DMSO-d6, δ): 160.38, 150.76, 140.05, 128.91, 128.68, 128.69, 128.05, 127.69, 127.17, 126.83, 126.27, 122.91, 121.67, 120.57, 120.06, 109.71. MS (APCI) m/z: found, [M + H]−, 449.2031; molecular formula C32H23N3 requires [M + H]−, 449.2018.
Compound 4, 2-(((4-((E)-4-(9H-carbazol-9-yl)styryl)phenyl)imino)methyl)phenol, yellow powder, 0.43 g, yield: 67%, melting point: 251.2–252.2 °C. FT-IR (ATR, cm−1): 3023.25 (w), 1594.96 (m), 1512.72 (m), 1478.12 (m), 1449.34 (s), 1334.77 (m), 1227.11 (m), 1183.33 (w), 961.86 (m), 839.33 (s), 748.65 (s), 723.67 (s). (0.43 g, yield: 66.7%): 1H NMR (400 MHz, DMSO-d6, δ): 13.13 (1H, s), 9.04 (1H, s), 8.27–8.25 (2H, d, J = 8.0), 7.93–7.91 (2H, d, J = 8.0), 7.79–7.77 (2H, d, J = 8.0), 7.69–7.66 (3H, dd, J = 12.0), 7.55–7.37 (9H, m), 7.41–7.30 (2H, m), 7.00–6.98 (2H, m). 13C NMR (100 MHz, DMSO-d6, δ): 163.45, 160.82, 156.94, 147.76, 140.52, 132.97, 130.54, 129.10, 128.61, 128.21, 127.25, 126.69, 123.23, 122.40, 121.06, 120.59, 119.95, 119.61, 117.09, 110.11. MS (ESI) m/z: found, [M + H]+, 465.1980; molecular formula C33H24N2O requires [M + H]+, 465.1968.
Compound 5, 4-(((4-((E)-4-(9H-carbazol-9-yl)styryl)phenyl)imino)methyl)-N,N-diethylaniline, yellow powder, 0.50 g, yield: 69%, melting point: 209.1–211.4 °C. FT-IR (ATR, cm−1): 3023.25 (w), 1616.36 (m), 1596.10 (m), 1514.46 (m), 1450.03 (s), 1359.65 (m), 1334.89 (m), 1279.58 (m), 1226.06 (m), 1170.21 (m), 1152.14 (m), 964.96 (m), 835.66 (m), 746.93 (s), 721.95 (s). 1H NMR (400 MHz, DMSO-d6, δ): 8.45 (1 H, s), 8.27–8.25 (2 H, d, J = 8.0), 7.91–7.89 (2 H, d, J = 8.0), 7.75–7.73 (2 H, d, J = 8.0), 7.69–7.63 (4 H, dd, J = 8.0, 8.0), 7.74–7.24 (10 H, m), 6.77–6.75 (2 H, d, J = 8.0), 3.46–3.41 (4 H, m), 1.16–1.13 (6 H, t, J = 8.0). 13C NMR (100 MHz, CD3COCD3, δ): 159.31, 131.33, 130.21, 129.65, 128.24, 127.87, 127.23, 126.83, 126.23, 121.62, 114.58, 110.81, 110.11, 44.19, 11.65. MS (ESI) m/z: found, [M + H]+, 520.2767; molecular formula C37H33N3 requires [M + H]+, 520.2753.
Compound 6, 2-(((4-((E)-4-(9H-carbazol-9-yl)styryl)phenyl)imino)methyl)-5-(diethylamino)phenol, yellowish-brown powder, 0.52 g, yield: 70%, melting point: 243.5–246.0 °C. FT-IR (ATR, cm−1): 2970.10 (w), 1573.78 (m), 1548.20 (m), 1515.57 (s), 1479.27 (m), 1450.34 (s), 1358.36 (m), 1314.66 (m), 1266.93 (m), 1231.03 (m), 1149.36 (m), 962.88 (m), 835.54 (m), 817.36 (m), 748.64 (s), 722.825 (s). (0.52 g, yield: 70.0%): 1H NMR (400 MHz, DMSO-d6, δ): 13.70 (1 H, s), 8.77 (1 H, s), 8.27–8.25 (2 H, d, J = 8.0), 7.92–7.90 (2 H, d, J = 8.0), 7.70–7.68 (2 H, d, J = 8.0), 7.66–7.64 (2 H, d, J = 8.0), 7.45–7.31 (11 H, m), 6.35–6.33 (1 H, d, J = 8.0), 6.08 (1 H, s), 3.44–3.38 (4 H, m), 1.15–1.12 (6 H, t, J = 6.0). 13C NMR (100 MHz, CD3COCD3, δ): 161.52, 141.43, 134.99, 134.30, 129.11, 127.98, 127.78, 127.45, 126.88, 126.10, 120.60, 109.68, 103.74, 97.63, 44.32, 12.10. MS (APCI) m/z: found, [M + H]+, 536.2712; molecular formula C37H33N3O requires [M + H]+, 536.2703.
Acknowledgements
This work was supported by the General Program of National Natural Science Foundation of China (21271003, 21271004, 51432001 and 51472002), the Science and Technology Plan of Anhui Province (1604b0602016), the National Science and Technology Support Project (2014BAK09B00), the Natural Science Foundation of Anhui Province (1608085MB26), the Natural Science Foundation of Education Committee of Anhui Province (KJ2016A218) and the Youth Fund of Anhui Agriculture University (2015ZD08).Notes and references
- J. Zhou, Q. Liu, W. Feng, Y. Sun and F. Li, Chem. Rev., 2014, 115, 395–465 CrossRef PubMed.
- K. Brunner, A. Van Dijken, H. Börner, J. Bastiaansen, N. Kiggen and B. Langeveld, J. Am. Chem. Soc., 2004, 126, 6035–6042 CrossRef CAS PubMed.
- G. Qian, Z. Zhong, M. Luo, D. Yu, Z. Zhang, Z. Wang and D. Ma, Adv. Mater., 2009, 21, 111–116 CrossRef CAS.
- Y. Ooyama, G. Ito, K. Kushimoto, K. Komaguchi, I. Imae and Y. Harima, Org. Biomol. Chem., 2010, 8, 2756–2770 CAS.
- P. Ledwon, W. Kuznik, M. Lapkowski and M. Majchrzak, New J. Chem., 2012, 36, 2347–2352 RSC.
- C. Qin, M. Zhou, W. Zhang, X. Wang and G. Chen, Dyes Pigm., 2008, 77, 678–685 CrossRef CAS.
- G. He, L. Yuan, Y. Cui, M. Li and P. Prasad, J. Appl. Phys., 1997, 81, 2529–2537 CrossRef CAS.
- D. Cvejn, S. Achelle, O. Pytela, J. Malval, A. Spangenberg, N. Cabon and F. Robin-Le Guen, Dyes Pigm., 2016, 124, 101–109 CrossRef CAS.
- M. Sigalov, A. Ben-Asuly, L. Shapiro, A. Ellern and V. Khodorkovsky, Tetrahedron Lett., 2000, 41, 8573–8576 CrossRef CAS.
- (a) Y. Hong, J. Lam and B. Tang, Chem. Commun., 2009, 29, 4332–4353 RSC; (b) Y. Hong, J. Lam and B. Tang, Chem. Soc. Rev., 2011, 40, 5361–5388 RSC.
- K. Upamali, L. Estrada, P. De, X. Cai, J. Krause and D. Neckers, Langmuir, 2011, 27, 1573–1580 CrossRef CAS PubMed.
- M. D. Yang, D. L. Xu, W. G. Xi, L. Wang, J. Zheng, J. Huang and Y. P. Tian, J. Org. Chem., 2013, 78, 10344–10359 CrossRef CAS PubMed.
- L. Yang, W. J. Zhu, M. Fang, Q. Zhang and C. Li, Spectrochim. Acta, Part A, 2013, 109, 186–192 CrossRef CAS PubMed.
- S. Kim, S. Byeon, S. Hwang and J. Lee, Chem. Commun., 2015, 51, 10672–10675 RSC.
- P. Xue, J. Sun, P. Chen, P. Wang, B. Yao, P. Gong and R. Lu, Chem. Commun., 2015, 51, 10381–10384 RSC.
- H. Wang, Q. Zhang, J. Zhang, L. Li, Q. Zhang, S. Li, S. Zhang, J. Wu and Y. Tian, Dyes Pigm., 2014, 102, 263–272 CrossRef CAS.
- Y. Li, Q. Guo, Z. Li, J. Pei and W. Tian, Energy Environ. Sci., 2010, 10, 1427–1436 Search PubMed.
- X. Lou, Z. Zhao, Y. Hong, C. Dong, X. Min, Y. Zhuang and B. Tang, Nanoscale, 2014, 6, 14691–14696 RSC.
- P. Popelier, J. Phys. Chem. A, 1998, 102, 1873–1878 CrossRef CAS.
- D. A. Safin, M. G. Babashkina, K. Robeyns, M. P. Mitoraj, P. Kubisiak and Y. Garcia, Chem. – Eur. J., 2015, 21, 16679–16687 CrossRef CAS PubMed.
- W. T. Klooster, T. F. Koetzle, P. E. M. Siegbahn, T. B. Richardson and R. H. Crabtree, J. Am. Chem. Soc., 1999, 27, 6337–6343 CrossRef.
- P. Lipkowski, S. Grabowski, T. Robinson and J. Leszczynski, J. Phys. Chem. A, 2004, 108, 10865–10872 CrossRef CAS.
- V. Bakhmutov, Dihydrogen bond: principles, experiments, and applications, John Wiley & Sons, 2008 Search PubMed.
- R. Crabtree, Science, 1998, 282, 2000–2001 CrossRef CAS.
- S. Grabowski, Chem. Phys. Lett., 2000, 327, 203–208 CrossRef CAS.
- Z. Zheng, H. P. Zhou, G. Y. Xu, Z. Yu, X. Yang, L. Cheng and Y. P. Tian, Tetrahedron, 2012, 68, 6569–6574 CrossRef CAS.
- H. P. Zhou, Z. Zheng, G. Xu, Z. Yu, X. Yang, L. Cheng and Y. P. Tian, Dyes Pigm., 2012, 94, 570–582 CrossRef CAS.
- K. Zheng, W. Lin, L. Tan, H. Chen and H. Cui, Chem. Sci., 2014, 9, 3439–3448 RSC.
- A. Kulkarni, X. Kong and S. Jenekhe, Adv. Funct. Mater., 2006, 16, 1057–1066 CrossRef CAS.
- Y. Shigemitsu, T. Mutai, H. Houjou and K. Araki, J. Phys. Chem. A, 2012, 116, 12041–12048 CrossRef CAS PubMed.
- X. P. Gan, Y. Wang, X. P. Ge, W. Li, X. Zhang, W. Zhu, H. P. Zhou, J. Y. Wu and Y. P. Tian, Dyes Pigm., 2015, 120, 65–73 CrossRef CAS.
Footnote |
| † Electronic supplementary information (ESI) available. CCDC 1040856 (1), 1487391 (2), 1040859 (3), 1040861 (5) and 1040862 (6), respectively. For ESI and crystallographic data in CIF or other electronic format see DOI: 10.1039/c6ob02181f |
| This journal is © The Royal Society of Chemistry 2017 |