 Open Access Article
Wrinkling formation in simply-supported graphenes under tension and compression loadings†
Ch.
Androulidakis‡
 a,
E. N.
Koukaras
 ab,
M. G.
Pastore Carbone
a,
M.
Hadjinicolaou
 ab and
C.
Galiotis
 *ac
*ac
aInstitute of Chemical Engineering Sciences, Foundation of Research and Technology-Hellas (FORTH/ICE-HT), Stadiou Street, Platani, Patras, 26504 Greece. E-mail: c.galiotis@iceht.forth.gr; galiotis@chemeng.upatras.gr
bSchool of Science & Technology, Hellenic Open University, Patras, 26222 Greece
cDepartment of Chemical Engineering, University of Patras, Patras, 26504 Greece
First published on 9th November 2017
Abstract
Wrinkles in supported graphenes can be formed either by uniaxial compression or uniaxial tension beyond a certain critical load depending on the mode of loading. In the first case, the wrinkling direction is normal to the compression axis whereas in tension, wrinkles of the same pattern are formed parallel to the loading direction due to Poisson's (lateral) contraction. Herein we show by direct AFM observations that in simply-supported graphenes such instabilities appear as periodic wrinkles over existing stochastic undulations caused by the underlying-substrate-roughness. The critical strain for the generation of these wrinkles in both tension and compression is less than 1% which particularly for the former is far lower than the predicted tensile strain to fracture of suspended graphene estimated at ∼30%. Based on these findings, a constitutive model that provides the critical tensile strain for induced buckling in the lateral direction is proposed that depends only on the graphene-support interaction and not on the nature of the substrate. Understanding the wrinkling failure of graphenes under strain is of paramount importance as it leads to new threshold limits beyond which the physical–mechanical properties of graphene are impaired.
Introduction
Monolayer graphene is the most prominent member of the family of 2D materials from the point of view of mechanical behavior1 in spite of its atomic thickness. Early nano-identation experiments have indicated that if the force-deflection trace is converted to a uniaxial tensile stress–strain curve by assuming zero bending stiffness then a tensile strength of 130 GPa and a corresponding strain to failure of ∼30% can be achieved.2 These results have also been confirmed by studies performed by us3 and others4 on numerical modelling of graphene under uniaxial loadings. Experimentally however these values have not as yet been fully verified due to problems associated with handling and mechanical testing of such thin samples. Still to date the most successful method of mechanical loading is the placement of graphenes onto plastic beams which can be flexed up or down subjecting the tiny flakes to compressive or tensile strains respectively. Using this technique significant information can be derived such as the interfacial shear stress in graphene/polymer5 systems or the compressive failure.6,7 So far the maximum tensile strain measured without interfacial failure or matrix yielding for an irregularly shaped monolayer flake is approximately 1.5%–1.7%![[thin space (1/6-em)]](https://www.rsc.org/images/entities/char_2009.gif) 8,9 which is far below the predicted strain-to-failure.
8,9 which is far below the predicted strain-to-failure.
Due to its very low (but non-zero) bending rigidity,10 graphene is prone to wrinkling instabilities under both tension and compression.6,7,11 A freely-suspended single layer graphene (SLG) of micron dimensions is expected to buckle at extremely low compressive strain as predicted by Euler theory.7 This situation changes dramatically when the graphene is embedded in polymers and axial compressive strains as high as −0.6 to −0.7% have been measured regardless of its aspect ratio.6,7 This value is orders of magnitude larger than the corresponding value in air, because of the constraint provided by the polymers against the out-of-plane deformation of graphene.
Lateral or orthogonal wrinkling can also be induced by tensile loading of suspended graphene similar to a thin sheet stretched uniaxially.12 This has been observed experimentally by Polyzos et al.11 which showed that for a suspended monolayer graphene which was sandwiched between two PMMA sheets and stretched by 0.7%, lateral wrinkles of wavelength ∼1 μm are formed. Hence, it is clear, albeit not often stated, that uniaxial tension in suspended 2D materials brings about almost simultaneously out of plane instabilities in the lateral direction due to Poisson's contraction12 and that may induce in certain cases premature failure. Corresponding changes to the electrical and thermal properties of graphene are also expected by these out-of-plane phenomena.
When a simply supported or embedded graphene flake is subjected to uniaxial tension, it is in fact loaded in compression in the lateral direction due to the Poisson's shrinkage of the polymer (which is relatively larger than that of graphene). Wrinkling of supported graphene under compression has been examined in various studies,8,13–15 as well as the effect of heavy wrinkled topography present in CVD graphene to the tensile performance and the reinforcing capabilities.16–18 On the other hand, little attention has been given to the formation of these instabilities under tension.11
In the present work we examine the wrinkling failure of simply supported graphene flakes under both tension and compression. Under compression we observe the modes of failure by atomic force microscope (AFM) and we also simulate the experiments by molecular dynamic (MD) simulations. For the case of tension, we also observe the wrinkling failure with AFM at small tensile strain and a continuum model is developed to predict the critical tensile strain for the initiation of lateral wrinkling. The important parameters that we study in this work which are of paramount importance for the use of graphene as simply-supported membrane in various devices, are the critical strain for out-of-plane wrinkling and the wrinkling pattern beyond the critical strain for its formation.
Materials and methods
Experiments
In the present study we used polymer bars of PMMA (poly-methylmethacrylate) as substrates spin-coated with the SU-8 photoresist of ∼180 nm in thickness on the surface. Monolayer and bilayer graphene flakes were prepared by cleaving mechanically high quality bulk graphite (HOPG) with the scotch tape method19 and deposited directly on the PMMA/SU-8. Appropriate graphene flakes were located using the optical microscope and the exact thickness of the flakes was identified by the corresponding Raman line of the 2D spectra.In the case of simply supported graphene flakes, a three-point-bending apparatus was adjusted under an AFM microscope which allowed the visualization of the wrinkling morphologies under various strain levels. The flakes were subjected incrementally to tensile strain and the AFM images were captured at various levels of tensile strain. We performed the experiments in a Bruker Dimension Icon® AFM with a Scan-Assist Air tip of stiffness ∼0.40 N m−1. The measurements of the topography of the flakes were selected by using the operating Peak Force Nano-mechanical mode.
Molecular dynamics simulations
The AIREBO potential20 was employed for the carbon–carbon interactions in the molecular dynamics simulations. The substrate of graphene is modelled as an interacting mathematical surface (plane). The interaction of the carbon atoms of graphene with the surface is adjustable. The magnitude of the interaction of 6.7 meV per atom (0.25 kJ mol−1 Å−2) is in the expected range for PMMA as a substrate.6 For the energy conversions we have used the area per carbon atom in graphene, Aatomic = ½|a1 × a2| = ½a2![[thin space (1/6-em)]](https://www.rsc.org/images/entities/char_2009.gif) sin
sin![[thin space (1/6-em)]](https://www.rsc.org/images/entities/char_2009.gif) 60° = 2.62 Å−2, where a is the lattice constant of graphene.21 This approach eliminates any dependence on random surface imperfections. The simulations were performed on a large graphene consisting of 64
60° = 2.62 Å−2, where a is the lattice constant of graphene.21 This approach eliminates any dependence on random surface imperfections. The simulations were performed on a large graphene consisting of 64![[thin space (1/6-em)]](https://www.rsc.org/images/entities/char_2009.gif) 000 carbon atoms in a computational cell of 852.0 × 196.8 Å2 with periodic boundary conditions. The integration time step was set to 1.0 fs. All molecular dynamics simulations were performed using the LAMMPS package.22Fig. 2 was made using OVITO.22b
000 carbon atoms in a computational cell of 852.0 × 196.8 Å2 with periodic boundary conditions. The integration time step was set to 1.0 fs. All molecular dynamics simulations were performed using the LAMMPS package.22Fig. 2 was made using OVITO.22b
Results and discussion
Compression
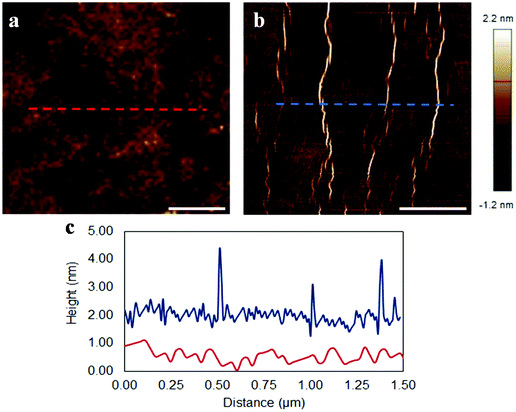
A single layer graphene resting on a substrate under compression fails by wrinkling formation. Graphene has a very low resistance to bending due to its mono-atomic thickness, and as a result it buckles under compression in order to accommodate the compressive load. The critical strain for the initiation of wrinkling strongly depends on the magnitude of adhesion with the underline substrate and was found to be ∼−0.30% for a single layer graphene on PMMA/SU-8.13 Herein, the form of failure of simply supported single layer graphene under compression was examined by AFM and MD simulations as well. The AFM results for a single layer graphene on a PMMA/SU-8 substrate at rest (∼0.00%) and under ∼−1.00% compressive strain are represented in Fig. 1. As seen, wrinkles are formed at regular intervals of 500 nm. We note that in Fig. 1b and c the wrinkles resemble sharp folds due to the scaling of axis, however, the full wavelength is in the range of 30–40 nm and their maximum amplitude is ∼2.8 nm and thus, this is a usual buckling failure. Similar wrinkle formation have been observed elsewhere experimentally8 and by computer simulations.15 The physical mechanism for the formation of wrinkles has been examined in detail in previous works,13,23 so here we focus on the morphology of the wrinkles and their evolution with strain by MD simulations. It is worth noting that, as seen in Fig. 1c, initially, there is a small out-of-plane fluctuation in the order of ∼0.5 nm which corresponds to the roughness of the polymer substrate. Also, the simply-supported graphene conforms almost perfectly to the polymer surface and, at high strains the wrinkling pattern is not a sinusoidal wave postulated for fully embedded graphene6 but a periodic pattern of individual wrinkles at distances of approximately 300–500 nm from each other.We follow the formation process of a wrinkle and its progression with further increment of compressive strain via molecular dynamics simulations. Details on the simulations are given in the Methods section. We mention that we used a low constant engineering strain rate of 1 × 10⁻³% ps−1 to avoid any rate effects and to simulate closer the conditions of the experiment. As described above, upon increasing compression at some point a distinct wrinkle is formed. This form of failure is in agreement with the experimental findings for relatively low compressive strain. An advanced stage of such a formation is shown in Fig. 2a. Upon further compression at some point opposite regions of the buckle come in very close proximity. At this stage the van der Waals forces come into play and the buckle snaps into a fold, such as the one shown in Fig. 2e. The effect is demonstrated in the video files of the simulations that we provide in the ESI.† Indeed, folds like that surround flat regions of graphene in two dimensions have been observed by us16,18 in simply supported CVD graphene that has been subjected to extremely high strain when cooled from high temperature during the production process.
We provide in Fig. 2 morphometric data to describe the dynamic evolution of an individual wrinkle with compression. In particular, we show the height LF of the formation (Fig. 2b) as well as its width WF, which is equal to the full width at quarter height (FWQH, LF/4) and for the initial stages is such that WF > 2R1. At later stages at some point WF < 2R1 (see Fig. 2c and d), then WF is taken as the neck (minimum distance) between the two opposing faces of the wrinkle. The radii of curvature R1 and R2 correspond to the upper internal and lower external part of the structures, respectively, as shown in Fig. 2b. If we set that the graphene sheet was originally lying on the xy-plane then, in order to obtain the values of R1 and R2 we project the structure on the xz-plane. A portion of the curved region was then selected and a circle was fitted to the data. We used the modified least-squares (MLS) method for the fitting as described in ref. 24, since it is numerically stable and offers closed-form solutions.
In Fig. 3 we show the evolution of these parameters with increasing compressive displacement, ΔLx. As expected the strongest effect on the compressive displacement is from the height, LF, that increases steadily up to a value ∼90 Å, before snapping into a fold. In the work of Al-Mulla et al.14 this corresponds to the processes they define as crumpling, specifically, buckling followed by self-adhesion. The initial fold height is ∼104 Å. The width WF (the width at the base as was considered also for the experimental results) exhibits a steady decrease and reaches ∼6.7 Å. After that the fold is abruptly formed and WF takes a value of ∼3.5 Å. Interestingly, both of the radii of curvature R1 and R2 exhibit approximately constant values throughout the process, of ∼16 Å and ∼18.5 Å, respectively.
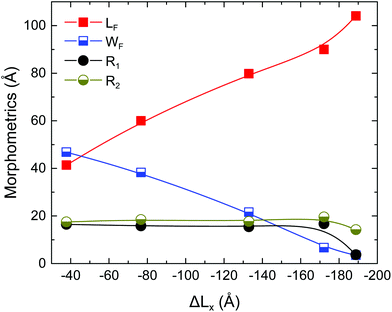 | ||
| Fig. 3 Morphometric lengths as defined in text and shown in Fig. 2. | ||
The increasing interest for graphene wrinkle formation in published literature emanates from the effect of out-of-plane phenomena upon graphene properties.25 Amongst these effects the most well-known or identified are the coupling between wrinkle morphology and electronic transport properties.26,27 Interest is further driven by the objective to identify means of controlling their morphology,27 formation, and density.15 As mentioned above, for CVD-grown graphene these structures are common26 due to the extreme thermal (mismatch) compression strains developed from cooling the graphene supported on metal substrate from very high temperatures down to RT.
Tension
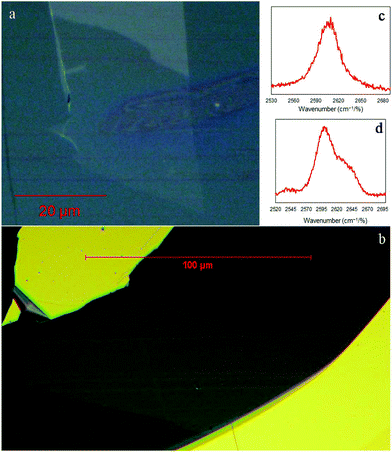
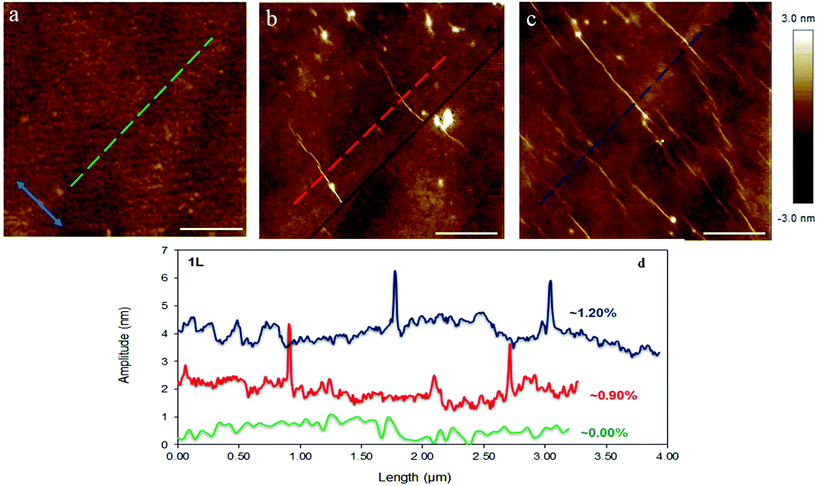
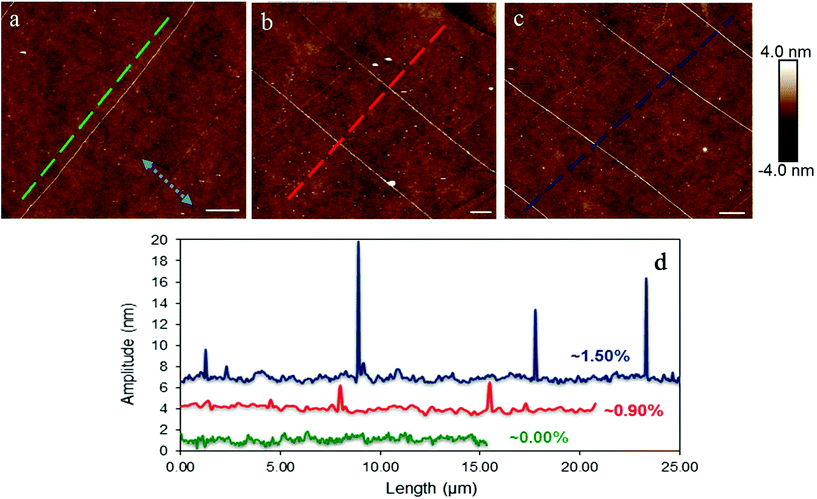
As mentioned above, in order to have direct evidence that lateral buckling can be induced by tension in graphene supported by a substrate we tested simply supported mono and bilayer graphene flakes under an AFM microscope. The flakes were tested at three distinct levels of applied strain namely at rest (i.e. ε = 0%), at ∼0.90% and 1.20% (or 1.50% for the bilayer). Fig. 4a and b show images of the examined mono and bilayer graphene flakes taken with the optical microscope. The exact nature of the flake was identified by the corresponding Raman spectra of the 2D peak (Fig. 4c and d). The length and width of the approximately rectangular flakes were approximately, ∼25 μm and ∼33 μm and ∼130 μm and ∼50 μm for the monolayer and bilayer, respectively. It is worth noting here that the dimensions of the flakes in the loading direction were large enough to ensure efficient load transfer at all strains.5 Because of the large flake dimensions, we were able to scan areas of the order of few square microns close to the geometric centre. For the case of monolayer we expect wrinkles with small amplitude/wavelength, thus scans within an area of ∼4 × 4 μm2 were performed (Fig. 5). For the bilayer the corresponding areas were ∼20 × 20 μm2 (Fig. 6).In Fig. 5 the experimental findings for the case of the simply supported monolayer graphene under tension are presented. At rest the flake has a small and smooth fluctuation in the out of plane direction of ±0.5 nm, indicating that the flake is approximately flat (Fig. 5a). We observed clear localized wrinkles induced by tension parallel to the direction of the applied tension at the strain level of ∼0.90% (Fig. 5b). Since the strain was induced incrementally the exact strain level at which the wrinkles appeared could not be recorded. In any case, the present results show that even for simply supported graphenes lateral wrinkling initiates at a far smaller strain than the tensile fracture strain. Such modes of failure have been studied theoretically in recent works28,29 and as the experiments confirm here are omnipresent30 when graphenes of micron dimensions are loaded in tension. In fact, this type of failure modes is quite common for supported thin films when the underlying substrate is relative stiff (here the modulus of the substrate is ∼3 GPa). Also, we cannot rule out that prior to the creation of wrinkles at 0.9% strain, small wavelength/amplitude sinusoidal waves were developed due to buckling across the width of the flake. This transition from sinusoidal buckling to wrinkle of high amplitude has been observed previously by simulations.29 This assumption is also backed up by observing the snapshots in Fig. 5d which show at 0.90% of strain the area between the folds is rough with small wrinkles compared to the smooth fluctuations at the unstressed state.
The wavelength at 0.90% tension is ∼38 nm with maximum amplitude of ∼2 nm whereas the distance between them is a few microns (Fig. 5b and c). Further increment of tensile strain (∼1.2%) causes the creation of many more wrinkles as can be clearly seen in Fig. 5c. It must be noted that even with a small increment of tensile strain (of ∼0.20%), from 1.00% to 1.20%, the density of wrinkles rapidly increases and raises an important question if actually a graphene with large dimensions (∼tens of microns) can reach such as high fracture tensile strain as ∼30%.2 The present findings are also supported by similar experiments performed on a CVD mono-layer on copper foil31 for which lateral wrinkles induce by tension loading were observed at relatively lower strains.
The response of simply supported17 and fully embedded32 bi-layer graphene under tension has been examined previously by the shift of the Raman peaks under strain. Herein, we also examine bi-layer graphene under the AFM similar to the single layer presented above. At the unstressed state certain wrinkles vertically to the applied tension (Fig. 6a) created during the exfoliation procedure. The position frequency of the 2D peak at the unstressed state is 2604 cm−1 which shows that the bilayer has no residual compression. These vertical wrinkles are straightened by the tensile strain as evident by the images of higher level of tension (Fig. 6b), and provide also proof that the flake is actually stressed uniaxially under tension. Again at tensile strain of 0.90% lateral wrinkles have been created parallel to the applied tension similar to the monolayer. In fact, the transition from wrinkles vertical to the direction of loading at the onset of the experiment to (lateral) wrinkles parallel to the tensile axis at 0.90% strain is clearly demonstrated in Fig. 6a and b, and represents one of the significant findings of this work. The wrinkle wavelength is in the range of ∼70–300 nm with varying amplitude of ∼2–15 nm with the distance between them being this time a few microns (Fig. 6b and c). The constant distance between the wrinkles and their perfect straightness suggest a very homogeneous and strong adhesion to the underline polymer. Further increment of tensile strain causes an increment of the wrinkling characteristics (wavelength, amplitude) as can be clearly seen in Fig. 6c and d. The wrinkle amplitude/wavelength of the bi-layer is higher than the corresponding values for the monolayer as expected from continuum theory.33 The distance between the wrinkles is larger than the case of single layer due to the higher bending rigidity. The higher bending rigidity leads to the creation of a smaller number of wrinkles for releasing the compressive strain and thus they are more widely distributed across the width of the bi-layer flake.
In order to examine the wrinkling under tension of the graphenes on substrate by MD simulations, flakes with dimensions of microns are required which is impractical due to the required high computational costs and computer time. Thus, we attempt here to develop an analytical model based on continuum mechanics theory. Consider a single layer graphene (or thin plate with bending rigidity D) that it is supported by a polymer matrix and is axially stretched (Fig. 7). The interaction between the polymer and the graphene is modeled following the Winkler's approach34 with linear elastic springs with spring constant KW. This approach has a universal validity as it is only affected by the graphene/substrate interaction and not by the nature of the underlying material. Such a model was applied earlier to replicate successfully the compression behaviour of embedded single layer graphene as confirmed also by MD simulations.13
To develop the constitutive relations, we assume that the tensile behaviour of graphene is linear elastic up to the strain level considered. This assumption is reasonable and backed by the experiment for both supported, embedded graphenes9 or even suspended graphene.2 The distribution of the compressive stress in the lateral direction of the tension is uniform since it is induced by the underlying polymer. Also, the critical strain for buckling instability has been found6 to be independent of the dimensions of the graphene and the same should hold in the case of tension (presented below).
Starting from the energy balance:35
| ΔT = ΔU | (1) |
The work from the external forces is from the tensile normal force T1 transmitted to graphene through shear at the interface and the compressive force T2 from the Poisson's contraction of the matrix in the y direction:
 | (2) |
We note that in the last term the Poisson's ratio is that of the surrounding polymer and u(x,y) is a function that describes the displacement field of graphene. The elastic energy ΔU is the bending energy of the plate and the energy provided from the elastic springs against the out-of-plane deformations of the plate (Winkler assumption):
 | (3) |
 | (4) |
 | (5) |
 | (6) |
 | (7) |
Substituting the energy expressions (5)–(7) to the eqn (1), we obtain:
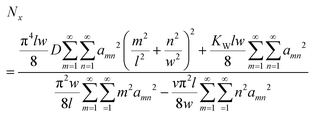 | (8) |
Following a reasoning similar to that of ref. 35, the critical force Nx, being a sum of positive quantities, is minimized when only one term αmn is different than zero. Assuming that there are several half waves in the direction of compression but only one half wave in the direction of the tensile force (m = 1) and using the formula Nx = εC, where C = Eh is the tension rigidity, we finally arrive at the following expression for the critical strain, εcr, for inducing orthogonal buckling failure (after minimization, see below eqn (10)):
 | (9) |
 | (10) |
Now we apply this model in the case of a PMMA/SU-8/graphene/PMMA matrix which is a case well examined experimentally.6,7,38 Consider a monolayer graphene simply supported on polymer with length of 30 μm and width 10 μm as representative dimensions under tension. KW is 3 GPa nm−1 (ref. 13) and the Poisson's ratio is 0.35 as evaluated experimentally38 for the above mentioned case. First we calculate the number of half waves n in the y direction by eqn (10) which gives n = 6627. Then we calculate the critical strain to buckling under tension to be εcr = 1.20%. In Fig. 8 we plot the critical tensile strain versus usual values for the Poisson's ratio of polymers in the range of 0.3–0.5 for various levels of adhesion assuming upper limit the system of single layer graphene on PMMA/SU-8 substrate. It is apparent than for weaker adhesion the initiation of lateral failure occurs at lower critical strains while, as expected, the reverse effect is observed for high level of graphene/polymer interaction. This result indicates that in fully embedded graphenes, as for instance in the case of engineering composites, these values should be higher and therefore no lateral buckling should be expected up to moderate critical strains. Work is currently in progress to verify this assumption.
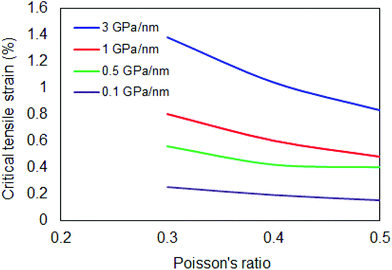 | ||
| Fig. 8 The theoretically derived critical tensile strain for lateral buckling for various levels of adhesion and a common range of Poisson's ratio for polymers. | ||
The critical strain is considerably lower than the tensile fracture strain of graphene. The value of the critical strain is independent of the dimensions of the graphene flake, assuming that they are larger than the required minimum transfer length for efficient stress transfer from the polymer to the graphene. Thus, a single layer graphene with length and width larger than the transfer length which is about ∼4 μm (ref. 6) will always wrinkle laterally at small tensile strain. For the case of an embedded bilayer graphene the critical compressive strain to failure is ∼−0.20%![[thin space (1/6-em)]](https://www.rsc.org/images/entities/char_2009.gif) 39 which is smaller than the value for the monolayer. The Winkler modulus is estimated to be 1 GPa nm−1 and the critical tensile strain is ∼0.63%. Bearing in mind the sensitivity of the initiation of buckling from the adhesion energy as discussed above and that the theoretical estimated critical strain is also affected by the level of adhesion which is expressed through the KW, the developed theoretical model can describe the experimental results with good agreement. As seen in Fig. 8, the critical tensile strain for out-of-plane lateral buckling is very sensitive to the level of adhesion even for the simply-supported case examined in this work. Thus it is expected that for different substrates and levels of adhesion considerable variations in the critical tensile strain for lateral buckling should be expected.
39 which is smaller than the value for the monolayer. The Winkler modulus is estimated to be 1 GPa nm−1 and the critical tensile strain is ∼0.63%. Bearing in mind the sensitivity of the initiation of buckling from the adhesion energy as discussed above and that the theoretical estimated critical strain is also affected by the level of adhesion which is expressed through the KW, the developed theoretical model can describe the experimental results with good agreement. As seen in Fig. 8, the critical tensile strain for out-of-plane lateral buckling is very sensitive to the level of adhesion even for the simply-supported case examined in this work. Thus it is expected that for different substrates and levels of adhesion considerable variations in the critical tensile strain for lateral buckling should be expected.
The present findings have important implications in the use of graphene as a filler in polymer nano-composites. When lateral buckling occurs, the bonding between the polymer and the graphene may be affected by the interlayer changes in the bonding length caused by the out-of-plane deformations of graphene as was demonstrated in detail by MD simulations in our previous work.13 The weakening of the bonding will affect in turn the stress transfer efficiency in the composite for strains larger than the critical strain for lateral buckling. One way to avoid lateral wrinkling is to employ oriented graphene microribbons in composites rather than large or irregular flakes as will be discussed in a future publication.
In summary, we examined by AFM and MD simulations simply supported graphenes under uniaxial compression and tension loadings. In both cases we recorded the formation of wrinkling patterns created at regular distances of the order of 0.5 μm and 7 μm for monolayer and bilayer graphenes, respectively. This type of pattern corresponds perfectly well with what is obtained by MD simulations at small strains nearly to the critical strain of wrinkle formation. It is noteworthy that under tension, we observed lateral wrinkling at uniaxial strains of less than 0.90% for mono and bi-layer graphenes which is far less than the tensile strain to fracture of suspended graphene. This is, in our opinion, an important result since it confirms that even at relatively small strains out-of-plane phenomena are present. Finally, a continuum mechanics model was developed in order to examine the dependence of critical strain for lateral wrinkling upon the level of adhesion between graphene and the underlying substrate. The model showed that the critical strain for wrinkle formation can be modulated to a certain extend by the level of interaction with the substrate and therefore significant variations in the critical strain should be expected for different graphene/polymer systems. The present work provided a useful insight in the understanding of the wrinkling formation of graphene under uniaxial loading. Needless to add that these kind of instabilities observed in supported graphene are bound to affect the physical–mechanical properties of graphene composites and must be taken into account in future designs and applications.
Conflicts of interest
The authors declare no competing interests.Acknowledgements
The authors acknowledge the financial support of the European Research Council (ERC Advanced Grant 2013) via project no. 321124, “Tailor Graphene”. CG and MH also acknowledge the support of the research project “Graphene Core 1, GA: 696656 – Graphene-based disruptive technologies”, which is implemented under the EU-Horizon 2020 Research & Innovation Actions (RIA) and is financially supported by EC-financed parts of the Graphene Flagship. Dr Georgia Tsoukleri, Dr John Parthenios and Prof. Konstantinos Papagelis are thanked for their collaboration and for useful discussions.References
- C. Galiotis, O. Frank, E. N. Koukaras and D. Sfyris, Annu. Rev. Chem. Biomol. Eng., 2015, 6, 121–140 CrossRef CAS PubMed.
- C. Lee, X. D. Wei, J. W. Kysar and J. Hone, Science, 2008, 321, 385–388 CrossRef CAS PubMed.
- G. Kalosakas, N. N. Lathiotakis, C. Galiotis and K. Papagelis, J. Appl. Phys., 2013, 113, 134407 CrossRef.
- F. Liu, P. M. Ming and J. Li, Phys. Rev. B: Condens. Matter, 2007, 76, 064120 CrossRef.
- G. Anagnostopoulos, C. Androulidakis, E. N. Koukaras, G. Tsoukleri, I. Polyzos, J. Parthenios, K. Papagelis and C. Galiotis, ACS Appl. Mater. Interfaces, 2015, 7, 4216–4223 CAS.
- C. Androulidakis, E. N. Koukaras, O. Frank, G. Tsoukleri, D. Sfyris, J. Parthenios, N. Pugno, K. Papagelis, K. S. Novoselov and C. Galiotis, Sci. Rep., 2014, 4, 5271 CrossRef PubMed.
- O. Frank, G. Tsoukleri, J. Parthenios, K. Papagelis, I. Riaz, R. Jalil, K. S. Novoselov and C. Galiotis, ACS Nano, 2010, 4, 3131–3138 CrossRef CAS PubMed.
- T. Jiang, R. Huang and Y. Zhu, Adv. Funct. Mater., 2014, 24, 396–402 CrossRef CAS.
- C. Androulidakis, G. Tsoukleri, N. Koutroumanis, G. Gkikas, P. Pappas, J. Parthenios, K. Papagelis and C. Galiotis, Carbon, 2015, 81, 322–328 CrossRef CAS.
- Q. Lu, M. Arroyo and R. Huang, J. Phys. D: Appl. Phys., 2009, 42, 102002 CrossRef.
- I. Polyzos, M. Bianchi, L. Rizzi, E. N. Koukaras, J. Parthenios, K. Papagelis, R. Sordan and C. Galiotis, Nanoscale, 2015, 7, 13033–13042 RSC.
- E. Cerda and L. Mahadevan, Phys. Rev. Lett., 2003, 90, 074302 CrossRef CAS PubMed.
- E. N. Koukaras, C. Androulidakis, G. Anagnostopoulos, K. Papagelis and C. Galiotis, Extreme Mech. Lett., 2016, 8, 191–200 CrossRef.
- T. Al-Mulla, Z. Qin and M. J. Buehler, J. Phys.: Condens. Matter, 2015, 27, 345401 CrossRef PubMed.
- K. Zhang and M. Arroyo, J. Appl. Phys., 2013, 113, 193501 CrossRef.
- G. Anagnostopoulos, P.-N. Pappas, Z. Li, I. A. Kinloch, R. J. Young, K. S. Novoselov, C. Y. Lu, N. Pugno, J. Parthenios and C. Galiotis, ACS Appl. Mater. Interfaces, 2016, 8, 22605–22614 CAS.
- C. Androulidakis, E. N. Koukaras, J. Rahova, K. Sampathkumar, J. Parthenios, K. Papagelis, O. Frank and C. Galiotis, ACS Appl. Mater. Interfaces, 2017, 9, 26593–26601 CAS.
- Z. Li, I. A. Kinloch, R. J. Young, K. S. Novoselov, G. Anagnostopoulos, J. Parthenios, C. Galiotis, K. Papagelis, C.-Y. Lu and L. Britnell, ACS Nano, 2015, 9, 3917–3925 CrossRef CAS PubMed.
- K. S. Novoselov, A. K. Geim, S. V. Morozov, D. Jiang, Y. Zhang, S. V. Dubonos, I. V. Grigorieva and A. A. Firsov, Science, 2004, 306, 666–669 CrossRef CAS PubMed.
- S. J. Stuart, A. B. Tutein and J. A. Harrison, J. Chem. Phys., 2000, 112, 6472–6486 CrossRef CAS.
- P. R. Wallace, Phys. Rev., 1947, 71, 622 CrossRef CAS.
- (a) S. Plimpton, J. Comput. Phys., 1995, 117, 1–19 CrossRef CAS; (b) A. Stukowski, Model. Simul. Mater. Sci. Eng., 2010, 18, 015012 CrossRef.
- K. Zhang and M. Arroyo, J. Appl. Phys., 2013, 113, 193501 CrossRef.
- D. Umbach and K. N. Jones, IEEE Trans. Instrum. Meas., 2003, 52, 1881–1885 CrossRef.
- S. Deng and V. Berry, Mater. Today, 2016, 19, 197–212 CrossRef CAS.
- W. Zhu, T. Low, V. Perebeinos, A. A. Bol, Y. Zhu, H. Yan, J. Tersoff and P. Avouris, Nano Lett., 2012, 12, 3431–3436 CrossRef CAS PubMed.
- K. Kim, Z. Lee, B. D. Malone, K. T. Chan, B. Alemán, W. Regan, W. Gannett, M. F. Crommie, M. L. Cohen and A. Zettl, Phys. Rev. B: Condens. Matter, 2011, 83, 245433 CrossRef.
- D. Sfyris, C. Androulidakis and C. Galiotis, Int. J. Solids Struct., 2015, 71, 219–232 CrossRef CAS.
- K. Zhang and M. Arroyo, J. Appl. Phys., 2013, 113, 193501 CrossRef.
- D. Sfyris and C. Galiotis, Math. Mech. Solids, 2016, 21, 812–825 CrossRef.
- S. R. Na, X. H. Wang, R. D. Piner, R. Huang, C. G. Willson and K. M. Liechti, ACS Nano, 2016, 10, 9616–9625 CrossRef CAS PubMed.
- O. Frank, M. Bouša, I. Riaz, R. Jalil, K. S. Novoselov, G. Tsoukleri, J. Parthenios, L. Kavan, K. Papagelis and C. Galiotis, Nano Lett., 2011, 12, 687–693 CrossRef PubMed.
- H. X. Mei, C. M. Landis and R. Huang, Mech. Mater., 2011, 43, 627–642 CrossRef.
- E. Winkler, Die Lehre Von Der Elasticitaet Und Festigkeit, Kessinger, 1867.
- S. P. Timoshenko and J. M. Gere, Theory of elastic stability, McGraw-Hill, New York, 2nd edn, 1961 Search PubMed.
- N. Friedl, F. G. Rammerstorfer and F. D. Fischer, Comput. Struct., 2000, 78, 185–190 CrossRef.
- V. Nayyar, K. Ravi-Chandar and R. Huang, Int. J. Solids Struct., 2011, 48, 3471–3483 CrossRef.
- C. Androulidakis, E. N. Koukaras, J. Parthenios, G. Kalosakas, K. Papagelis and C. Galiotis, Sci. Rep., 2015, 5, 18219 CrossRef CAS PubMed.
- G. Tsoukleri, J. Parthenios, C. Galiotis and K. Papagelis, 2D Mater., 2015, 2, 024009 CrossRef.
Footnotes |
| † Electronic supplementary information (ESI) available. See DOI: 10.1039/c7nr06463b |
| ‡ Now at University of Illinois at Urbana-Champaign, Department of Mechanical Science and Engineering. |
| This journal is © The Royal Society of Chemistry 2017 |

