 Open Access Article
Creative Commons Attribution 3.0 Unported Licence
Cellular traction forces: a useful parameter in cancer research†
Zhen
Li
ab,
Henrik
Persson‡
 ab,
Karl
Adolfsson
ab,
Laura
Abariute
ab,
Magnus T.
Borgström
ab,
Dan
Hessman
ab,
Kalle
Åström
ab,
Karl
Adolfsson
ab,
Laura
Abariute
ab,
Magnus T.
Borgström
ab,
Dan
Hessman
ab,
Kalle
Åström
 c,
Stina
Oredsson
 bd and
Christelle N.
Prinz
 *ab
*ab
aDivision of Solid State Physics, Lund University, 221 00 Lund, Sweden. E-mail: christelle.prinz@ftf.lth.se
bNanoLund, Lund University, 221 00 Lund, Sweden
cCentre for Mathematical Sciences, Lund University, 221 00 Lund, Sweden
dDepartment of Biology, Lund University, 223 62 Lund, Sweden
First published on 24th November 2017
Abstract
The search for new cancer biomarkers is essential for fundamental research, diagnostics, as well as for patient treatment and monitoring. Whereas most cancer biomarkers are biomolecules, an increasing number of studies show that mechanical cues are promising biomarker candidates. Although cell deformability has been shown to be a possible cancer biomarker, cellular forces as cancer biomarkers have been left largely unexplored. Here, we measure traction forces of cancer and normal-like cells at high spatial resolution using a robust method based on dense vertical arrays of nanowires. A force map is created using automated image analysis based on the localization of the fluorescent tips of the nanowires. We show that the force distribution and magnitude differ between MCF7 breast cancer cells and MCF10A normal-like breast epithelial cells, and that monitoring traction forces can be used to investigate the effects of anticancer drugs.
Introduction
Mechanical cues play an important role in cell function such as migration, proliferation and differentiation. Cell deformability, assessed by atomic force microscopy,1 optical stretching2 and micropipette aspiration3 has been shown to be a promising biomarker in cancer research. These studies showed that cancer cells are more deformable and less viscous4 than their normal counterpart. Another component of mechanical cues consists of the forces exerted by cells on their environment, or cellular traction forces. Multiple studies have investigated cell traction forces to assess cell properties such as focal adhesion dynamics, stress propagation, cell differentiation, biofilm formation and invasiveness.5–8 In particular, traction forces have been shown to be a biomarker of metastatic potential and malignancy.7–9 For instance, metastatic cells have been shown to exert higher traction forces compared to non-metastatic cells, in breast, prostate and lung cancer models.8 However, whether traction forces can be used when assessing the effects of anticancer drugs has been left largely unexplored. Indeed, when testing a new chemotherapeutic approach, the assay usually consists of investigating effects on cell proliferation, migration and death, as well as specific protein expression,10 whereas the cell response to the drug in terms of traction force changes is not investigated. Therefore, there is a pressing need to explore whether traction forces can be used to investigate the mechanisms of action of possible chemotherapeutic compounds.In this paper, we investigate the traction forces of MCF7 breast cancer cells and normal-like MCF10A breast epithelial cells and suggest that traction force is a useful parameter to monitor when investigating the effects of anticancer treatment. In order to measure traction forces at high spatial resolution in a robust manner, we developed a method based on dense arrays of vertical nanowires with photoluminescent tips. All nanowire tip positions are detected using an advanced image analysis program, which detects and corrects small movements of the microscopy set-up. Our force measurements show that MCF7 cells and MCF10A cells exert different traction forces and that the effects of anticancer drug on the different cells are reflected in their traction forces.
Results and discussion
Development of a robust method for global force readout at high spatial resolution
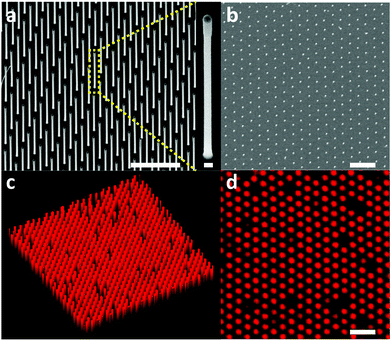
In order to investigate traction force as a possible cancer biomarker, we developed a tool suitable for stable in situ measurements of cellular traction forces with high spatial resolution and sensitivity. The main methods available for measuring traction forces are traction force microscopy and the micropillar method. Traction force microscopy consists of embedding fluorescent particles in a thin (tens of microns) gel layer and calculating the traction forces of cells cultured on the gel from the displacement of the particles.11,12 This method is easy to implement experimentally and has recently been demonstrated to be amenable to high spatial resolution force tracking.13 However, the calculation of the traction force is complex since a force exerted on a finite point in the gel will displace fluorescent particles at distant locations in the gel.14 In contrast, the micropillar method benefits from a straight-forward force readout: cells are cultured on top of elastomer micro-sized pillars and deflect them. The forces exerted by the cells on the pillars are calculated from the pillar deflection using the linear elasticity theory.15,16 This method has been widely used since it is easily implementable. Recently, nanowires have been proposed as a high-resolution alternative to micro-sized pillars since their small size (<100 nm in diameter) enables a denser arrangement compared to micropillars.6,17–20 By tuning the nanowire diameter and length, forces from tens of pN to tens of nN can be measured. However, this method suffers from the requirement to label the nanowires fluorescently in order to enable precise localization of the nanowire tip. This has been achieved using organic fluorophores, which limits the duration of the measurements due to photobleaching.19 Moreover, this method requires constant adjustment of the confocal plane at the nanowire tip, which is cumbersome and leads to uncertainties in the force estimation.19 We circumvent this issue by fabricating dense hexagonal arrays of vertical gallium phosphide (GaP) nanowires with an inherently photoluminescent tip of gallium indium phosphide (GaInP) (Fig. 1). GaInP nanowire segments have been shown to exhibit bright near infra-red photoluminescence with negligible bleaching and are therefore well-suited when stable emission is required during longitudinal measurements.21–23 The fact that only the tip of the nanowire emits light allows for small variations in focus to occur without any loss of precision in the force estimation based on the localization of the nanowire tip.The nanowire hexagonal pattern was defined on a GaP (111)B substrate using electron beam lithography (EBL), metal evaporation and lift-off. The nanowires were grown from gold seed nanoparticles by use of low-pressure (100 mbar) metal organic vapor phase epitaxy (MOVPE) using trimethylgallium, trimethylindium and phosphine as precursors and hydrogen as carrier gas (see ESI† for detailed nanowire array fabrication protocol). Typical nanowires have a GaP segment of 90 ± 5 nm in diameter, 2.6 ± 0.05 μm in length and a GaInP segment of 104 ± 5 nm in diameter and 0.4 ± 0.02 μm in length. The increase in diameter of the GaInP can be explained by a decrease in the contact angle of the gold particles on GaInP compared to GaP.24
The nanowire density was set to 2 μm−2, which was motivated by the need to have cells resting on top of the array for proper force calculations.
MCF7 human breast cancer cells and MCF10A human normal-like breast epithelial, were cultured on GaP–GaInP nanowire arrays. Scanning electron microscopy was used to verify that cells are growing on top of the nanowires (Fig. S1†). After 48 hours of incubation, the substrate was moved to the stage-incubator of a scanning confocal fluorescent microscope and the force measurements were performed (see ESI† for the complete experimental protocol, as well as Fig. S2†). Cells were visualized by detecting the scattered 488 nm laser light, and the nanowire tips were visualized using 488 nm laser excitation and 635 nm long pass filter detection.
Time-lapse images of the substrate were acquired (see ESI† for detailed experiment protocol and representative time lapse images for both cell types) and traction forces were calculated from the displacement of the nanowire tips using the linear elasticity theory for hexagonal cross sections:
 | (1) |
We have previously measured the spring constant of GaP nanowires and showed that the Young's modulus of GaP nanowires is very close to the Young's modulus of bulk GaP (150 GPa).19 In the present case, an additional GaInP segment is located at the tip of the nanowires. In order to assess whether the presence of this segment influences the nanowire spring constant, we performed finite element modeling using COMSOL (see ESI† for detailed procedure). The results show that when a force is exerted on the nanowire tip, the resulting strain is located at the nanowire base (Fig. S3†). Therefore, despite the presence of a thicker GaInP segment on top of the nanowires, the spring constant of GaP–GaInP nanowires can be considered as being the same as the one of GaP nanowires of same diameter as the GaP segment in the GaP–GaInP nanowires.
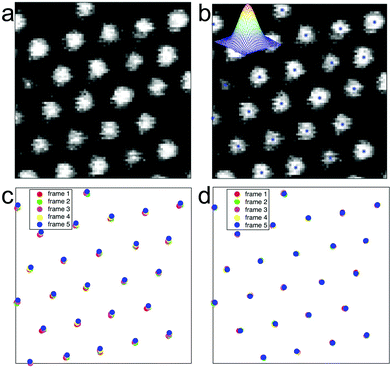
Another challenge associated with the use of dense nanowire arrays is the handling of the large amount of data i.e. acquiring the displacement of all nanowire tips present in the field of view and calculating the corresponding force. In previous studies, a subset of nanowires had been manually preselected in order to make the analysis feasible using a particle tracker.19,25 Preselecting nanowires, however, may lead to subtle events being overlooked. We addressed this issue by developing a robust image analysis program which extracts the (x,y) position of each nanowire tip, for each time lapse image and corrects for global movements and jitters of the microscopy setup. This method allows us to monitor traction forces on all nanowires as a function of time, and to generate high spatial resolution force maps and movies. The system consists of several algorithmic parts. First, each time lapse image is analysed for finding the centre point of each nanowire tip. The positions in the image are found as local maxima after low pass filtering with a Gaussian function. This can be efficiently computed using convolutions. These positions are then refined using sub-pixel interpolation methods.26 This method allows for modelling and understanding the properties of the errors in these positions. The input to this step is an image Ik and the output is a list uk of nk points uk = {(x1, y1), (x2, y2),…(xnk, ynk)}. The order of the points is at this point irrelevant and does not give any information about correspondences. Secondly, the centre positions uk and uk+1 of two subsequent frames are used as input to an algorithm for estimating the global translation or jitter between the two frames, while simultaneously finding the correspondences between the point-sets and removing outliers. This is done using a robust hypothesis and test paradigm as described in ref. 27 and 28. Based on these matchings in pairwise images, we use a robust method for extending the tracking to that of the whole sequence. Here, inconsistencies in matching and large errors in the pairwise translations can be detected and dealt with.29–31 The output of the whole system is a set of tracked points, with error estimates, throughout the whole sequence as well as a global jitter correction for each image (Fig. 2).
The resulting forces can then easily be extracted for all nanowires as a function of time from eqn (1) (Fig. S4†).
Force measurements
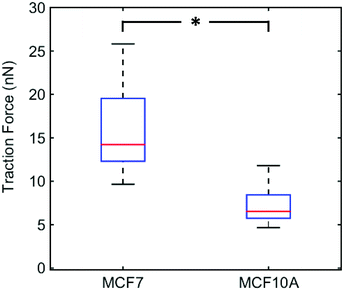
We plotted the average of the 5 maximum traction forces for individual MCF7 cells (n = 23) and MCF10A cells (n = 21) (Fig. 3). MCF7 cell maximum traction forces are significantly higher than MCF10A cell maximum traction forces. We chose to focus on the cell maximum forces in order to measure forces exerted by focal adhesions and not forces arising from friction of the cell on the nanowires during cell movement. The force magnitudes measured for MCF7 cells are in agreement with previous studies using elastomer micropillar arrays, around 15–25 nN.32 Adding the actin polymerization inhibitor cytochalasin B at a concentration that disrupts the actin stress fibers (Fig. S5†) results in significantly reduced traction forces for both cell lines (Fig. S6†). This shows that the measured forces are indeed mediated by actin and do not arise from artifacts or phototoxicity-induced cell shrinking.Our results indicate that MCF7 cancer cells exert greater traction forces than MCF10A normal-like cells. This is in line with a previous study showing that MCF10AT1 (premalignant cells) and MCF10CA1a (highly metastatic cells) exert higher forces compared to the non-tumorigenic MCF10A cells.
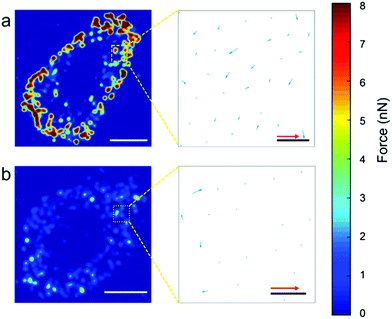
In order to assess the force distribution for each cell line, we used the nanowire coordinates to build force heat-maps, force direction maps (Fig. 4), heat-map movies (Movies S1 and S2†). Movies S3 and S4† show the evolution of both the force magnitude and direction for both cell types. For both cell types, most traction forces are exerted at the edge of the cells and are directed towards the cell center. Here, the heat maps confirms clearly that these forces are higher for MCF7 cancer cells than for MCF10A normal cells.
Next, we investigated how MCF7 and MCF10A maximum traction forces vary after treatment with an anticancer drug. For this purpose, we chose to use α-difluoromethylornithine (DFMO), which is an anticancer drug currently tested in clinical trials.33 DFMO is an irreversible inhibitor of ornithine decarboxylase, an enzyme involved in the synthesis of polyamines. An increase in intracellular polyamine levels has been linked to malignancy.34 DFMO treatment decreases cancer invasiveness both in cell migration assays and in vivo.35 DFMO was added to a final concentration of 5 mM to the medium of MCF7 and MCF10A cells and the effects on the traction forces were assessed after 48 hours of treatment. Note that the presence of nanowires is not expected to affect the uptake of DFMO since DFMO enters the cytosol by facilitated diffusion and since nanowires do not pierce the cell membrane.36,37 The traction forces were significantly decreased after DFMO treatment of the MCF7 cancer cells but not of the MCF10A cells (Fig. 5).
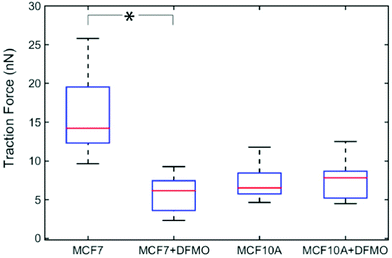 | ||
| Fig. 5 Effect of DFMO treatment on the traction forces of MCF7 (n = 13) and MCF10A (n = 13) cells. Average of five maximum forces. *p < 0.001 (multiway analysis of variance). | ||
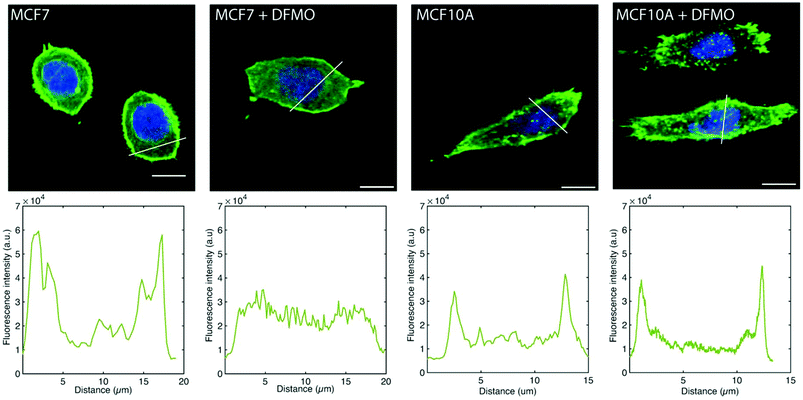
The MCF7 cell F-actin morphology is affected by DFMO treatment, which is not the case of MCF10A cells. Before DFMO treatment, MCF7 cells exhibit a strong F-actin cortex, as shown by the high F-actin fluorescence intensity at the cell edge. This cortex fluorescence appeared strongly weakened after DFMO treatment. In contrast, no striking changes in F-actin could be observed in MCF10A before and after DFMO treatment (Fig. 6).
The decrease in traction force is due, at least in part, to the disappearance of F-actin in DFMO-treated MCF7 cells, which in turn, could possibly be a consequence of a decrease in intracellular polyamine levels induced by DFMO treatment. Indeed, it has been shown that DFMO treatment of MCF7 cells results in decreased intracellular polyamine levels and reduced proliferative activity, which can be counteracted by the addition of the polyamine putrescine to the culture medium.38 Another study using polyamine-auxotrophic CHO cells showed that decreased intracellular polyamine levels, achieved by omitting the addition of putrescine to the medium, resulted in a disappearance of actin filaments and microtubules.39 The fact that the reduction in traction forces induced by DFMO treatment could partially be prevented by the addition of 1 μM of putrescine to the culture medium (Fig. S7–S9†) supports the notion that DFMO-induced polyamine depletion disrupts F-actin, resulting in decreased traction forces. It is not clear why MCF10A cells do not follow the same pattern as MCF7 cells. It could possibly be related to the difference in polyamine depleting effect of DFMO in the two cell lines.40,41
Conclusion
We use a vertical nanowire platform with inherently photoluminescent nanowire tips to measure cellular traction forces in situ with high precision. The detection of the nanowire tip position is facilitated by the fact that only the nanowire tip emits light and by the negligible bleaching of the tip luminescence. Global traction force detection at high spatial resolution is made possible thanks to an image analysis program which extracts the (x,y) position of each nanowire tip, for each time lapse image, enabling the large amount of data to be easily analyzed. Using this platform, we show that the traction forces exerted by MCF7 cancer cells are higher than the traction forces of MCF10A normal-like cells. We also show that the traction forces of MCF7 cancer cells are significantly decreased by the application of the anticancer drug DFMO through actin filament disruption due to decreased intracellular polyamine concentrations. Our results show that monitoring traction forces can shed light on the mechanism of action of anticancer compounds, at concentrations below those inducing cell death. Our assay is benign to cells and could constitute a complement to a number of assays such as cell proliferation and cell migration, used in the evaluation of potential anticancer drugs.Conflicts of interest
There are no conflicts of interest to declare.Acknowledgements
This study was funded by the Swedish Research Council (VR), NanoLund, The Crafoord Foundation, the China Scholarship Council (CSC), FP7-REA-GA 608153 (PhD4Energy) the Pufendorf Theme DATA, the Excellence Centers ELLIIT and eSSENCE and by a donation from Carolina LePrince with “Kalenderflickorna” and associated sponsors. The nanowire array fabrication was performed at Myfab, Lund Nano Lab. Confocal microscopy was performed at the Microscopy Facility at the Department of Biology, Lund University.References
- S. E. Cross, Y. S. Jin, J. Rao and J. K. Gimzewski, Nat. Nanotechnol., 2007, 2, 780–783 CrossRef CAS PubMed
.
- J. Guck, S. Schinkinger, B. Lincoln, F. Wottawah, S. Ebert, M. Romeyke, D. Lenz, H. M. Erickson, R. Ananthakrishnan, D. Mitchell, J. Käs, S. Ulvick and C. Bilby, Biophys. J., 2005, 88, 3689–3698 CrossRef CAS PubMed
.
- G. Zhang, M. Long, Z.-Z. Wu and W.-Q. Yu, World J. Gastroenterol., 2002, 8, 243–246 CrossRef PubMed
.
- A. N. Ketene, E. M. Schmelz, P. C. Roberts and M. Agah, Nanomedicine, 2012, 8, 93–102 CrossRef CAS PubMed
.
- W. J. Polacheck and C. S. Chen, Nat. Methods, 2016, 13, 415–423 CrossRef CAS PubMed
.
- P. K. Sahoo, R. Janissen, M. P. Monteiro, A. Cavalli, D. M. Murillo, M. V. Merfa, C. L. Cesar, H. F. Carvalho, A. A. de Souza, E. P. A. M. Bakkers and M. A. Cotta, Nano Lett., 2016, 16, 4656–4664 CrossRef CAS PubMed
.
- V. Peschetola, V. M. Laurent, A. Duperray, R. Michel, D. Ambrosi, L. Preziosi and C. Verdier, Cytoskeleton, 2013, 70, 201–214 CrossRef PubMed
.
- C. M. Kraning-Rush, J. P. Califano and C. A. Reinhart-King, PLoS One, 2012, 7(2), e32572 CAS
.
- T. M. Koch, S. Münster, N. Bonakdar, J. P. Butler and B. Fabry, PLoS One, 2012, 7(3), e33476 CAS
.
- M. Suggitt and M. C. Bibby, Clin. Cancer Res., 2005, 11, 971–981 CAS
.
- J. Lee, M. Leonard, T. Oliver, A. Ishihara and K. Jacobson, J. Cell Biol., 1994, 127, 1957–1964 CrossRef CAS PubMed
.
- N. Q. Balaban, U. S. Schwarz, D. Riveline, P. Goichberg, G. Tzur, I. Sabanay, D. Mahalu, S. Safran, A. Bershadsky, L. Addadi and B. Geiger, Nat. Cell Biol., 2001, 3, 466–472 CrossRef CAS PubMed
.
- H. Colin-York, D. Shrestha, J. H. Felce, D. Waithe, E. Moeendarbary, S. J. Davis, C. Eggeling and M. Fritzsche, Nano Lett., 2016, 16, 2633–2638 CrossRef CAS PubMed
.
- M. S. Hall, R. Long, X. Feng, Y. Huang, C. Y. Hui and M. Wu, Exp. Cell Res., 2013, 319, 2396–2408 CrossRef CAS PubMed
.
- J. L. Tan, J. Tien, D. M. Pirone, D. S. Gray, K. Bhadriraju and C. S. Chen, Proc. Natl. Acad. Sci. U. S. A., 2003, 100, 1484–1489 CrossRef CAS PubMed
.
- O. du Roure, A. Saez, A. Buguin, R. H. Austin, P. Chavrier, P. Silberzan and B. Ladoux, Proc. Natl. Acad. Sci. U. S. A., 2005, 102, 2390–2395 CrossRef CAS PubMed
.
- D. B. Suyatin, W. Hällström, L. Samuelson, L. Montelius, C. N. Prinz, M. Kanje, W. Hällström, L. Samuelson, L. Montelius, C. N. Prinz and M. Kanje, J. Vac. Sci. Technol., B: Microelectron. Nanometer Struct. – Process., Meas., Phenom., 2009, 27, 3092–3094 CrossRef CAS
.
- Z. Li, J. H. Song, G. Mantini, M. Y. Lu, H. Fang, C. Falconi, L. J. Chen and Z. L. Wang, Nano Lett., 2009, 9, 3575–3580 CrossRef CAS PubMed
.
- W. Hällström, M. Lexholm, D. B. Suyatin, G. Hammarin, D. Hessman, L. Samuelson, L. Montelius, M. Kanje and C. N. Prinz, Nano Lett., 2010, 10, 782–787 CrossRef PubMed
.
- C. N. Prinz, J. Phys.: Condens. Matter, 2015, 27, 233103 CrossRef PubMed
.
- K. Adolfsson, H. Persson, J. Wallentin, S. Oredsson, L. Samuelson, J. O. Tegenfeldt, M. T. Borgstrom and C. N. Prinz, Nano Lett., 2013, 13, 4728–4732 CrossRef CAS PubMed
.
- K. Mattsson, K. Adolfsson, M. T. Ekvall, M. T. Borgström, S. Linse, L.-A. Hansson, T. Cedervall and C. N. Prinz, Nanotoxicology, 2016, 10, 1160–1167 CrossRef CAS PubMed
.
- J. Oracz, K. Adolfsson, V. Westphal, C. Radzewicz, M. T. Borgström, S. J. Sahl, C. N. Prinz and S. W. Hell, Nano Lett., 2017, 17, 2652–2659 CrossRef CAS PubMed
.
- J. Wallentin, M. Ek, L. R. Wallenberg, L. Samuelson, K. Deppert and M. T. Borgström, Nano Lett., 2010, 10, 4807–4812 CrossRef CAS PubMed
.
- I. F. Sbalzarini and P. Koumoutsakos, J. Struct. Biol., 2005, 151, 182–195 CrossRef CAS PubMed
.
- K. Åström and A. Heyden, Adv. Appl. Probab., 1999, 31, 855–894.
- O. Enqvist, E. Ask, F. Kahl and K. Åström, Lecture Notes in Computer Science, 2012, 7572, 738–751.
- O. Enqvist, E. Ask, F. Kahl and K. Åström, Int. J. Comput. Vis., 2015, 112, 115–129 CrossRef
.
- K. Åström, J. Karlsson, O. Enqvist, A. Ericsson and F. Kahl, Lecture Notes in Computer Science, 2007, 4522, 21–30.
- J. Karlsson and K. Åström, International Conference on Pattern Recognition, 1998, pp. 3249–3253.
- J. Karlsson and K. Åström, IEEE Computer Society Conference on Computer Vision and Pattern Recognition Workshops, 2008, pp. 999–1006.
- H. Van Hoorn, R. Harkes, E. M. Spiesz, C. Storm, D. Van Noort, B. Ladoux and T. Schmidt, Nano Lett., 2014, 14, 4257–4262 CrossRef CAS PubMed
.
- ClinicalTrials.gov (Identifier NCT01586260) .
- A. Manni, S. Washington, J. W. Griffith, M. F. Verderame, D. Mauger, L. M. Demers, R. S. Samant and D. R. Welch, Clin. Exp. Metastasis, 2002, 19, 95–105 CrossRef CAS PubMed
.
- D. L. T. Koomoa, D. Geerts, I. Lange, J. Koster, A. E. Pegg, D. J. Feith and A. S. Bachmann, Int. J. Oncol., 2013, 42, 1219–1228 CrossRef CAS PubMed
.
- T. Berthing, S. Bonde, K. R. Rostgaard, M. H. Madsen, C. B. Sorensen, J. Nygard and K. L. Martinez, Nanotechnology, 2012, 415102 CrossRef PubMed
.
- H. Persson, C. Købler, K. Mølhave, L. Samuelson, J. O. Tegenfeldt, S. Oredsson and C. N. Prinz, Small, 2013, 9, 4006–4016 CrossRef CAS PubMed
.
- M. Cervelli, S. Pietropaoli, F. Signore, R. Amendola and P. Mariottini, Breast Cancer Res. Treat., 2014, 148, 233–248 CrossRef CAS PubMed
.
- P. Pohjanpelto, I. Virtanen and E. Hölttä, Nature, 1981, 293, 475–477 CrossRef CAS PubMed
.
- P. Glikman, A. Manni, L. M. Demers and M. Bartholomew, Cancer Res., 1989, 49, 1371–1376 CAS
.
- T. M. Silva, H. Cirenajwis, H. M. Wallace, S. Oredsson and L. Persson, Amino Acids, 2015, 47, 1341–1352 CrossRef CAS PubMed
.
Footnotes |
| † Electronic supplementary information (ESI) available. See DOI: 10.1039/c7nr06284b |
| ‡ Present address: Translational & Bioengineering Program, Mechanical and Industrial Engineering, University of Toronto, M5G 1M1 ON Toronto, Canada. |
| This journal is © The Royal Society of Chemistry 2017 |

