
 Open Access Article
 This Open Access Article is licensed under a
 Creative Commons Attribution 3.0 Unported Licence
An engineering approach to synthesis of gold and silver nanoparticles by controlling hydrodynamics and mixing based on a coaxial flow reactor†
Razwan
Baber
a,
Luca
Mazzei
a,
Nguyen Thi Kim
Thanh
 *bc and
Asterios
Gavriilidis
*a
*bc and
Asterios
Gavriilidis
*a
aDepartment of Chemical Engineering, University College London, Torrington Place, London, WC1E 7JE, UK. E-mail: a.gavriilidis@ucl.ac.uk
bBiophysics Group, Department of Physics and Astronomy, University College London, Gower Street, London WC1E 6BT, UK. E-mail: ntk.thanh@ucl.ac.uk
cUCL Healthcare Biomagnetic and Nanomaterials Laboratories, 21 Albemarle Street, London W1S 4BS, UK
First published on 14th September 2017
Abstract
In this work we present a detailed study of flow technology approaches that could open up new possibilities for nanoparticle synthesis. The synthesis of gold and silver nanoparticles (NPs) in a flow device based on a coaxial flow reactor (CFR) was investigated. The CFR comprised of an outer glass tube of 2 mm inner diameter (I.D.) and an inner glass tube whose I.D. varied between 0.142 and 0.798 mm. A split and recombine (SAR) mixer and coiled flow inverter (CFI) were further employed to alter the mixing conditions after the CFR. The ‘Turkevich’ method was used to synthesize gold NPs, with a CFR followed by a CFI. This assembly allows control over nucleation and growth through variation of residence time. Increasing the total flow rate from 0.25 ml min−1 to 3 ml min−1 resulted initially in a constant Au NP size, and beyond 1 ml min−1 to a size increase of Au NPs from 17.9 ± 2.1 nm to 23.9 ± 4.7 nm. The temperature was varied between 60–100 °C and a minimum Au NP size of 17.9 ± 2.1 nm was observed at 80 °C. Silver NPs were synthesized in a CFR followed by a SAR mixer, using sodium borohydride to reduce silver nitrate in the presence of trisodium citrate. The SAR mixer provided an enhancement of the well-controlled laminar mixing in the CFR. Increasing silver nitrate concentration resulted in a decrease in Ag NP size from 5.5 ± 2.4 nm to 3.4 ± 1.4 nm. Different hydrodynamic conditions were studied in the CFR operated in isolation for silver NP synthesis. Increasing the Reynolds number from 132 to 530 in the inner tube created a vortex flow resulting in Ag NPs in the size range between 5.9 ± 1.5 nm to 7.7 ± 3.4 nm. Decreasing the inner tube I.D. from 0.798 mm to 0.142 mm resulted in a decrease in Ag NP size from 10.5 ± 4.0 nm to 4.7 ± 1.4 nm. Thus, changing the thickness of the inner stream enabled control over size of the Ag NPs.
Introduction
Controlling the size of nanoparticles (NPs) has been the focus of many studies, because the size determines the properties that the NPs will display. Microfluidic devices have shown promise in controlling size mainly because of the flexibility they offer in controlling mass transfer as compared to batch reactors.1 More specifically, flow devices allow the user to tune flow rates to change mass transfer conditions and residence time, as well as a more precise control over the timing of reagent addition. Another benefit is the possibility for a greater separation between nucleation and growth of NPs because of the spatio-temporal separation that can be obtained in a flow channel.2 These properties are beneficial for the controlled synthesis of NPs. For instance, controlling the supply of monomers for nucleation and growth (mass transfer) and separating these phases (spatio-temporal separation) are both requirements for size control and monodispersity.3 Because of these perceived benefits, this study focuses on a variety of flow configurations employing a coaxial flow reactor (CFR) and other microfluidic devices to investigate the effect of such varied mass transfer conditions on the size and dispersity of the NPs.There are many studies in the literature on the batch synthesis of gold and silver NPs. Two common synthesis methods were used in this study: the well-known Turkevich synthesis for gold NPs4 and the reduction of silver nitrate via sodium borohydride in the presence of trisodium citrate for silver NPs.
The Turkevich method for synthesising gold NPs is perhaps the most common, and there are many studies in which batch reactors were used.5–23 Flow syntheses of gold NPs using the Turkevich method are much less common. Ftouni et al. synthesized gold NPs with the Turkevich method using a fused silica capillary and a T-mixer to mix chloroauric acid to sodium citrate prior to introducing them into the heated capillary.24 Residence times within the capillary were varied between 35 to 94 s and they obtained NPs in the size range between 1.5 and 3 nm, with larger NPs obtained at longer residence times. A minimum size of NPs was found at 3.15 ratio of citrate to gold. The temperature effect was investigated, and NP size decreased with increasing temperature in the range between 60 and 100 °C. Sugano et al. synthesized gold nanoparticles in the size range 10–45 nm using a Y-type micromixer with a pulsed flow of chloroauric acid and sodium citrate to mix the reagents within a small channel at room temperature.25 The mixing efficiency was altered by adjusting the pulsing rate between 50![[thin space (1/6-em)]](https://www.rsc.org/images/entities/char_2009.gif) 100 and 200 Hz. The NP size increased with a higher pulsing frequency, suggesting faster mixing resulted in larger NPs. Chen-Hsun et al. synthesized gold NPs using the Turkevich method in a novel microfluidic device.26 Hexagonal NPs of around 35 nm were obtained at a temperature of 115 °C with reaction time in the order of 2 to 5 min. There are also various studies in which gold NPs were synthesized with methods other than that of Turkevich in flow reactors.27–31
100 and 200 Hz. The NP size increased with a higher pulsing frequency, suggesting faster mixing resulted in larger NPs. Chen-Hsun et al. synthesized gold NPs using the Turkevich method in a novel microfluidic device.26 Hexagonal NPs of around 35 nm were obtained at a temperature of 115 °C with reaction time in the order of 2 to 5 min. There are also various studies in which gold NPs were synthesized with methods other than that of Turkevich in flow reactors.27–31
Silver NPs are commonly synthesized in batch with sodium borohydride used to reduce the silver precursor.32–37 Split and recombine (SAR) mixer type reactors38 and PTFE chambers39 have been utilised to synthesise silver NPs in flow using borohydride, obtaining NPs in the range of 10–20 nm for borohydride to silver nitrate ratios ranging from 3 to 40. We have also previously used the CFR and an impinging jet reactor for synthesis of silver NPs using borohydride as a reducing agent.40,41
The CFR has been used to synthesise a variety of different nanoparticles such as titania,42 zirconia,43 iron oxide,44–46 polymer,47–49 nickel,50 palladium51 and gallium nitride.52 It works on the basis of a cylindrical inner stream of reagent that is sheathed by an outer stream of reagent, creating a reaction interface between the streams (see Fig. 1).
 | ||
| Fig. 1 Schematic representations of components used in the microfluidic flow setup; a: coaxial flow reactor (CFR), b: coiled flow inverter (CFI) and c: split and recombine (SAR) mixer. | ||
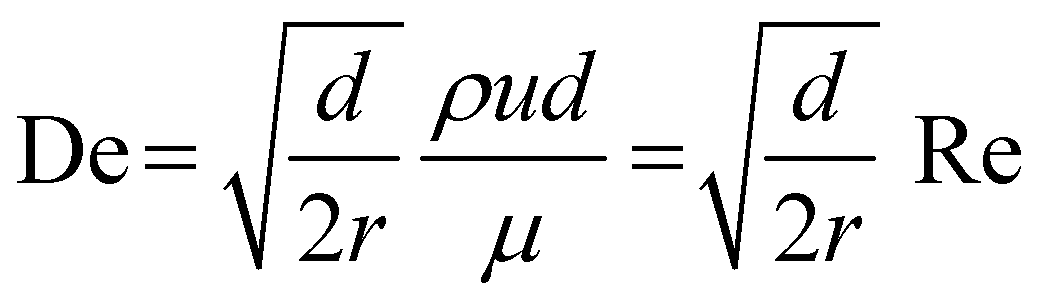
The coiled flow inverter (CFI) (see Fig. 1) is primarily used as a heat transfer device in the literature,53,54 but can be used as an inline mixer.55 It offers an improved residence time distribution,56 which is beneficial for the synthesis of NPs. This improvement arises from enhanced radial mass transfer due to secondary flow developing within a helically coiled channel, known as ‘Dean flow’. This is characterized by the Dean number:
The SAR mixer can be categorized as a serial lamination device (see Fig. 1). It improves mixing by reducing the diffusion distance between streams by continuously splitting and recombining the flow into thinner and thinner interdigitated lamellae. SAR mixers have been employed for the synthesis of gold and silver NPs.27,28,38 Parallel lamination devices are similar to serial lamination, but the reduction in diffusion distance is done in one step rather than multiple ones, and these have also been used for the synthesis of NPs.29,31
In this study, a variety of flow configurations were used for the synthesis of gold and silver NPs, with the focal point being the CFR. The configurations employed added an extra component following the CFR for a specific purpose. Flow components that were used in conjunction with the CFR were: a CFI for the synthesis of Au NPs using a ‘Turkevich’ recipe where tetrachlorauric acid and trisodium citrate are mixed and heated, and a SAR mixer for the synthesis of Ag NPs through reduction of silver nitrate by sodium borohydride in the presence of trisodium citrate. For the synthesis of Ag NPs, we also used the CFR alone, altering the hydrodynamics within it. For the gold system, the effect of flow rate (or residence time) and temperature on Au NP size and dispersity were investigated. For the silver system, the effect of silver precursor concentration on the Ag NP size and dispersity was investigated using the CFR with the SAR mixer. Using the CFR in isolation, the silver NP synthesis was performed at high Reynolds number to study the effect of hydrodynamics on Ag NP size and dispersity. The effect of changing the internal diameter of the inner tube in a laminar flow regime (to reduce the diffusion distance of the inner stream) on Ag NP size and dispersity was also investigated.
Methodology
Chemicals
Silver nitrate (AgNO3, 0.01 M stock solution), trisodium citrate (HOC(COONa)(CH2COONa)2·2H2O), powder form, sodium borohydride solution (NaBH4, ∼12 wt% in 14 M NaOH stock solution) and gold(III) chloride hydrate (HAuCl4·xH2O, powder form) were obtained from Sigma. All chemicals were used without further purification and solutions were prepared with ultrapure water (resistivity 15.0 MΩ cm). They were delivered using syringe pumps (Pump 11 Elite OEM module, Harvard).Experimental setup
The setup schematic for gold NP synthesis using the CFR followed by a CFI acting as a residence time loop can be seen in Fig. 2. The CFR consisted of a 0.798 mm internal diameter (I.D.) inner glass tube (1.09 mm external diameter) and a 2 mm I.D. outer glass tube. The length from the outlet of the inner tube to the outlet of the CFR was 21 mm. The capillaries were connected using an ETFE (ethylene tetrafluoroethylene) T-piece connector (0.5 mm through-hole, Upchurch Scientific), which was drilled to a diameter of 2 mm to allow the inner tube to be inserted into the outer tube. Downstream, the CFR was connected to the CFI by using an ETFE union (0.75 mm through-hole, Upchurch Scientific). The CFI was 1 mm I.D. PTFE (polytetrafluoroethylene) tubing that had nineteen 90° bends with 20 arms, each arm consisting of 5.5 coils for a total length of 3.5 m and volume 2.75 ml (including entrance and exit length of tubing). The coils had an axial pitch of 3 mm, while the coil diameter was 8 mm. The coils were fabricated by drilling 1.6 mm holes into a PTFE plate (2 mm thickness, Direct Plastics Ltd) and the PTFE tubing was threaded through these holes, which were arranged to result in coiling with the dimensions stated above. The CFR and CFI were immersed in a glycerol bath (GR150, Grant Instruments) with temperature being varied between 60–100 °C. The tetrachloroauric acid was fed through a preheating CFI consisting of four 90° bends and similar axial pitch and coil diameter as the CFI described above to ensure it came into contact with the trisodium citrate at the desired temperature. The outlet of the CFI was split to a waste container and a sample container. These containers were pressurized using nitrogen gas and a backpressure regulator (Swagelok K series, pressure range 0–10 bar), which was set to 2 bars to prevent vaporization of water within the reactor.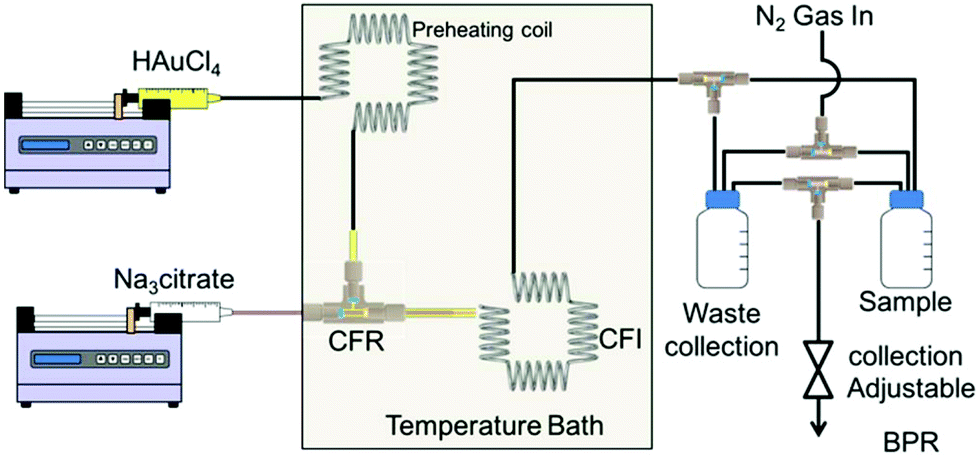 | ||
| Fig. 2 Schematic representation of the experimental setup for gold NP synthesis. | ||
The setup schematics for the synthesis of silver NPs can be seen in Fig. 3. The CFR used was similar to that in the gold NP synthesis, but the length from the inner tube outlet to the outlet of the CFR was 130 mm (a longer length was used for additional residence time) while the inner tube I.D. used was between 0.142 mm and 0.798 mm. A glass SAR mixer (Micromixer chip, Dolomite microfluidics) was placed downstream of the CFR in order to enhance the mixing by laminating the stream into thinner striations. The SAR mixer had an internal channel diameter of 0.125 mm × 0.35 mm (depth × width) of the main channel and 0.05 mm × 0.125 mm of the secondary channels responsible for splitting the flow. The internal volume was 8 μl. The CFR was connected to the SAR mixer using an ETFE union (0.75 mm through-hole, Upchurch Scientific). Following the SAR mixer, a 10 cm long 1 mm I.D. PTFE tube delivered the silver NPs to the sample container.
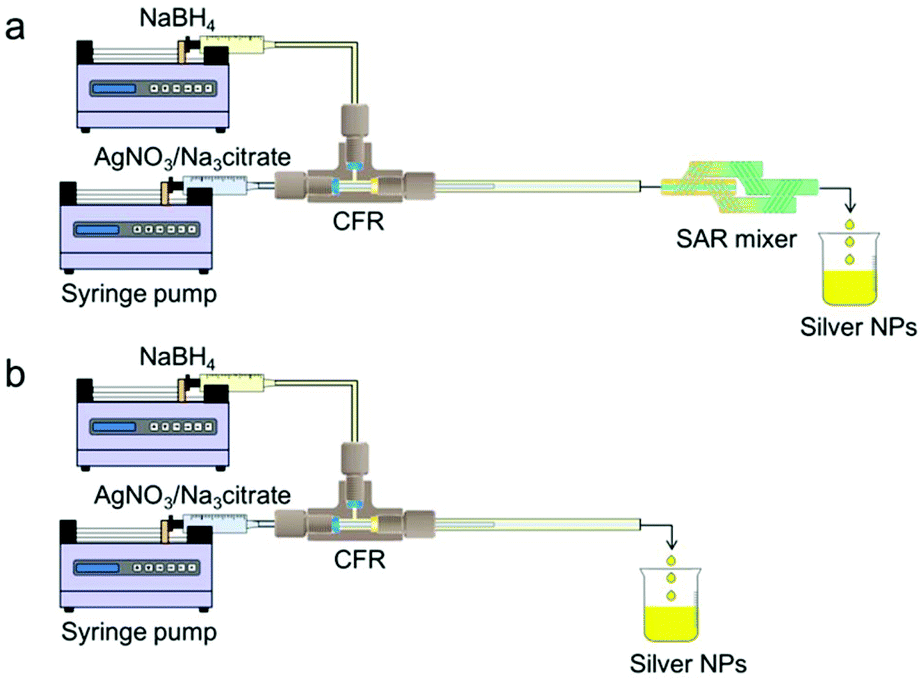 | ||
| Fig. 3 Schematic representation of the experimental setup for silver NP synthesis: (a) CFR used in conjunction with SAR mixer and (b) CFR used in isolation. | ||
Nanoparticle synthesis
For the gold NP synthesis, initially the reactor setup was filled with tetrachloroauric acid before the system was pressurised using nitrogen gas and a backpressure regulator set to 2 bar. The reactor setup was then immersed in the temperature bath (60–100 °C). The trisodium citrate and tetrachloroauric acid solutions were diluted to the appropriate concentrations and pumped through the inner and outer streams of the CFR respectively. It was found that filling the reactor with tetrachloroauric acid prior to synthesis reduced the amount of fouling drastically. The reactor was then operated at the appropriate flow rate, and one reactor volume was allowed to pass through at high temperature and collected in the waste container before the outlet of the CFI was switched to sample collection to collect 10 ml of sample. Small amounts of fouling towards the end of the CFI were observed when the reactor was operated at a flow rate of 0.25 ml min−1. The acidity of tetrachloroauric acid is buffered by the trisodium citrate, resulting in an increase in pH (around 6.5) when the reagents are mixed. The fouling observed at the lowest flow rate was suspected to be because the long residence time enabled citrate to diffuse through the boundary layer at the channel walls, increasing pH in this area. The surface charge of the PTFE channel wall at pH 3.5 is close to zero,58 which is coincidentally around the pH of the tetrachloroauric acid (0.557 mM). The surface charge of the PTFE channel wall would be negative in the pH range near neutral (which is the pH when mixing citrate and tetrachlorauric acid at these concentrations). If NPs nucleate on the channel walls, a negative surface charge would attract positive Au ions or any NPs which have positive surface charge (NPs that have precursor adsorbed onto the surface would have a positive surface charge). This may cause fouling to propagate as a high concentration of positive ions or positive surface charge NPs would be attracted to the wall and cause growth. Thus, it is beneficial to allow a small layer of tetrachloroauric acid to remain at the wall to keep the surface charge neutral. In laminar flow, the layer will remain for some length before citrate diffuses near the wall because of the flow profile and no-slip condition at the reactor walls. This is evidenced by small amounts of fouling only occurring at 0.25 ml min−1 where the relative residence time is longer.For the silver NP synthesis, silver nitrate and trisodium citrate solutions were premixed to the appropriate concentration and pumped through the inner stream. Sodium borohydride/sodium hydroxide solution was diluted to the appropriate concentration and pumped through the outer stream of the CFR. Sodium borohydride was stored in 14 M sodium hydroxide; hence, the concentration of sodium hydroxide was 3.21 times higher than the stated sodium borohydride concentration in all cases. Sodium hydroxide suppresses the hydrolysis of sodium borohydride in water because of the elevated pH.59 Hydrolysis would be problematic because it produces hydrogen gas, which would cause gas bubbles in flow. Bubbles would alter the hydrodynamics of the flow. Silver NP syntheses were carried out at room temperature (22–24 °C). All concentrations are those at the inlets before any mixing of reagents occurs, unless stated otherwise.
Characterisation of nanoparticles
NPs were analysed using a UV-Vis spectrometer (USB 2000+ Spectrometer and DT-Mini-2-GS light source, Ocean Optics). Silver NPs were analysed within an hour of synthesis (the signal of the samples were stable in this window of time). Gold NPs were analysed over time and were analysed once the signal was stable. The signal became stable usually after 1–2 days because of a slow transition from deep purple to ruby red. This transition is the result of the slow reduction of remaining tetrachloroauric acid at the surface of the gold NPs at the elevated pH (around 6.5) and room temperature. NP samples were diluted with additional ultrapure water to bring the absorbance into a suitable range (i.e. obeying the Beer–Lambert law and avoiding saturation of the light detector) if necessary, and the data were normalized so that the maximum absorbance in the particular set of experiments was 1. Transmission electron microscope images were captured using a JEOL 1200 EX ii microscope with a 120 kV acceleration voltage. Carbon coated copper TEM grids were prepared within an hour of synthesis for silver NPs and when the sample was stable for gold NPs by pipetting a 5 μl sample onto the grid and allowing it to dry at room temperature. Particle size distributions (insets for each TEM image presented) have the following nomenclature: d is the average diameter, δd is the standard deviation of the NP distribution and n is the number of particles counted to obtain the particle size distribution. Differential centrifugal sedimentation analysis (CPS disc centrifuge UHR, Analytik) was carried out on gold NPs when the samples were stable. This technique relies on the use of Stokes’ law to determine the size distribution of particles by measuring the velocity of the particles under a centrifugal force in a fluid of known viscosity and density.Results and discussion
Effect of flow rate on gold nanoparticle size and dispersity
The effect that the flow rate has on the gold NPs was investigated in the CFR with an inner tube I.D. of 0.798 mm and an outer tube I.D. of 2 mm. The concentration of trisodium citrate was 0.09 M through the inner tube; the concentration of tetrachlorauric acid was 0.557 mM through the outer tube. The volumetric flow rate ratio was fixed at 32.3:1 (Qout:Qin) and the total flow rate was varied between 0.25 and 3 ml min−1. This resulted in a residence time of 0.92–11 min. The molar flow rate ratio was 1:5 (HAuCl4:Na3citrate). The Reynolds number varied between 2.64 and 31.7 in the CFR and between 5.28 and 63.4 in the CFI. The Dean number ranged from 1.87 to 22.4 in the CFI, which is above the threshold of 1.5 required for fully developed Dean flow.56
Fig. 4 shows TEM images of gold NPs synthesized at a flow rate of 0.25, 0.5, 0.75, 1, 1.5, 2 and 3 ml min−1 where the average diameter and dispersity of the NPs are 18.9 ± 2.3 nm, 18.4 ± 2.8 nm, 19.7 ± 2.4 nm, 17.9 ± 2.1 nm, 20.6 ± 7.2 nm, 21.7 ± 3.3 nm and 23.9 ± 4.7 nm respectively. Fig. 5 shows corresponding differential scanning calorimetry (DCS) measurements, where the average diameter is 16.7 ± 2.8 nm, 15.1 ± 3.6 nm, 16.4 ± 3.0 nm, 14.9 ± 2.3 nm, 18.5 ± 3.1 nm, 22.5 ± 3.8 nm and 26.4 ± 4.0 nm respectively. The trend of the average diameter of the NPs matches that observed from TEM images. Fig. 6 shows UV-Vis spectra of the gold NPs. Experiments at selected flow rates were repeated three times and analysed using DCS (shown in ESI, Fig. S1†).
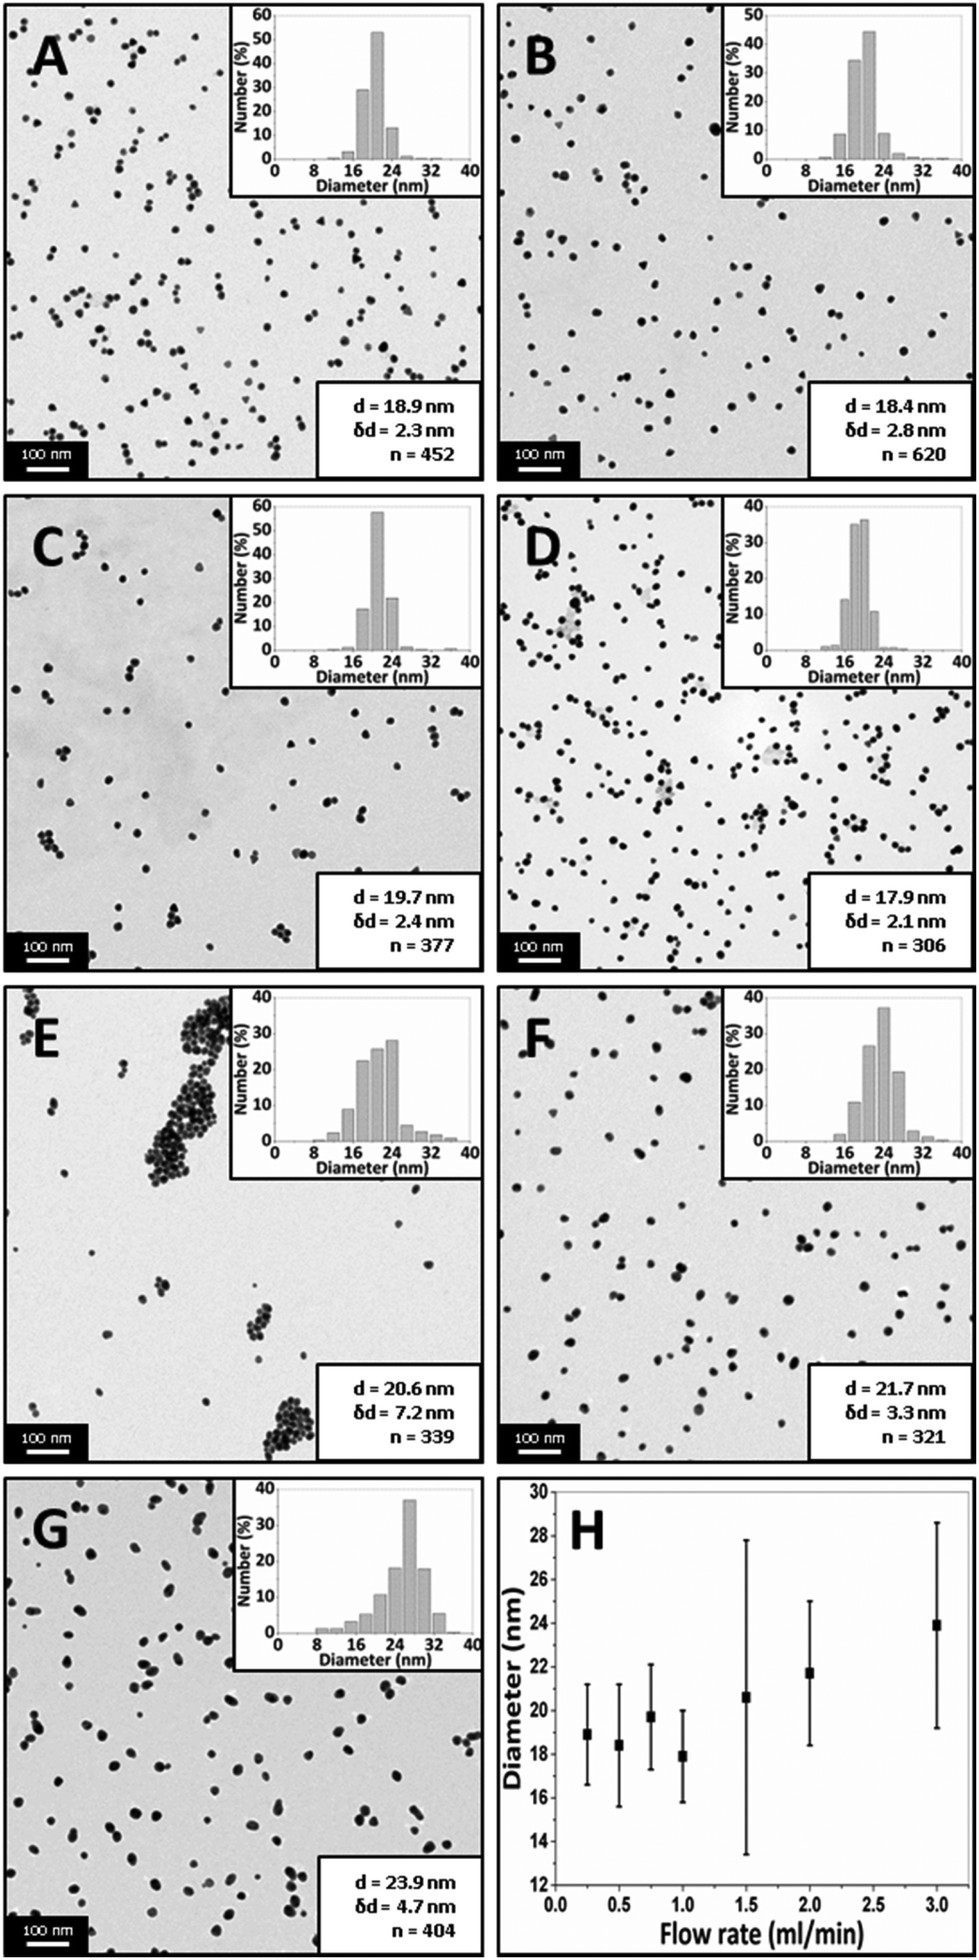 | ||
| Fig. 4 TEM images of gold NPs synthesized using the CFR with a CFI residence loop at a total flow rate of A: 0.25 ml min−1, B: 0.5 ml min−1, C: 0.75 ml min−1, D: 1 ml min−1, E: 1.5 ml min−1, F: 2 ml min−1 and G: 3 ml min−1. H: Average diameter of gold NPs vs. total flow rate (bars represent standard deviation of the size). Concentration of tetrachloroauric acid, 0.557 mM; concentration of trisodium citrate, 0.09 M; volumetric ratio, 32.3:1 (Qout:Qin, HAuCl4:Na3citrate); molar flow rate ratio, 1:5 (HAuCl4:Na3citrate); temperature, 80 °C. | ||
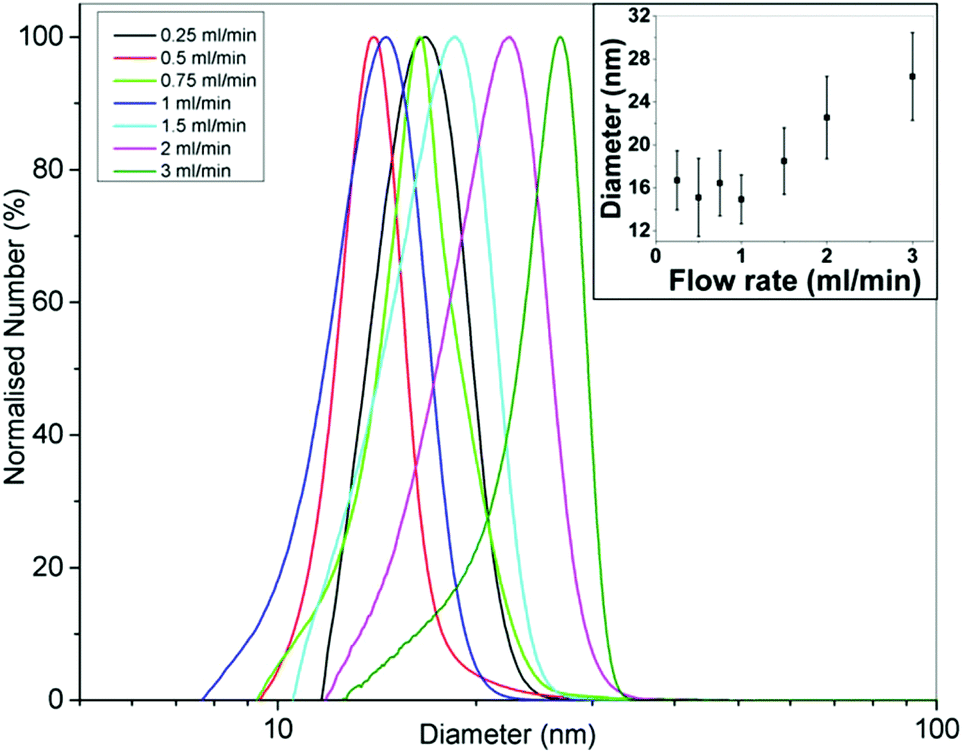 | ||
| Fig. 5 Normalised DCS curves of gold NPs synthesized using the CFR with a CFI residence loop at flow rates between 0.25 and 3 ml min−1. Inset: Diameter of gold NPs vs. total flow rate (bars represent standard deviation of size). Concentration of tetrachloroauric acid, 0.557 mM; concentration of trisodium citrate, 0.09 M; volumetric ratio, 32.3:1 (Qout:Qin, HAuCl4:Na3citrate); molar flow rate ratio, 1:5 (HAuCl4:Na3citrate); temperature, 80 °C. | ||
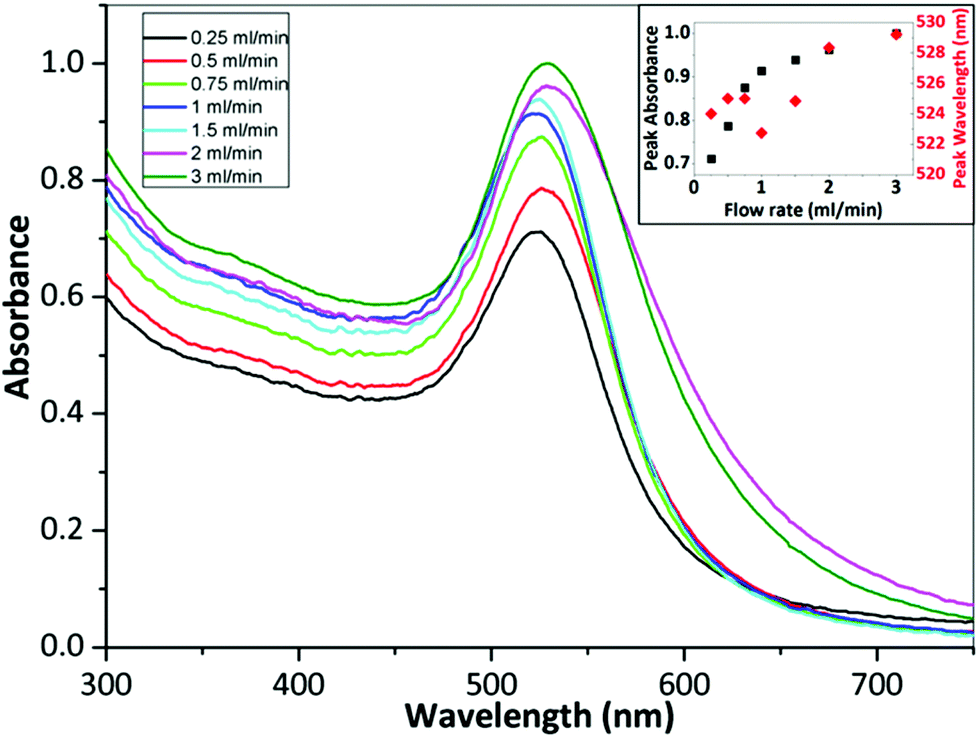 | ||
| Fig. 6 UV-Vis spectra of gold NPs synthesized using the CFR with a CFI residence loop at flow rates between 0.25 and 3 ml min−1. Inset: Peak absorbance (black squares) and peak wavelength (red diamonds) of gold NPs vs. total flow rate. Concentration of tetrachloroauric acid, 0.557 mM; concentration of trisodium citrate, 0.09 M; volumetric flow rate ratio, 32.3:1 (Qout:Qin, HAuCl4:Na3citrate); molar flow rate ratio, 1:5 (HAuCl4:Na3citrate); temperature, 80 °C. | ||
The average size of the NPs obtained with flow rates 0.25–1 ml min−1 changes minimally according to the TEM and DCS analysis (although t-tests show that all PSDs are statistically different to a significance value of at least 0.05). The molar extinction coefficient increases with size for gold NPs,60,61 and therefore, for a constant number concentration of NPs, an increase in peak absorbance would indicate increasing size. However, the number concentration of NPs of changing size would change for a constant gold concentration i.e. larger NPs synthesized at the same gold concentration would have a lower number concentration. Hendel et al. showed that the absorbance at 400 nm of citrate capped gold NPs in the 15–30 nm range increases linearly with increasing size for a constant gold concentration.62 This suggests a larger size has a more significant effect on the absorbance than the number concentration of NPs. Fig. 6 shows that there is an increase in the absorbance at 400 nm with increasing flow rate but it is unlikely this is because of increasing size since TEM and DCS show a relatively constant size in the 0.25–1 ml min−1 range. The peak wavelength should redshift with increasing size,60 but the wavelength changes minimally between 523–525 nm further suggesting there is a minimal change in size. A possible explanation for the increase in absorbance up to 1 ml min−1 may be related to fouling. Fouling was observed at the lowest flow rate. This may explain the decrease in absorbance at lower flow rates (despite a constant NP size), since some of the gold remained within the reactor. Increasing the flow rate from 1.5 ml min−1 to 3 ml min−1 shows an increase in the size of the NPs from 20.6 to 23.9 nm according to TEM analysis, and from 18.5 to 26.4 nm according to DCS analysis. The peak absorbance increases with increasing flow rate in this range while the peak wavelength increases from 525 to 529 nm. This indicates an increase in the size of the NPs, consistent with DCS and TEM data.
The data shows that the size stays fairly constant between 0.25 and 1 ml min−1 and thereafter increases up to a flow rate of 3 ml min−1. This can be rationalized as follows. In the CFR section, there is a laminar flow where the outer flow of tetrachloroauric acid focuses the inner flow of trisodium citrate. There is little mixing in this region. Mass transfer occurs through diffusion at the interface between the two streams. In the more acidic conditions of the tetrachloroauric acid stream, the reaction rate is faster and nucleation is favored. In the more basic conditions of the trisodium citrate stream, the reaction rate is slower. This is because of the speciation of the precursor: in acidic conditions the speciation is favored towards [AuCl4]−,11,17,21 whereas in more basic conditions the speciation passes through various forms from [AuCl3(OH)]− to [Au(OH)4]−. As the gold species acquire more hydroxyl ions, the reactivity decreases and there is a transition from nucleation of gold atoms into clusters to growth of gold onto existing clusters. In the CFR region of the reactor, the tetrachloroauric acid and the trisodium citrate remain well separated and only exchange material through diffusion at the interface. In this region, a higher reaction rate and hence nucleation will occur in the tetrachloroauric acid stream. Therefore, the CFR behaves as a nucleation section. Further along in the CFI residence loop, the streams are subjected to Dean flow and flow inversion. These effects enhance the mixing and lower the reduction rate of gold ions, hence transitioning from the nucleation section in the CFR to a growth section in the CFI. A longer nucleation period would result in smaller NPs. In this study, there is a marked increase in the size of the NPs as the flow rate increases past 1 ml min−1, supporting the hypothesis of nucleation dominating in the CFR, since, at higher flow rates, reaction at the interface of streams does not persist as long. There is a limitation on size reduction when operating below 1 ml min−1, which may be related to a decrease in citrate concentration. The decrease in citrate concentration would result in a decrease in reduction of gold precursor, leading to a suppression of nucleation within the CFR section.
The shape of the NPs synthesized at higher flowrates (3 ml min−1) deviated from spherical, indicating that when nucleation is suppressed faster, the growth process (which continues after the sample has been collected) encourages an irregular shape. Higher magnification images can be seen in the ESI (Fig. S2†). The number concentration of the NPs can be obtained from DCS data and is shown in the ESI (Fig. S3†). The number concentration increases to a maximum at 1 ml min−1 and then drops significantly at higher flow rates. Nucleation rate should be higher at lower flow rates; however, the lower number concentration at the lowest flow rates is likely because of the increased likelihood of fouling, which reduces the concentration. At higher flow rates the nucleation rate is lower, resulting in a lower number concentration according to DCS. The flow rate is suggested to influence the nucleation rate because of the residence time within the CFR. As discussed, conditions in the CFR are conducive to nucleation, therefore a longer residence time within the CFR should result in a longer period of nucleation. This leads to smaller NPs. The gold NPs synthesised at 1 ml min−1 show an apparent optimum in number concentration between sufficiently low amount of fouling and sufficiently high nucleation rate.
Effect of temperature on gold nanoparticle size and dispersity
The effect that the temperature has on gold NPs synthesis was investigated in the CFR with an inner tube internal I.D. of 0.798 mm and an outer tube internal I.D. of 2 mm. The concentration of trisodium citrate was 0.09 M through the inner tube, while the concentration of tetrachlorauric acid was 0.557 mM through the outer tube. The volumetric flow rate ratio was fixed 32.3:1 (Qout:Qin) and the total flow rate was fixed at 1 ml min−1. The molar flow rate ratio was 1:5 (HAuCl4:Na3citrate). The Reynolds number in the CFR was 10.6 and in the CFI was 21.1. In the CFI, the Dean number was 7.47.
Fig. 7 shows TEM images of gold NPs synthesized at a temperature of 60, 70, 80, 90 and 100 °C where the average diameter and dispersity of the NPs are 25.5 ± 5.7 nm, 22.7 ± 3.9 nm, 17.9 ± 2.1 nm, 18.6 ± 2.1 nm and 19.4 ± 2.4 nm respectively. T-tests for the PSDs showed p-values of <0.001 when comparing all PSDs, indicating statistical difference to a significance level of 0.001. Fig. 8 shows corresponding DCS measurements, where the average diameter is 31.1 ± 5.5 nm, 18.4 ± 3.8 nm, 14.9 ± 2.3 nm, 16.2 ± 3.4 nm and 17.6 ± 2.7 nm respectively. The trend of the average diameter of the NPs matches that observed in the TEM images. Fig. 9 shows corresponding UV-Vis spectra.
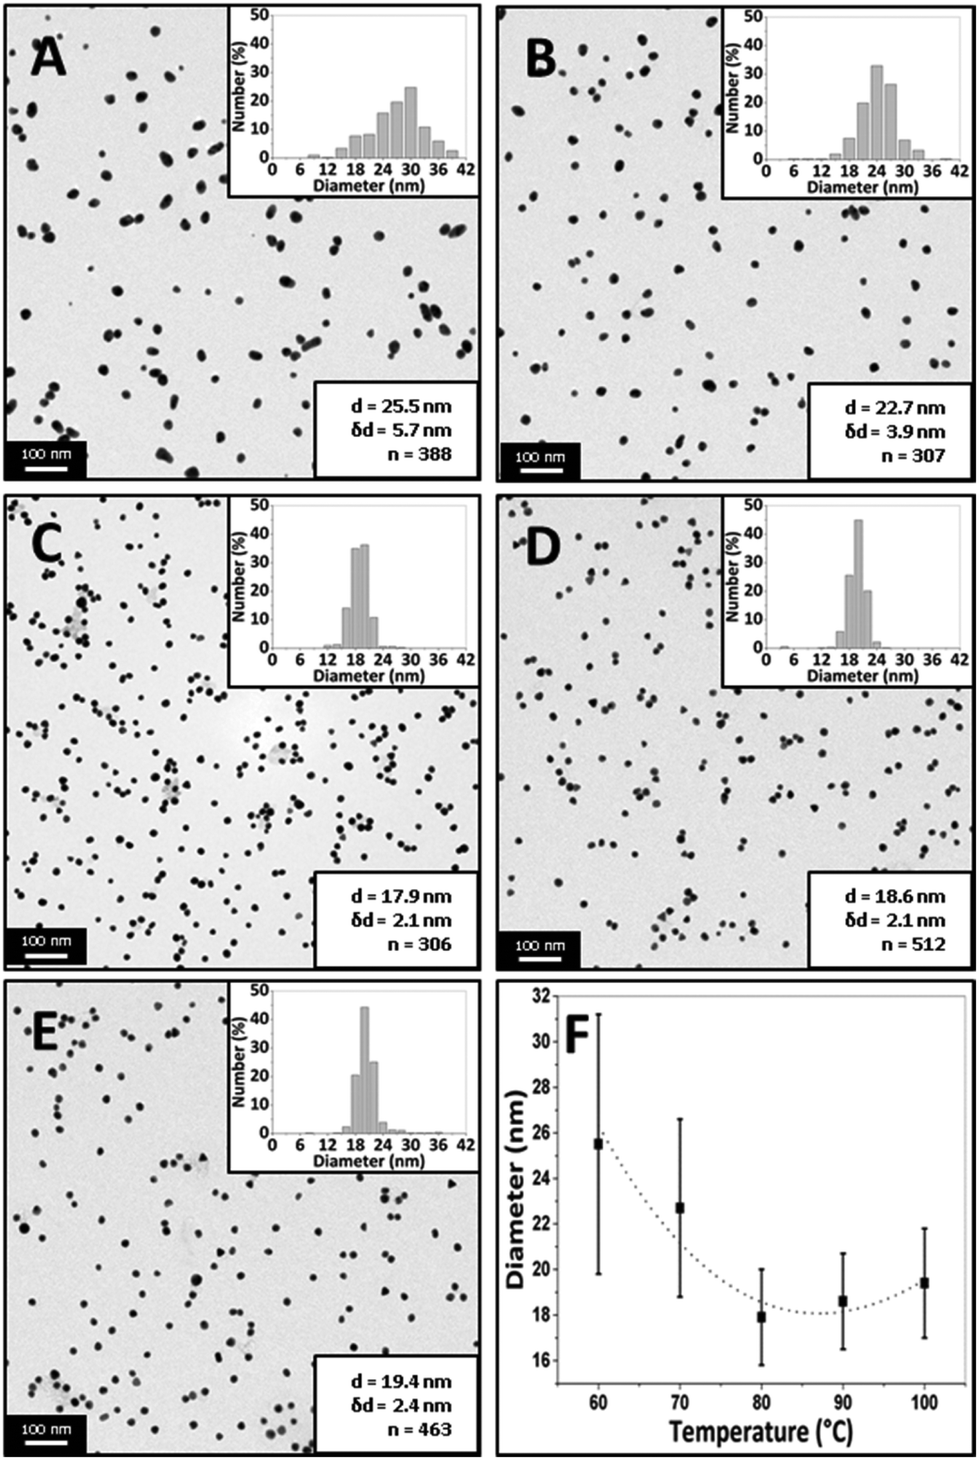 | ||
| Fig. 7 TEM images of gold NPs synthesized using the CFR with a CFI residence loop at a temperature of A: 60 °C, B: 70 °C, C: 80 °C, D: 90 °C, E: 100 °C. F: Average diameter of gold NPs vs. temperature of synthesis (bars represent standard deviation of the size). Concentration of tetrachloroauric acid, 0.557 mM; concentration of trisodium citrate, 0.09 M; volumetric flow rate ratio, 32.3:1 (Qout:Qin, HAuCl4:Na3citrate); molar flow rate ratio, 1:5 (HAuCl4:Na3citrate); flow rate, 1 ml min−1. | ||
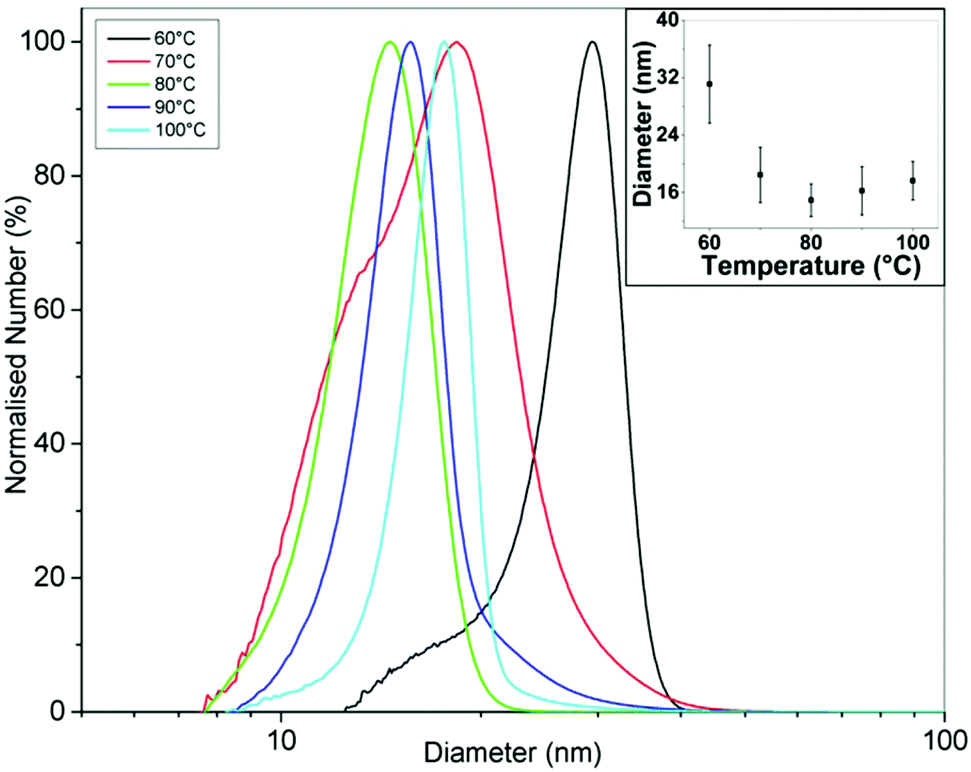 | ||
| Fig. 8 Normalised DCS curves of gold NPs synthesized using the CFR with a CFI residence loop at temperatures between 60 and 100 °C. Inset: Diameter of gold NPs vs. temperature of synthesis (bars represent standard deviation of size). Concentration of tetrachloroauric acid, 0.557 mM; concentration of trisodium citrate, 0.09 M; volumetric flow rate ratio, 32.3:1 (Qout:Qin, HAuCl4:Na3citrate); molar flow rate ratio, 1:5 (HAuCl4:Na3citrate); flow rate, 1 ml min−1. | ||
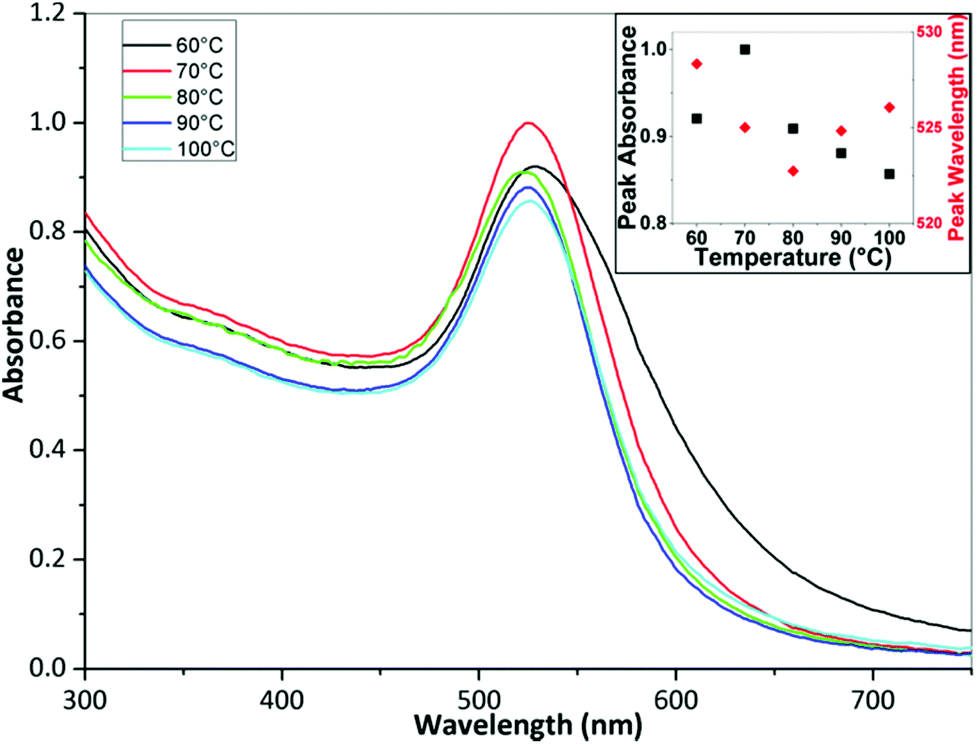 | ||
| Fig. 9 UV-Vis spectra of gold NPs synthesized using the CFR with a CFI residence loop at temperatures between 60 and 100 °C. Inset: Peak absorbance (black squares) and peak wavelength (red diamonds) of gold NPs vs. temperature of synthesis. Concentration of tetrachloroauric acid, 0.557 mM; concentration of trisodium citrate, 0.09 M; volumetric flow rate ratio, 32.3:1 (Qout:Qin, HAuCl4:Na3citrate); molar flow rate ratio, 1:5 (HAuCl4:Na3citrate); flow rate, 1 ml min−1. | ||
The average size of the NPs decreased from 25.5 nm to 17.9 nm when increasing the temperature from 60 to 80 °C and then increased slightly to 19.4 nm when increasing the temperature from 80 to 100 °C. DCS characterization also shows similar trends. The tails or humps observed for conditions of low temperature (Fig. 8) and high flowrate (Fig. 5), i.e. under conditions when precursor consumption would have been the lowest in the reactor, may be associated with nucleation events taking place during sample stabilisation. However, in most cases the tails represent a small number percentage compared to the peak of the size distribution curves obtained from DCS. Nanoparticles of a smaller size were infrequent in the TEM images of the corresponding curves, suggesting that this effect was not pronounced. The UV-Vis peak absorbance is highest at 70 °C after which it decreases with increasing temperature while the peak wavelength changes from 528 to 523 nm from 60 to 80 °C and from 523 to 525 nm from 80 to 100 °C. The characterization confirms that there is a minimum size at 80 °C. Turkevich et al. also observed a minimum size of 16.5 nm at 80 °C.4 Chow and Zukoski found that NPs had approximately the same size at synthesis temperatures of 60, 70 and 80 °C but it took longer for NPs at lower temperatures to arrive at the final size.7 Wuithschick et al. found a minimum of NP size at 60 °C using the Turkevich method,21 while Piella et al. found a minimum at 70 °C.22 Increasing temperature affects a number of factors in the synthesis. The conversion of [AuCl4]− species to increasingly hydroxylated species speeds up at higher temperatures meaning that the nucleation period also terminates faster as the more reactive species is converted to less reactive species. Note also that the equilibrium shifts to more hydroxylated forms at higher temperatures.21 However, the rate of reduction of [AuCl4]− at higher temperature would also speed up, resulting in a higher nucleation rate in a shorter time period. Finally, the size of the stable nuclei would also be slightly larger at higher temperatures because of the larger thermal energy available.21 Thus, there is a balance of competing effects, resulting in a minimum size at an intermediate temperature. A further point to note is that the heat transfer and mixing would also play a role in how the temperature affects the resultant NPs. For instance, in batch synthesis the citrate is injected at room temperature to boiling citrate, and so, depending on the amount and nature of the injection, the reaction could take place at different temperatures in localized regions around the injection point, which may explain the variety of results reported in the literature.
The repeatability of the synthesis was investigated by repeating the experiment at each temperature three times and characterizing the size using DCS (ESI, Fig. S4†). The repeatability in size was found to be worst at 60 °C and improved with increasing temperature up to 80 °C, after which it remained fairly constant.
Silver nanoparticle synthesis using a coaxial flow reactor followed by a split and recombine mixer
A SAR mixer was placed after the CFR to study the effect of concentration homogenization after the nucleation process and compare it with our previous work where the CFR was used in isolation.40 The CFR had an inner tube I.D. of 0.556 mm and an outer tube I.D. of 2 mm. The distance from the inner tube outlet to the outlet of the CFR was 130 mm. The effect that the silver nitrate concentration had on the silver NPs was investigated. Silver nitrate and trisodium citrate solutions were premixed before pumping through the inner tube with the concentration of silver nitrate varied between 0.05 and 0.4 mM, while the trisodium citrate concentration was fixed at 0.5 mM. Concentration of sodium borohydride was fixed at 0.3 mM and pumped through the outer tube. The volumetric flow rate ratio was fixed at 1:1 (Qout:Qin) and the total flow rate was fixed at 2.5 ml min−1. Experiments were carried out at room temperature between 22–24 °C.
Fig. 10 shows TEM images of silver NPs synthesized at a silver nitrate concentration of 0.05, 0.15, 0.25 and 0.4 mM. The average diameter and dispersity of the NPs were 5.5 ± 2.4 nm, 4.7 ± 2.8 nm, 4.4 ± 1.8 nm and 3.4 ± 1.4 nm. Fig. 11 shows corresponding UV-Vis spectra. Peak absorbance increases with increasing concentration and the peak wavelength stays relatively constant between 398–400 nm between 0.05–0.25 mM; however, at 0.3 mM the wavelength decreases to 395 nm and at 0.4 mM the wavelength is 392 nm. Although peak wavelength should not change according to Mie theory for silver NPs less than 10 nm,63 a blue shift in peak wavelength generally indicates smaller NPs.
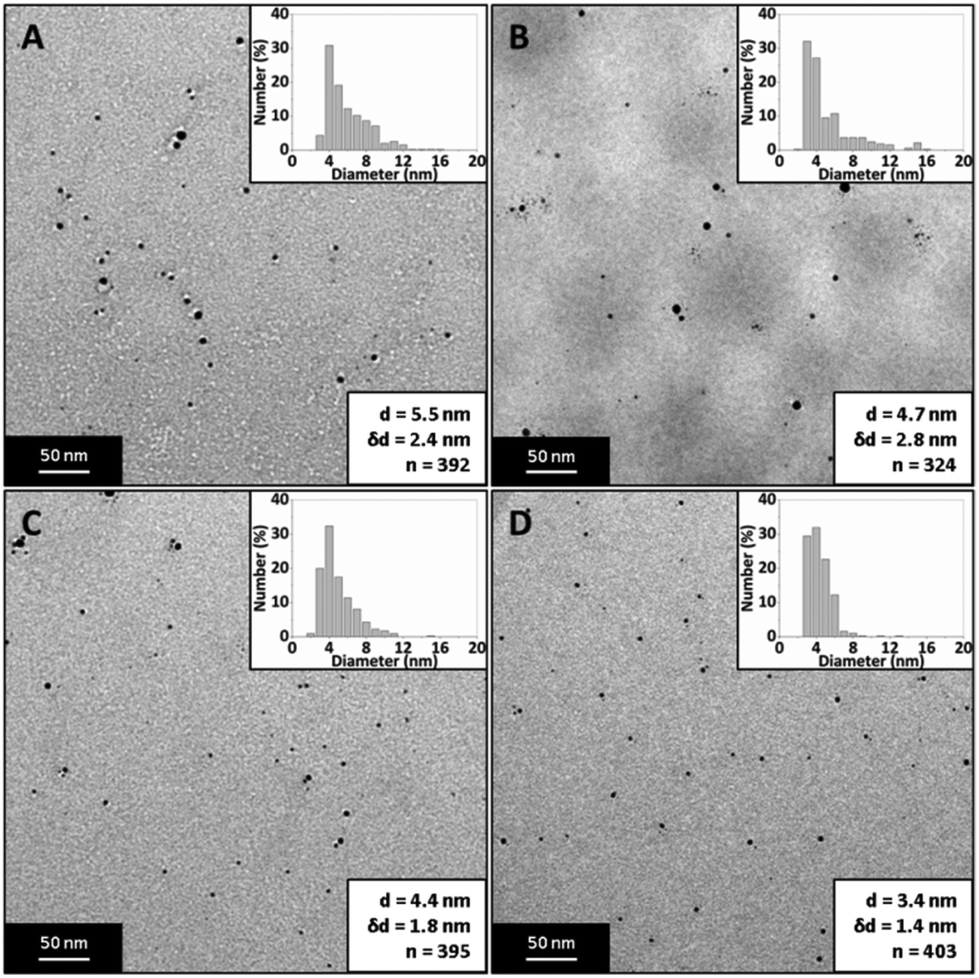 | ||
| Fig. 10 TEM images of silver NPs synthesized using the CFR followed by a SAR mixer at a silver nitrate concentration of A: 0.05 mM, B: 0.15 mM, C: 0.25 mM, D: 0.4 mM. Concentration of sodium borohydride, 0.3 mM; concentration of trisodium citrate, 0.5 M; volumetric flow rate ratio, 1:1 (Qout:Qin, NaBH4:AgNO3); molar flow rate ratio, 0.5–4:3:5 (AgNO3:NaBH4:Na3citrate); flow rate, 2.5 ml min−1; temperature, 22–24 °C. | ||
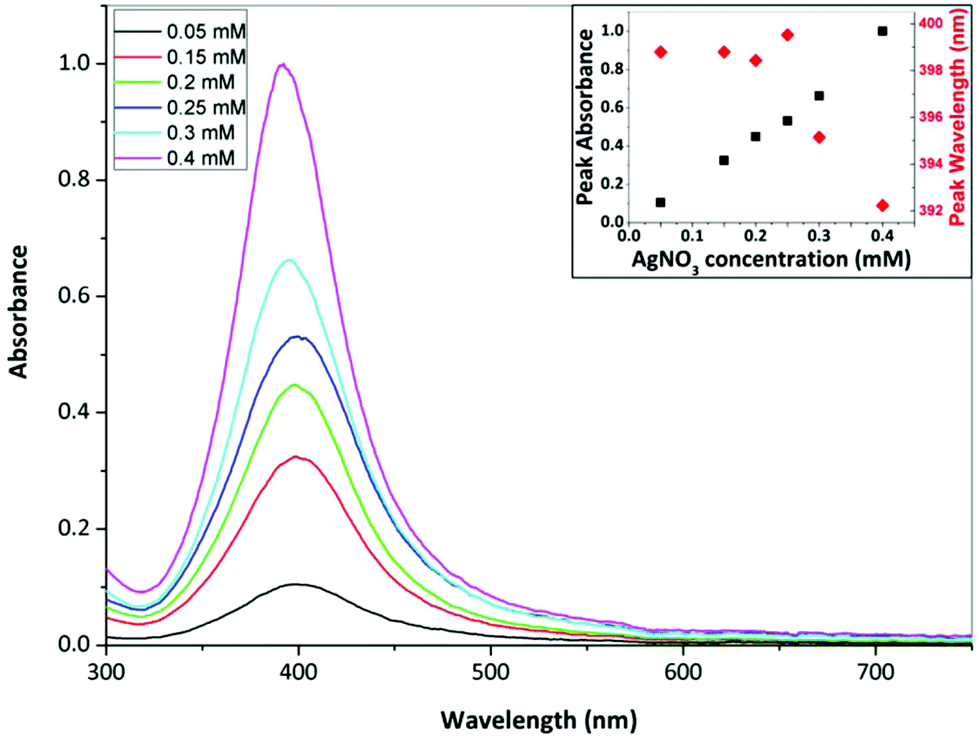 | ||
| Fig. 11 UV-Vis spectra of silver NPs synthesized using the CFR followed by a SAR mixer at silver nitrate concentrations 0.05–0.4 mM. Inset: Peak absorbance (black squares) and peak wavelength (red diamonds) of silver NPs vs. silver nitrate concentration. Concentration of sodium borohydride, 0.3 mM; concentration of trisodium citrate, 0.5 M; volumetric flow rate ratio, 1:1 (Qout:Qin, NaBH4:AgNO3); molar flow rate ratio, 0.5–4:3:5 (AgNO3:NaBH4:Na3citrate); flow rate, 2.5 ml min−1; temperature, 22–24 °C. | ||
The laminar flow profile inside the CFR creates an interface between the silver nitrate and sodium borohydride zones, resulting in mixing through diffusion (rather than enhanced by a stretching and thinning of lamellae). The laminar flow profile prevents reaction in silver nitrate rich zones resulting in smaller NPs. Larger NPs occur in silver nitrate rich zones because the sodium borohydride can reduce multiples of its own stoichiometric equivalent in silver ions,64–66 resulting in larger and less stable (since each cluster of reduced silver will have less sodium borohydride available to increase the force of repulsion to other clusters) NPs which are able to grow. In the SAR mixer the laminar flow condition is maintained but the mixing efficiency is increased, as the stream is continuously split and recombined in a way to serially laminate the flow into thinner multiples of the original stream, and there is a creation of an increased number of interfaces between reagents. In the experiments above, increasing silver nitrate concentration led to higher supersaturation levels and thus a higher nucleation rate resulting in smaller NPs. T-tests showed p-values of <0.001 when comparing all PSDs (apart from comparison between 0.15 and 0.25 mM, p-value was 0.15), confirming a statistical difference and reduction in size with increasing silver nitrate concentration. In our previous experiments using only the coaxial flow reactor, the opposite trend was observed. NP size increased from 3.7 ± 0.8 nm to 9.3 ± 3 nm with increasing silver concentration from 0.05–0.4 mM with the same sodium borohydride and trisodium citrate concentrations (see Fig. 12).40 This occurred because reaction was not complete in the CFR and the advective mixing in the droplets formed at the end of the CFR allowed the possibility of sodium borohydride to travel into silver nitrate rich zones, leading to larger NPs (as discussed previously). Since downstream mixing is more controlled with the SAR mixer, silver nitrate rich zones which give rise to larger NPs are less likely to occur. The above indicates that the mixing condition of the fluid at the exit of the CFR has a significant effect on NP synthesis.
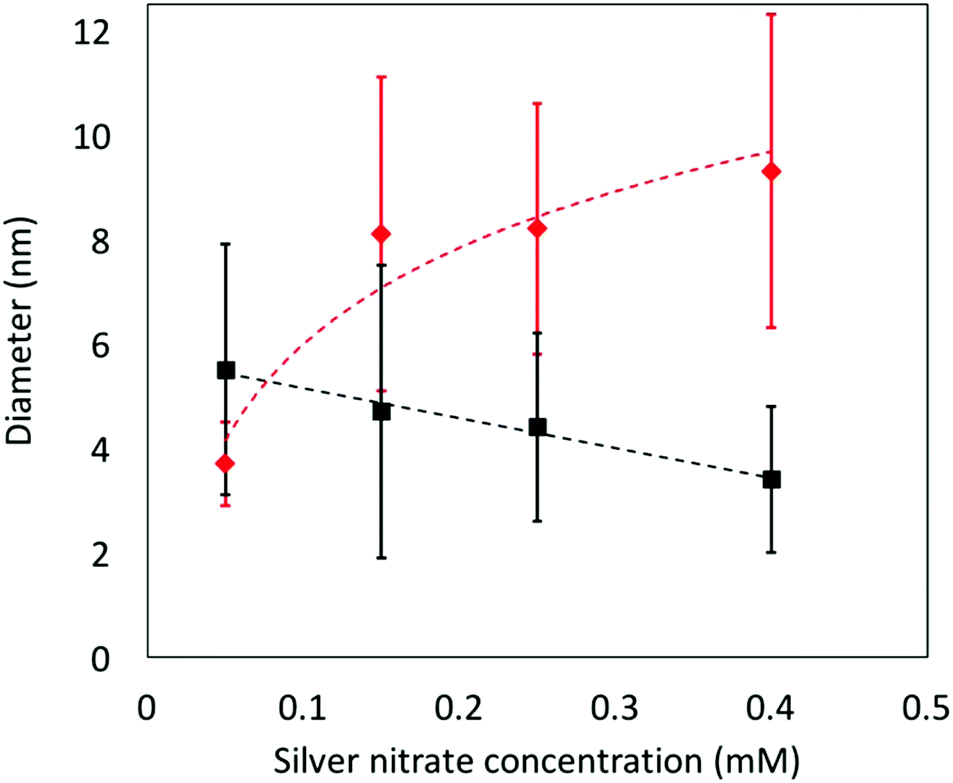 | ||
| Fig. 12 Silver nanoparticle diameter vs. silver nitrate concentration from experiments using the CFR followed by a SAR (black squares) and without a SAR (red diamonds) mixer. Concentration of sodium borohydride, 0.3 mM; concentration of trisodium citrate, 0.5 M; volumetric flow rate ratio, 1:1 (Qout:Qin, NaBH4:AgNO3); molar flow rate ratio, 0.5–4:3:5 (AgNO3:NaBH4:Na3citrate); flow rate, 2.5 ml min−1; temperature, 22–24 °C. | ||
Silver nanoparticle synthesis using solely a coaxial flow reactor operated at high Reynolds number
In the previous section, we have observed differences in NP synthesis when mixing conditions are altered downstream of the CFR. In this section we investigate the effect of mixing conditions in the CFR itself. This is achieved by using a CFR with small I.D and high flowrate of the inner tube, to increase the Reynolds number. Even though turbulent conditions are not achieved, mixing is enhanced by recirculation vortices that appear under these conditions.67 The CFR had an inner tube I.D. of 0.798 mm and an outer tube I.D. of 2 mm. The distance from the inner tube outlet to the outlet of the CFR was 130 mm. The concentrations of silver nitrate, trisodium citrate and sodium borohydride were varied at the inlet so that the concentration (assuming full mixing of the streams) for each flow rate tested was fixed at 0.1 mM, 0.5 mM and 0.3 mM respectively at the outlet. Silver nitrate and trisodium citrate were pumped through the inner tube and sodium borohydride was pumped through the outer tube. The volumetric flow rate ratio was varied between 1:50 and 1:200 (Qout:Qin) and the total flow rate was varied between 5.1 and 20.1 ml min−1. The molar flow rate ratio was fixed at 1:3:5 (AgNO3:NaBH4:Na3citrate). Experiments were carried out at room temperature between 22 and 24 °C.
Fig. 13 shows TEM images of silver NPs synthesized in the CFR with vortex flow. The Reynolds number in the inner tube was in the range 132–530 and in the main channel was in the range 54–212. The average diameter and dispersity was 5.9 ± 1.5 nm, 6.2 ± 2.7 nm, 7.7 ± 3.4 nm and 6.2 ± 2.2 nm for 5.1, 10.1, 15.1 and 20.1 ml min−1 respectively. Fig. 14 shows flow visualization of the CFR at a flow rate of 20.1 ml min−1 to demonstrate the vortex flow. Flow visualization using dye and water at other flow rates can be seen in the ESI (Fig. S5†). Flow rates of 5.1, 10.1 and 20.1 ml min−1 showed similar sizes, although 5.1 ml min−1 had a lower polydispersity. T-tests showed that p-values were <0.001 when comparing 15.1 ml min−1 to any other flow rate, and <0.05 when comparing 5.1 and 20.1 ml min−1. All other flow rate comparisons showed the NP population was not statistically different to any degree of confidence.
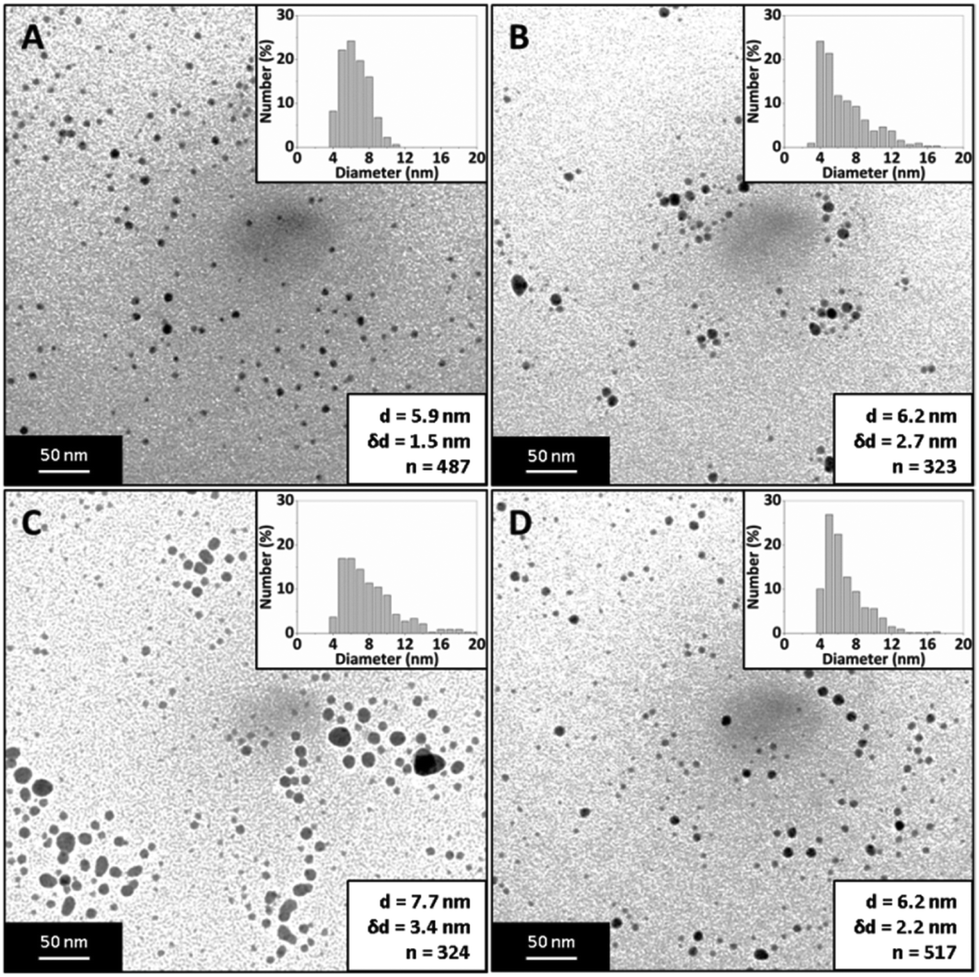 | ||
| Fig. 13 TEM image of silver NPs synthesized using the CFR with inner tube I.D. of 0.798 mm operated under high Re with a total flow rate of A: 5.1 ml min−1, B: 10.1 ml min−1, C: 15.1 ml min−1, D: 20.1 ml min−1. The outer tube flow rate was fixed at 0.1 ml min−1. Concentration of silver nitrate, 0.1 mM; concentration of sodium borohydride, 0.3 mM; concentration of trisodium citrate, 0.5 M (all concentrations stated are those after complete mixing); molar flow rate ratio, 1:3:5 (AgNO3:NaBH4:Na3citrate); temperature, 22–24 °C. | ||
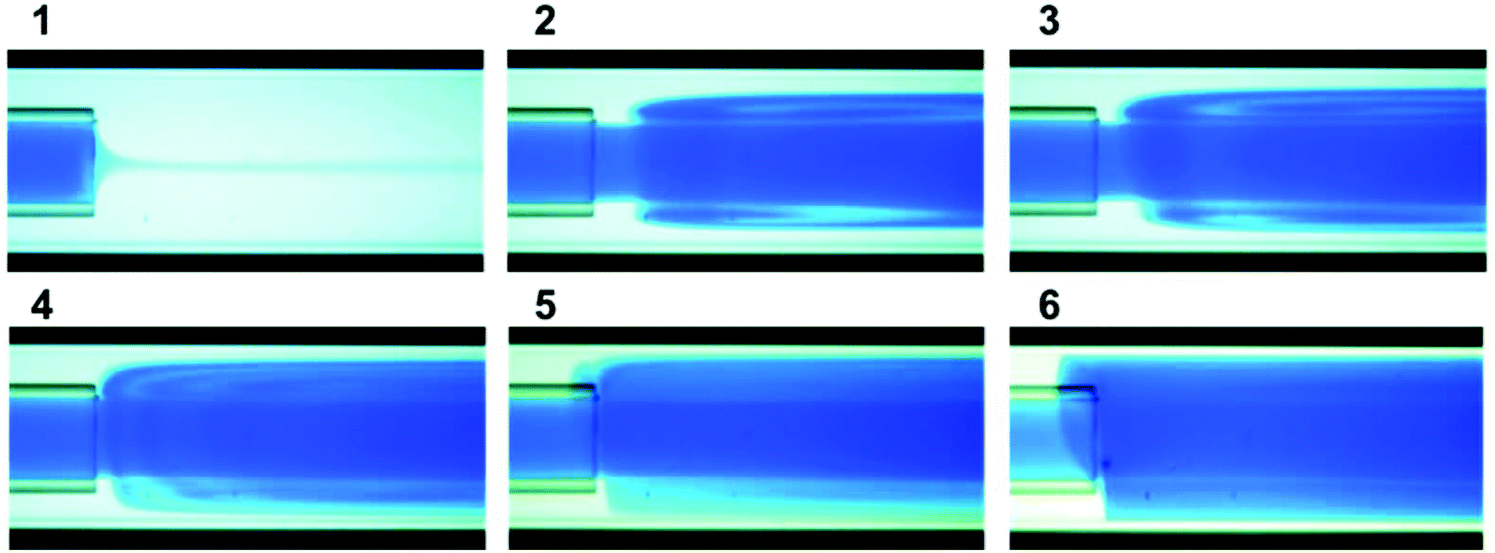 | ||
| Fig. 14 Flow visualization of CFR with inner tube I.D. of 0.798 mm operated under vortex flow. Flow is from left to right. Basic blue dye was pumped through the inner tube at 20 ml min−1 and water was pumped through the outer tube at 0.1 ml min−1. Re is 530 in the inner tube and 212 in the main channel. Picture 1 is taken before dye is pumped through the inner tube up, Pictures 2–5 as operational time increased, picture 6 after steady state is reached. | ||
The experiments using the CFR operated in vortex flow showed that there were minimal changes in NP size and no observable trends as flow rate was increased. Other systems such as iron oxide NPs and polystyrene NPs were synthesized successfully with low dispersity using a CFR operated in turbulent flow.47 In our case increasing mixing efficiency seemed to have no significant effect on the synthesized NPs in terms of size and polydispersity. This suggests that increasing mixing efficiency does not necessarily lead to increased monodispersity. In fact, the smallest and least disperse NP were obtained at the lowest flow rate of 5.1 ml min−1. Observing the hydrodynamics near the outlet of the inner tube (see Fig. S5 in the ESI†), the concentration of the dye (this would represent silver nitrate in the NP synthesis) spreads across the entire cross section of the channel. The steady state concentration of dye near the channel walls in the section immediately after jet emission from the outlet of the inner tube is most dilute at the lowest flow rate and becomes more concentrated at higher flow rates. This may explain the smallest size and dispersity at the lowest flow rate, where the ratio of silver nitrate to sodium borohydride is lower and hence more stable NPs which are less prone to growth through coalescence are synthesized.
Effect of inner tube internal diameter on silver NP synthesis using solely the coaxial flow reactor
The effect of the inner tube I.D. on the synthesis of silver NPs in the CFR was investigated by varying the inner tube I.D. between 0.147 and 0.798 mm. The outer tube I.D. was 2 mm and the distance from the inner tube outlet to the outlet of the CFR was 130 mm. Silver nitrate and trisodium citrate were premixed and pumped through the inner tube. Their concentrations were 0.1 mM and 0.5 mM respectively. Sodium borohydride (0.3 mM) was pumped through the outer tube. The volumetric flow rate ratio was 1:1 (Qout:Qin) and the total flow rate was 1 ml min−1.
Fig. 15 shows TEM images of silver NPs synthesized with an inner tube diameter of 0.147, 0.345, 0.447, 0.556, 0.701 and 0.798 mm where the average diameter and dispersity of the NPs are 4.7 ± 1.4 nm, 5.9 ± 2.4 nm, 5.9 ± 2.2 nm, 6.6 ± 3.7 nm, 8.8 ± 2.6 nm and 10.5 ± 4.0 nm respectively. Fig. 16 shows corresponding UV-Vis spectra. The peak absorbance showed a weak maximum at 0.447 mm (UV-vis data of repeats can be seen in the ESI, Fig. S6†) and the peak wavelength remained relatively constant between 392 and 394 nm for all samples.
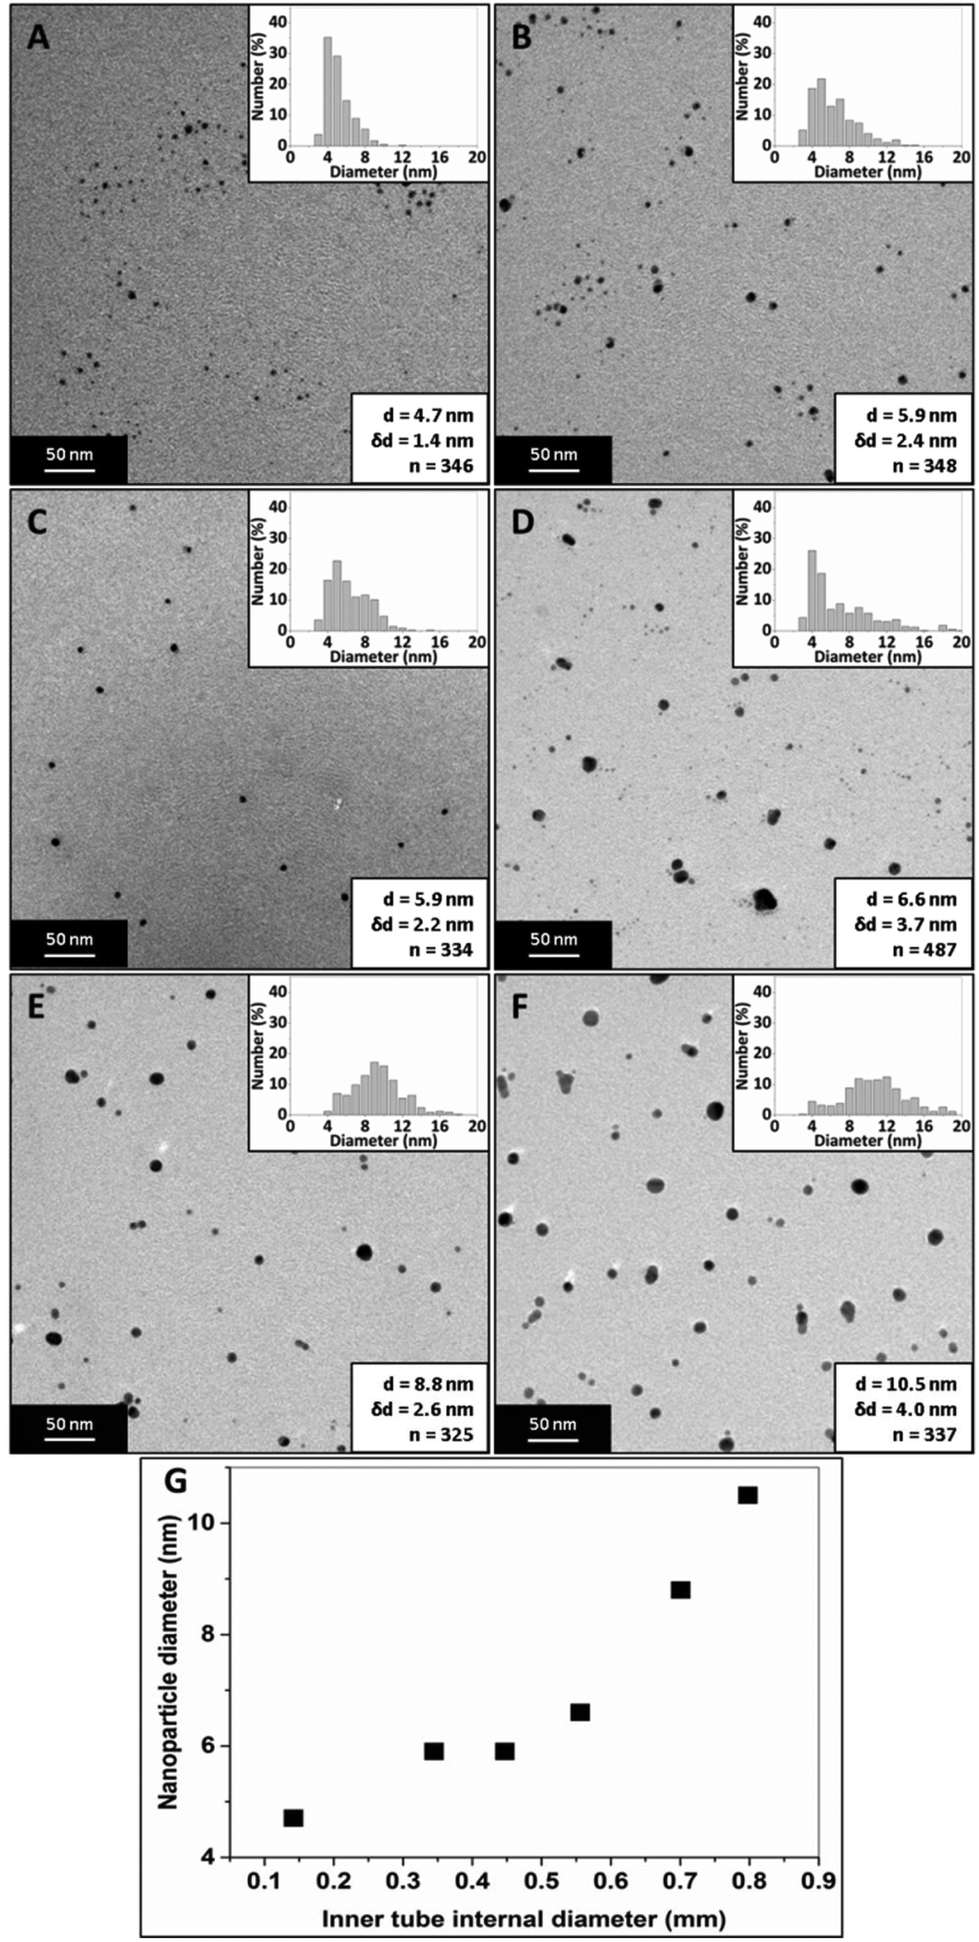 | ||
| Fig. 15 TEM images of silver NPs synthesized using the CFR with inner tube diameters of A: 0.142 mm, B: 0.345 mm, C: 0.447 mm, D: 0.556 mm, E: 0.701 mm, F: 0.798 mm, G: nanoparticle diameter vs. inner tube internal diameter. Concentration of silver nitrate, 0.1 mM; concentration of sodium borohydride, 0.3 mM; concentration of trisodium citrate, 0.5 M; volumetric flow rate ratio, 1:1 (Qout:Qin, NaBH4:AgNO3); molar flow rate ratio, 1:3:5 (AgNO3:NaBH4:Na3citrate); flow rate, 1 ml min−1, temperature 22–24 °C. | ||
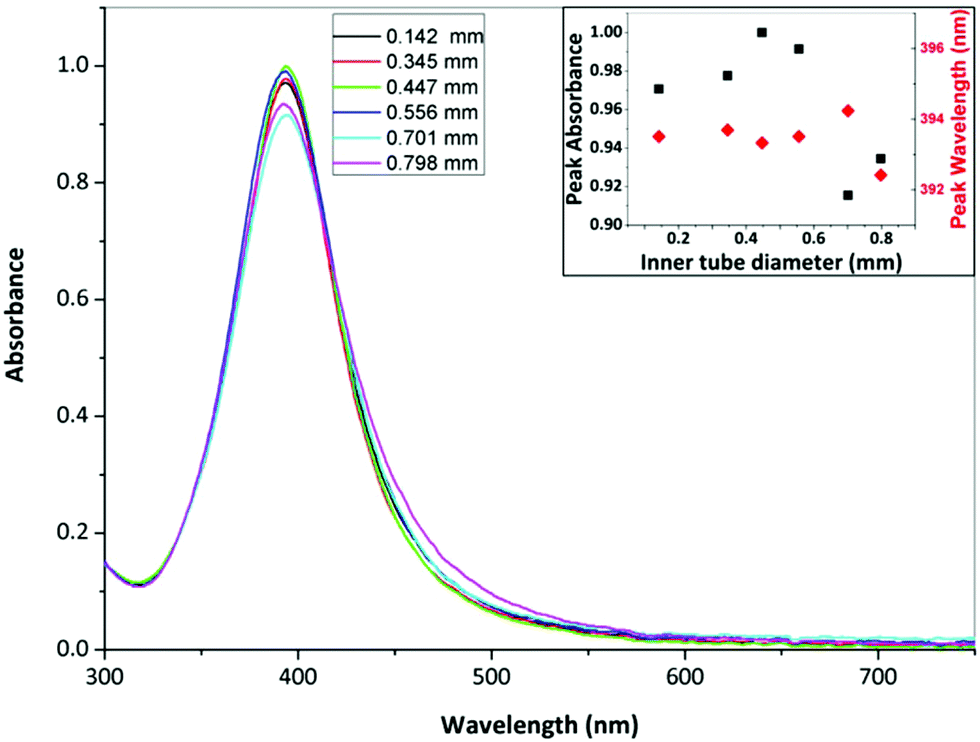 | ||
| Fig. 16 UV-Vis spectra of silver NPs synthesized using the CFR with inner tube diameters ranging between 0.142 and 0.798 mm. Inset: Peak absorbance (black squares) and peak wavelength (red diamonds) of silver NPs vs. inner tube internal diameter used in the CFR. Concentration of silver nitrate, 0.1 mM; concentration of sodium borohydride, 0.3 mM; concentration of trisodium citrate, 0.5 M; volumetric flow rate ratio, 1:1 (Qout:Qin, NaBH4:AgNO3); molar flow rate ratio, 1:3:5 (AgNO3:NaBH4:Na3citrate); flow rate, 1 ml min−1, temperature 22–24 °C. | ||
The size of the NPs increased with an increase in the inner tube I.D. This was confirmed by t-tests showing a statistically significant difference to a significance level of 0.01 for any pair of diameters except when comparing 0.345 and 0.447 mm, which were not statistically different. The internal tube I.D. controls the thickness of the inner stream, and hence the diffusion distance across the stream. By using smaller inner tube I.D., the diffusion distance is reduced. Hence, more of the silver nitrate in the inner stream can react with sodium borohydride. As the diffusion distance increases with increasing diameter, there is a larger amount of unreacted silver nitrate at the end of the channel. When droplets form at the outlet, this increases the likelihood of reactions and uncontrolled growth of NPs occurring in silver nitrate rich regions within the droplets. Thus, smaller NPs are obtained by reducing the diffusion distance of the silver nitrate stream within the CFR. The reaction between silver nitrate and sodium borohydride within the CFR using the inner tube I.D. tested experimentally was modelled using CFD simulations by the COMSOL Multiphysics software package. A fast 2nd order reaction was assumed of the form r = kCAgNO3CNaBH4, since Polte et al. suggest reduction of silver occurs in less than 200 ms,68 and Takesue et al. observed nucleation of silver NPs in less than 1 ms.69 The CFR geometry was implemented within COMSOL and the model solved the velocity profile and diffusion of reagents with reaction for the experimental conditions employed. Even though this model is oversimplified and uses an arbitrary reaction rate equation, it captures the development of concentration profiles of reactants and products along the CFR. The silver nitrate concentration at the outlet of the CFR was found to increase with increasing inner tube I.D., supporting the conjecture that increased silver nitrate at the CFR outlet leads to larger NPs (details on the model and silver nitrate concentration profiles can be found in the ESI†).
Conclusions
Silver and gold NPs were synthesized in a coaxial flow reactor (CFR) in conjunction with other microfluidic components such as a continuous flow inverter (CFI), as a residence time loop for gold NP synthesis, or a split-and-recombine (SAR) mixer for silver NP synthesis.Size control was achieved in the synthesis of gold NPs by varying the flow rate. The CFR provided a laminar flow region in which nucleation occurred at the interface of the two streams and the CFI provided a mixing region (due to secondary flow circulation) as well as a tighter residence time distribution (because of flow inversion) for growth to occur. In this way nucleation and growth periods could be controlled, resulting in an NP size range of 17.9–23.9 nm for a flow rate range of 0.25–3 ml min−1. A minimum size of 17.9 nm was obtained at 80 °C when the synthesis was performed in the temperature range of 60–100 °C. In batch syntheses, a change in size is typically achieved by altering the concentrations or order of reagent addition rather than the mixing conditions. Using this approach, the system offers a higher precision of control over the mass transfer, as opposed to a batch reactor, in a relatively simple manner (changing the flow rate of reagents) to achieve a variation in size of gold NPs.
The CFR used in conjunction with the SAR mixer produced silver NPs decreasing in size from 5.5 to 3.4 nm with increasing silver concentration, which is the opposite trend when using the CFR in isolation. This is because the SAR mixer provided very efficient mixing in a well-controlled manner to prevent reaction in silver nitrate rich regions post-CFR. The CFR also allows reaction to occur before entering the SAR mixer. This reduced the fouling occurring in the very small and complex geometry of the SAR mixer (using the SAR mixer in isolation resulted in a higher amount of fouling). A vortex flow regime at higher Reynolds number in the CFR led to size range of 5.9–7.7 nm for a flow rate range of 5.1–20.1 ml min−1. No trend in size or dispersity was observed using this type of flow regime, even though the mixing efficiency was increased with increasing flow rate. Decreasing the inner tube I.D. in the CFR resulted in NP size decrease from 10.5 to 4.7 nm, due to the reduced diffusion distance of the inner stream resulting in a faster consumption of silver nitrate in a well-controlled mass transfer region (i.e. within the CFR rather than at the outlet), which was supported by CFD modelling of the reaction within the CFR.
The study demonstrates the versatility of using microfluidic devices and the potential benefits arising from manipulating the mass transfer and hydrodynamics on NP size and dispersity by using the CFR and/or other components in conjunction with the CFR for synthesis. This level of control over mass transfer is not easily achieved using batch reactors.
Conflicts of interest
There are no conflicts to declare.Acknowledgements
The authors would like to thank EPSRC and University College London for funding. N. T. K. Thanh thanks The Royal Society for her University Research Fellowship.References
- A. Gavriilidis, P. Angeli, E. Cao, K. K. Yeong and Y. S. S. Wan, Chem. Eng. Res. Des., 2002, 80, 3–30 CrossRef CAS.
- X. Shen, Y. Song, S. Li, R. Li, S. Ji, Q. Li, H. Duan, R. Xu, W. Yang and K. Zhao, RSC Adv., 2014, 4, 34179–34188 RSC.
- T. Sugimoto, Monodispersed particles, Elsevier, 2001 Search PubMed.
- J. Turkevich, P. C. Stevenson and J. Hillier, Discuss. Faraday Soc., 1951, 11, 55–75 RSC.
- G. Frens, Nature, 1973, 241, 20–22 CAS.
- S. L. Goodman, G. M. Hodges, L. K. Trejdosiewicz and D. C. Livingston, J. Microsc., 1981, 123, 201–213 CrossRef CAS PubMed.
- M. K. Chow and C. F. Zukoski, J. Colloid Interface Sci., 1994, 165, 97–109 CrossRef CAS.
- C.-H. Su, P.-L. Wu and C.-S. Yeh, J. Phys. Chem. B, 2003, 107, 14240–14243 CrossRef CAS.
- L. Pei, K. Mori and M. Adachi, Langmuir, 2004, 20, 7837–7843 CrossRef CAS PubMed.
- J. Kimling, M. Maier, B. Okenve, V. Kotaidis, H. Ballot and A. Plech, J. Phys. Chem. B, 2006, 110, 15700–15707 CrossRef CAS PubMed.
- X. Ji, X. Song, J. Li, Y. Bai, W. Yang and X. Peng, J. Am. Chem. Soc., 2007, 129, 13939–13948 CrossRef CAS PubMed.
- W. Patungwasa and J. H. Hodak, Mater. Chem. Phys., 2008, 108, 45–54 CrossRef CAS.
- I. Ojea-Jiménez, F. M. Romero, N. G. Bastús and V. Puntes, J. Phys. Chem. C, 2010, 114, 1800–1804 Search PubMed.
- M. A. Uppal, A. Kafizas, M. B. Ewing and I. P. Parkin, New J. Chem., 2010, 34, 2906–2914 RSC.
- M. A. Uppal, A. Kafizas, T. H. Lim and I. P. Parkin, New J. Chem., 2010, 34, 1401–1407 RSC.
- I. Ojea-Jiménez, N. G. Bastús and V. Puntes, J. Phys. Chem. C, 2011, 115, 15752–15757 Search PubMed.
- S. K. Sivaraman, S. Kumar and V. Santhanam, J. Colloid Interface Sci., 2011, 361, 543–547 CrossRef CAS PubMed.
- I. Ojea-Jiménez and J. M. Campanera, J. Phys. Chem. C, 2012, 116, 23682–23691 Search PubMed.
- L. Zhao, D. Jiang, Y. Cai, X. Ji, R. Xie and W. Yang, Nanoscale, 2012, 4, 5071–5076 RSC.
- F. Schulz, T. Homolka, N. G. Bastús, V. Puntes, H. Weller and T. Vossmeyer, Langmuir, 2014, 30, 10779–10784 CrossRef CAS PubMed.
- M. Wuithschick, A. Birnbaum, S. Witte, M. Sztucki, U. Vainio, N. Pinna, K. Rademann, F. Emmerling, R. Kraehnert and J. Polte, ACS Nano, 2015, 9, 7052–7071 CrossRef CAS PubMed.
- J. Piella, N. G. Bastús and V. Puntes, Chem. Mater., 2016, 28, 1066–1075 CrossRef CAS.
- F. Kettemann, A. Birnbaum, S. Witte, M. Wuithschick, N. Pinna, R. Kraehnert, K. Rademann and J. Polte, Chem. Mater., 2016, 28, 4072–4081 CrossRef CAS.
- J. Ftouni, M. Penhoat, A. Addad, E. Payen, C. Rolando and J.-S. Girardon, Nanoscale, 2012, 4, 4450–4454 RSC.
- K. Sugano, Y. Uchida, O. Ichihashi, H. Yamada, T. Tsuchiya and O. Tabata, Microfluid. Nanofluid., 2010, 9, 1165–1174 CrossRef CAS.
- W. Chen-Hsun, H. Chih-Chia, Y. Chen-Sheng, L. Huan-Yao and L. Gwo-Bin, J. Micromech. Microeng., 2008, 18, 035019 CrossRef.
- J. M. Kohler, J. Wagner and J. Albert, J. Mater. Chem., 2005, 15, 1924–1930 RSC.
- J. Wagner and J. M. Kohler, Nano Lett., 2005, 5, 685–691 CrossRef CAS PubMed.
- D. Shalom, R. C. R. Wootton, R. F. Winkle, B. F. Cottam, R. Vilar, A. J. deMello and C. P. Wilde, Mater. Lett., 2007, 61, 1146–1150 CrossRef CAS.
- V. Sebastian Cabeza, S. Kuhn, A. A. Kulkarni and K. F. Jensen, Langmuir, 2012, 28, 7007–7013 CrossRef CAS PubMed.
- H. Tsunoyama, N. Ichikuni and T. Tsukuda, Langmuir, 2008, 24, 11327–11330 CrossRef CAS PubMed.
- S. Agnihotri, S. Mukherji and S. Mukherji, RSC Adv., 2014, 4, 3974–3983 RSC.
- V. V. Pinto, M. J. Ferreira, R. Silva, H. A. Santos, F. Silva and C. M. Pereira, Colloids Surf., A, 2010, 364, 19–25 CrossRef CAS.
- J. A. Creighton, C. G. Blatchford and M. G. Albrecht, J. Chem. Soc., Faraday Trans. 2, 1979, 75, 790–798 RSC.
- K. Song, S. Lee, T. Park and B. Lee, Korean J. Chem. Eng., 2009, 26, 153–155 CrossRef CAS.
- A. Thogersen, J. Bonsak, C. H. Fosli and G. Muntingh, J. Appl. Phys., 2011, 110 CrossRef CAS , 044306.
- B. H. Ryu, Y. Choi, H. S. Park, J. H. Byun, K. Kong, J. O. Lee and H. Chang, Colloids Surf., A, 2005, 270, 345–351 CrossRef.
- J. Wagner, T. R. Tshikhudo and J. M. Koehler, Chem. Eng. J., 2008, 135, S104–S109 CrossRef CAS.
- N. Shirtcliffe, U. Nickel and S. Schneider, J. Colloid Interface Sci., 1999, 211, 122–129 CrossRef CAS PubMed.
- R. Baber, L. Mazzei, N. T. K. Thanh and A. Gavriilidis, RSC Adv., 2015, 5, 95585–95591 RSC.
- R. Baber, L. Mazzei, N. T. Thanh and A. Gavriilidis, J. Flow Chem., 2016, 1–11 Search PubMed.
- M. Takagi, T. Maki, M. Miyahara and K. Mae, Chem. Eng. J., 2004, 101, 269–276 CrossRef CAS.
- T. Maki, J. I. Kitada and K. Mae, Chem. Eng. Technol., 2013, 36, 1027–1032 CrossRef CAS.
- A. Abou Hassan, O. Sandre, V. Cabuil and P. Tabeling, Chem. Commun., 2008, 1783–1785, 10.1039/B719550H.
- A. Abou-Hassan, R. Bazzi and V. Cabuil, Angew. Chem., Int. Ed., 2009, 48, 7180–7183 CrossRef CAS PubMed.
- A. Abou-Hassan, O. Sandre, S. Neveu and V. Cabuil, Angew. Chem., Int. Ed., 2009, 48, 2342–2345 CrossRef CAS PubMed.
- J.-M. Lim, A. Swami, L. M. Gilson, S. Chopra, S. Choi, J. Wu, R. Langer, R. Karnik and O. C. Farokhzad, ACS Nano, 2014, 8, 6056–6065 CrossRef CAS PubMed.
- D. Liu, S. Cito, Y. Zhang, C. F. Wang, T. M. Sikanen and H. A. Santos, Adv. Mater., 2015, 27, 2298–2304 CrossRef CAS PubMed.
- R. Couto, S. Chambon, C. Aymonier, E. Mignard, B. Pavageau, A. Erriguible and S. Marre, Chem. Commun., 2015, 51, 1008–1011 RSC.
- J. Schülein, I. Minrath, R. Pommersheim and H. Löwe, J. Flow Chem., 2014, 4, 44–53 CrossRef.
- T. Gendrineau, S. Marre, M. Vaultier, M. Pucheault and C. Aymonier, Angew. Chem., Int. Ed., 2012, 51, 8525–8528 CrossRef CAS PubMed.
- B. Giroire, S. Marre, A. Garcia, T. Cardinal and C. Aymonier, React. Chem. Eng., 2016, 1(2), 151–155 CAS.
- N. Acharya, M. Sen and C. Hsueh-Chia, Int. J. Heat Mass Tranfer, 1992, 35, 2475–2489 CrossRef CAS.
- N. Acharya, M. Sen and H.-C. Chang, Int. J. Heat Mass Tranfer, 2001, 44, 3189–3199 CrossRef.
- M. M. Mandal, C. Serra, Y. Hoarau and K. Nigam, Microfluid. Nanofluid., 2011, 10, 415–423 CrossRef CAS.
- A. K. Saxena and K. D. P. Nigam, AIChE J., 1984, 30, 363–368 CrossRef CAS.
- D. A. Beard, J. Appl. Phys., 2001, 89, 4667–4669 CrossRef CAS.
- J. Reijenga, G. Aben, T. P. Verheggen and F. Everaerts, J. Chromatogr., A, 1983, 260, 241–254 CrossRef CAS.
- V. R. Fernandes, A. M. F. R. Pinto and C. M. Rangel, Int. J. Hydrogen Energy, 2010, 35, 9862–9868 CrossRef CAS.
- P. K. Jain, K. S. Lee, I. H. El-Sayed and M. A. El-Sayed, J. Phys. Chem. B, 2006, 110, 7238–7248 CrossRef CAS PubMed.
- X. Liu, M. Atwater, J. Wang and Q. Huo, Colloids Surf., B, 2007, 58, 3–7 CrossRef CAS PubMed.
- T. Hendel, M. Wuithschick, F. Kettemann, A. Birnbaum, K. Rademann and J. Polte, Anal. Chem., 2014, 86, 11115–11124 CrossRef CAS PubMed.
- D. L. Van Hyning and C. F. Zukoski, Langmuir, 1998, 14, 7034–7046 CrossRef CAS.
- W. M. Haynes, CRC handbook of chemistry and physics, CRC Press, Taylor & Francis, Boca Raton, Fla. [u.a.], London, 95th edn, 2014 Search PubMed.
- J. C. Fanning, B. C. Brooks, A. B. Hoeglund, D. A. Pelletier and J. A. Wadford, Inorg. Chim. Acta, 2000, 310, 115–119 CrossRef CAS.
- J. Shen, Z. Li, Q. Yan and Y. Chen, J. Phys. Chem., 1993, 97, 8504–8511 CrossRef CAS.
- L. Djenidi and B. Moghtaderi, J. Fluid Mech., 2006, 568, 223–242 CrossRef CAS.
- J. Polte, X. Tuaev, M. Wuithschick, A. Fischer, A. F. Thuenemann, K. Rademann, R. Kraehnert and F. Emmerling, ACS Nano, 2012, 6, 5791–5802 CrossRef CAS PubMed.
- M. Takesue, T. Tomura, M. Yamada, K. Hata, S. Kuwamoto and T. Yonezawa, J. Am. Chem. Soc., 2011, 133, 14164–14167 CrossRef CAS PubMed.
Footnote |
| † Electronic supplementary information (ESI) available. See DOI: 10.1039/c7nr04962e |
| This journal is © The Royal Society of Chemistry 2017 |