
 Open Access Article
 This Open Access Article is licensed under a Creative Commons Attribution-Non Commercial 3.0 Unported Licence
Morphology of a self-doped conducting oligomer for green energy applications†
Juan Felipe
Franco-Gonzalez
 *a,
Eleni
Pavlopoulou
b,
Eleni
Stavrinidou
a,
Roger
Gabrielsson
a,
Daniel T.
Simon
a,
Magnus
Berggren
a and
Igor V.
Zozoulenko
*a
*a,
Eleni
Pavlopoulou
b,
Eleni
Stavrinidou
a,
Roger
Gabrielsson
a,
Daniel T.
Simon
a,
Magnus
Berggren
a and
Igor V.
Zozoulenko
*a
aLaboratory of Organic Electronics, Department of Science and Technology, Linköping University, SE-601 74 Norrköping, Sweden. E-mail: igor.zozoulenko@liu.se; felipe.franco@liu.se
bBordeaux INP, Université de Bordeaux, CNRS, LCPO UMR 5629, 33600 Pessac, France
First published on 4th September 2017
Abstract
A recently synthesized self-doped conducting oligomer, salt of bis[3,4-ethylenedioxythiophene]3thiophene butyric acid, ETE-S, is a novel promising material for green energy applications. Recently, it has been demonstrated that it can polymerize in vivo, in plant systems, leading to a formation of long-range conducting wires, charge storage and supercapacitive behaviour of living plants. Here we investigate the morphology of ETE-S combining the experimental characterisation using Grazing Incidence Wide Angle X-ray Scattering (GIWAXS) and atomistic molecular dynamics (MD) simulations. The GIWAXS measurements reveal a formation of small crystallites consisting of π–π stacked oligomers (with the staking distance 3.5 Å) that are further organized in h00 lamellae. These experimental results are confirmed by MD calculations, where we calculated the X-ray diffraction pattern and the radial distribution function for the distance between ETE-S chains. Our MD simulations also demonstrate the formation of the percolative paths for charge carriers that extend throughout the whole structure, despite the fact that the oligomers are short (6–9 rings) and crystallites are thin along the π–π stacking direction, consisting of only two or three π–π stacked oligomers. The existence of the percolative paths explains the previously observed high conductivity in in vivo polymerized ETE-S. We also explored the geometrical conformation of ETE-S oligomers and the bending of their aliphatic chains as a function of the oligomer lengths.
1. Introduction
Organic conducting polymers have been used in bioelectronics engineering due to their biocompatibility and flexibility during procesing.1 Also, in contrast to conventional semiconducting materials, conducting polymers support the transport of both electrons and ions.2 This makes it possible to use conductive polymers in a variety of biomedical applications requiring the electrical stimuli and control of living tissues, such as neural probes to record neuronal activities,3,4 biosensors,5,6 implantable drug delivery devices7 and others.8 In the recent years, a concept of electronic plants (e-plants) has emerged where the conducting polymers have been integrated inside the vascular tissues of plants forming digital circuits and enabling energy storage.9,10Among all conducting polymers the poly(3,4-ethylenedioxythiophene) (PEDOT) and its derivatives are by far the most used ones in bioelectronics representing the material of choice for many applications.1,3,11 High conductivity of PEDOT is achieved in a doped state, where positive charges in the polymer backbone are compensated by negative counterions.12–15 The latter can be whether polymeric counterions, most commonly polystyrenesulfonate (PEDOT:PSS), or molecular counterions such as tosylate (PEDOT:TOS). Alternatively, positive charges in conducting polymers can be induced by self-doping16,17via e.g. a covalently bound anionic side group, as for the case of a self-doped polymer, namely poly(4-(2,3-dihydrothieno[3,4-b]-[1,4]dioxin-2-yl-methoxy)-1-butanesulfonic acid, sodium salt), PEDOT-S.9
Integration of conducting polymers within living tissue represents a significant technological challenge. In vivo electropolymerization of EDOT has been efficiently implemented in the manufacture of neural probes.11 Recently the self-doped polymer PEDOT-S was distributed in the vascular tissue of a plant and self-organized forming conducting wires.9 However, the electronic functionality using PEDOT-S could only be achieved in localized areas of plants limited to stems. PEDOT-S is already a polymer prior to the functionalization of the plant and crosslinks within the tissue due to the presence of divalent ions, limiting its distribution within the plant.
This limitation has been recently overcome by replacing PEDOT-S with another derivative of PEDOT, namely self-doped oligomer sodium salt of bis[3,4-ethylenedioxythiophene]3thiophene butyric acid (ETE-S),10 see Fig. 1a for its monomeric chemical structure. It has been demonstrated that ETE-S, in contrast to PEDOT-S, is effectively distributed and polymerized through the entire xylem vascular tissue with the plant acting as the template and catalyst for the in vivo polymerization reaction. This fact allows an efficient diffusion and then distribution of ETE-S monomers and oligomers throughout the whole vascular system. The resulting plant functionalized with ETE-S has shown to operate as an in vivo supercapacitor with energy stored in a living plant.
 | ||
| Fig. 1 (a)–(c) Upper: Schematic representation of self-doped oligomer ETE-S chains for n = 1, 2 and 3. Positive charges in the backbone +ne is compensated by negative charges –e in each sulfonate group. Below: Snapshots of the aqueous ETE-S solution for different chain length n = 1, 2 and 3; water content is 29.3 wt% (Only thiophene rings from ETE-S chains are showed for clarity; water is not displayed.) Representative percolative paths for charge carriers between ETE-S chains are indicated in green. (Percolative paths are defined as the paths that connect neighboring thiophene rings on the same ETE-S chain or on neighboring π–π stacked chains.) | ||
The advances in templating electronic functionality in bioelectronic systems using ETE-S strongly motivate detailed studies of electronic, structural and morphological properties of these materials. Recently, spectroelectrochemical studies of ETE-S were reported focussing on the optical properties and nature of charge carriers in this material.18 At the same time, its morphology remains practically unexplored. Given that further functionalization of this material and the device development and optimization are difficult without solid understanding of the basic material properties, in this study we perform theoretical modelling of ETE-S morphology using atomistic molecular dynamics simulation combined with experimental characterization using Grazing Incidence Wide Angle X-ray Scattering (GIWAXS).
The self-doped polymers have attracted significant attention during last decades. Experimental studies such as Nuclear Magnetic Resonance (NMR), X-ray Photoelectron Spectroscopy, Ulta-violet Spectroscopy and Electron Paramagnetic Resonance have been used to characterize their structure.19–21 Additionally, Transmission Electron Microscopy and Scanning Electron Microscopy have been used to characterize their morphology in solar cells applications.16,21 It is noteworthy that ab initio22,23 and molecular dynamics (MD) simulations24–27 have been recently performed for poly(3-hexylthiophene-2,5-diyl) (P3HT), a polymer with a structure similar to ETE-S. It should be stressed however that P3HT is not a self-doped conducting polymer, and its morphology is very different from that of ETE-S. MD simulations of morphology of doped conducting polymers have been recently performed for the case of molecular counterions for PEDOT:TOS,28 but we are not aware of any theoretical simulation of the morphology of self-doped conducting polymers or oligomers. We therefore hope that our simulations will shed light on the atomistic structure and morphology of self-doped oligomers on sub- and nanometer scales, as well as will motivate further theoretical studies of self-doped oligomers and polymers.
2. Methods
A computational methodology previously published by the authors28 was implemented in the present work in order to investigate the crystallization of ETE-S in an aqueous solution and in the oligomer cast film.2.1 Ab initio calculations
In order to account for the localized nature of charge carriers in ETE-S, we calculated the partial charges on each atom using first-principles density-functional theory (DFT) with the functional WB97XD29 and the 6-31+g(d) basis set30 as implemented in Gaussian package.31 The partial charge per atom was taken from the fitting to electrostatic potential (ESP)32 population analysis as implemented in Gaussian suite.312.2 Molecular dynamics simulations
The General AMBER Force Field (GAFF)33 was used by employing the moltemplate code.34 Simulations were carried out with Large-scale Atomic/Molecular Massively Parallel Simulator (LAMMPS) software suite.35 Water molecules were described by a model of SPC/E.36 ETE-S chains and water molecules were randomly placed in a computational box of a typical size of 10 × 10 × 10 nm3, using a script written in-house. This simulation box on the average contained ≈100![[thin space (1/6-em)]](https://www.rsc.org/images/entities/char_2009.gif) 000 atoms. The system was then minimized and equilibrated by 30 ns run of canonical NVT (at 293.15 K) ensemble using the Nose–Hoover thermostat37–39 and the time integration method of Verlet.40 Then, water was consecutively removed in 8 steps, such as the water concentration was reduced from 83.3 wt% (initial solution) to 71.3 wt%, 62.4 wt%, 45.3 wt%, 29.3 wt%, 17.2 wt% and 13.0 wt%. The system was equilibrated in each step by a NpT (at 1 atm and 293.15 K) ensemble for 10 ns run with both barostat and thermostat as Nose–Hoover.37–39 The radial distribution functions g(r) were calculated as implemented in GROMACS package.41 X-ray diffraction patterns were simulated as described by Coleman et al.42 and implemented in LAMMPS suite.35
000 atoms. The system was then minimized and equilibrated by 30 ns run of canonical NVT (at 293.15 K) ensemble using the Nose–Hoover thermostat37–39 and the time integration method of Verlet.40 Then, water was consecutively removed in 8 steps, such as the water concentration was reduced from 83.3 wt% (initial solution) to 71.3 wt%, 62.4 wt%, 45.3 wt%, 29.3 wt%, 17.2 wt% and 13.0 wt%. The system was equilibrated in each step by a NpT (at 1 atm and 293.15 K) ensemble for 10 ns run with both barostat and thermostat as Nose–Hoover.37–39 The radial distribution functions g(r) were calculated as implemented in GROMACS package.41 X-ray diffraction patterns were simulated as described by Coleman et al.42 and implemented in LAMMPS suite.35
2.3 Synthesis of ETE-S oligomer
The synthesis of the ETE-S has been performed as described in ref. 10.2.4 Solution cast film preparation
Fresh solution of ETE-S in deionized water, 1 mg ml−1 was prepared in a vial. The solution was left in room temperature within the vial with the lid open. After 48 hours, polymerization has occurred due to air oxidation and the solution was drop cast on glass substrate and let to dry at room temperature to form a film.2.5 GIWAXS measurements
The structure of the polymerized ETE-S films was probed by Grazing Incidence Wide Angle X-ray Scattering (GIWAXS) experiments that were performed on the Dutch-Belgian Beamline (DUBBLE CRG), station BM26B, at the European Synchrotron Radiation Facility (ESRF), Grenoble, France.43 For a detailed description on this method please refer to the review papers in ref. 44 and 45. The wavelength of the X-rays, λ, was 1.033 Å while the sample-to-detector distance and the angle of incidence, αi, were set at 17 cm and 0.15°, respectively. The angle of incidence that was used is above the critical angle of ETE-S (0.1° at the X-ray energy used herein which is 12 keV) and just below that of the substrate (0.16° at 12 keV). This configuration allows probing the crystalline structure in the entire film.45 The diffracted intensity was recorded by a Frelon CCD camera and was normalized by the incident photon flux and the acquisition time (30 s). Flat field, polarization, solid angle and efficiency corrections were subsequently applied to the 2D GIWAXS images. The scattering vector q was defined with respect to the center of the incident beam and has a magnitude of q = (4π/λ)sin(θ), where 2θ is the Bragg reflection angle. Herein we opted to present the wedge-shaped corrected images where qr and qz are the in-plane and near out-of-plane scattering vectors, respectively. The scattering vectors are defined as follows: qx = (2π/λ)(cos(2θf)cos(αf) − cos(αi)), qy = (2π/λ)(sin(2θf)cos(αf)), qz = (2π/λ)(sin(αf) + sin(αi)), qr2 = qx2 + qy2 where αf is the exit angle in the vertical direction and 2θf is the in-plane scattering angle.46 Therefore, the scattering vector is calculated as follows, q2 = qr2 + qz2.3. Results and discussion
3.1 Formation of crystallites and percolation paths
Given the difficulty in quantifying the concentration of the oligomer in the plant conditions and the corresponding water content in the casted films, we study the crystallization of ETE-S for a broad range of water contents, starting from a solution of 83 wt% and removing water step by step until reaching a dry phase as described in the Methods section. In a previous experimental work,10 it was elucidated by Liquid Chromatography-Mass Spectrometry (LC-MS) and 1H-NMR spectroscopy that ETE-S can polymerize up to chain lengths of n = 2–3 units. In the present study, we thus consider lengths of ETE-S oligomers n = 1, 2 and 3. In its pristine state (i.e. as polymerized), each oligomer is oxidized, i.e. positively charged polarons (usually referred to as radical cations in the chemical nomenclature) are generated in the backbone of the ETE-S chains. The oxidation is produced via self-doping where positive charges in the backbone are compensated by negative charges on the sulfonic groups SO3− to maintain the charge neutrality of the oligomer. In the pristine state the oxidation level of the self-doped ETE-S is 33% i.e. one positive charge per three rings of the backbone. The charge distribution for an oligomer of n = 3 units is illustrated in Fig. S1.†Fig. 1a–c show typical structure conformations of ETE-S in solution. Only the snapshots corresponding to a solvent content of 29.3 wt% are shown for clarity. For the ETE-S monomers (n = 1) there is not any evidence of formation of π–π stacking (Fig. 1a), whereas ETE-S dimers and trimers (n = 2 and 3 respectively) exhibit a formation of small crystallites due to the π–π stacking of the chains with a stacking distance rπ–π = 3.5 Å, see Fig. 1b and c. Visual inspection of production snapshots for different water content shows that the crystallites typically consist of two or three π–π stacked oligomers. This is confirmed by the calculation of the radial distribution function g(r) for the distance between ETE-S chains, see Fig. 2d. For ETE-S dimer and trimers the radial distribution g(r) exhibits peaks at r/rπ–π = 1, 2, which corresponds to crystallites consisting of two and three chains respectively. Note that g(r) does not show any peaks for ETE-S monomers.
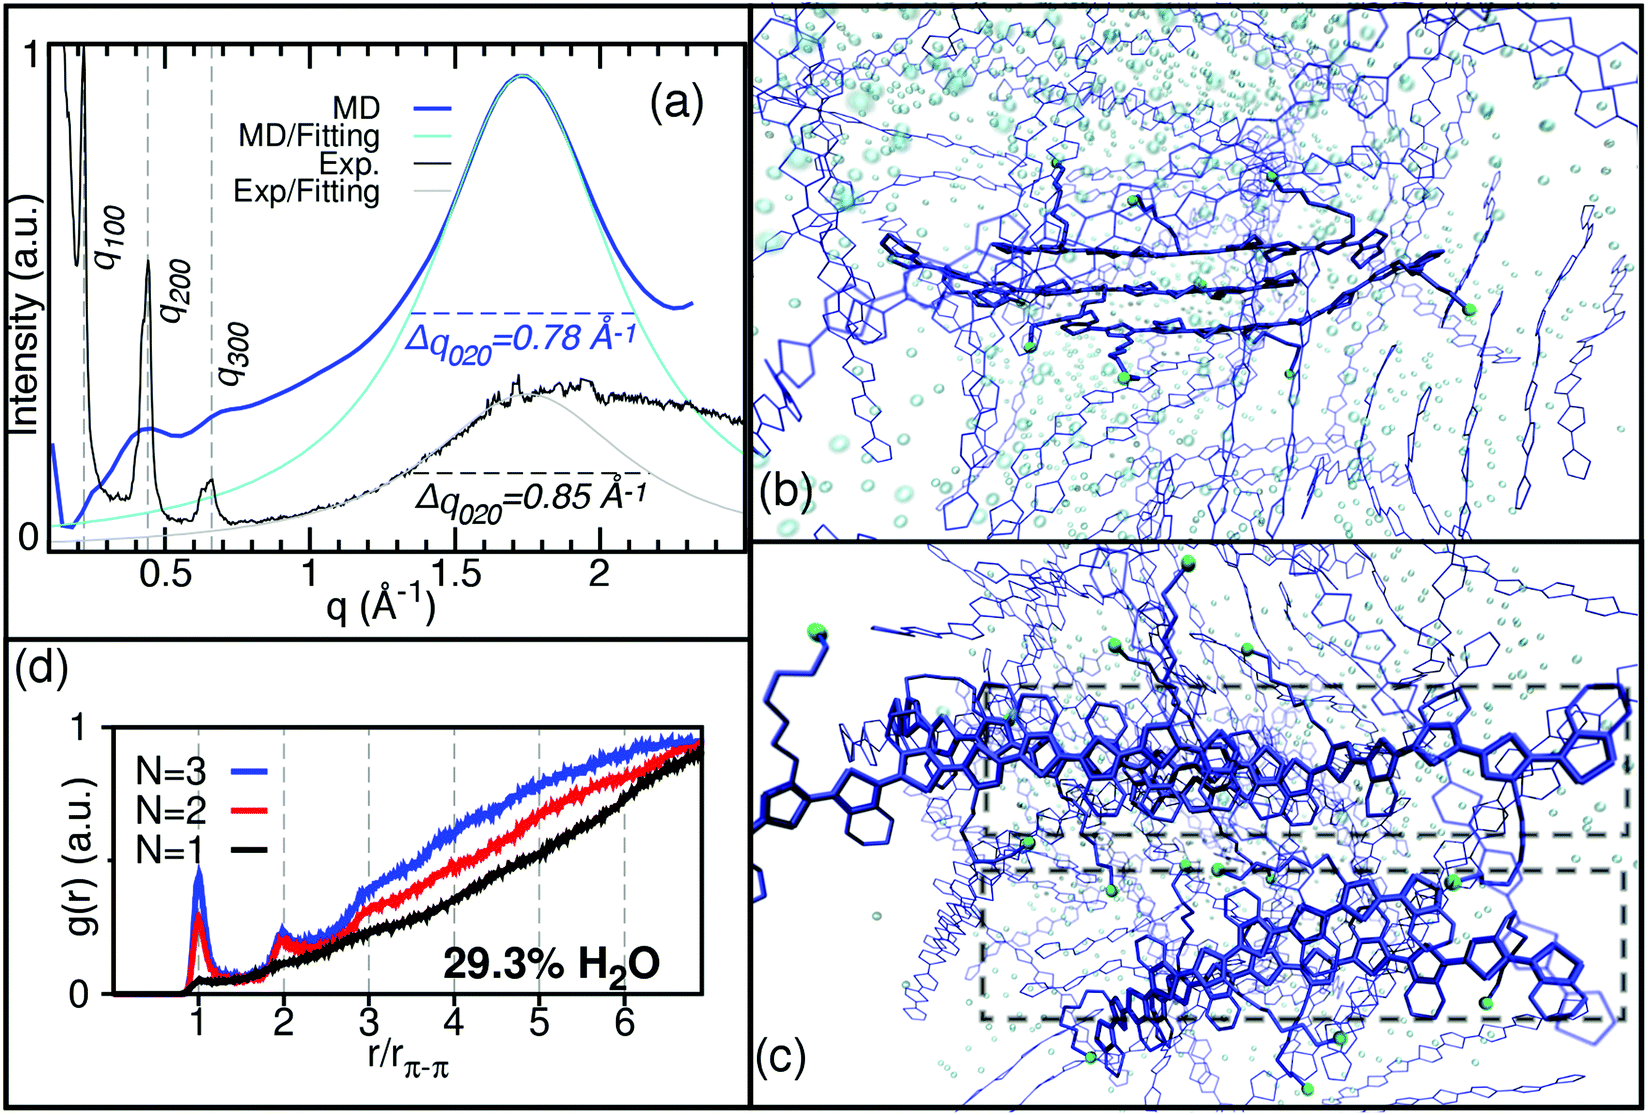 | ||
| Fig. 2 (a) Experimental GIWAXS pattern of the cast oligomer film cast and calculated X-ray diffraction pattern on the simulated ETE-S, n = 3 at a water content of 29.3 wt%. (d) Radial distribution function between oligomer chains with n = 1, 2 and 3. (b)–(c) The production snapshot with n = 3 from side and top view, respectively. ETE-S chains are represented in blue, sulfonate groups are illustrated by the S atom in green and water molecules by O atoms in light blue. H atoms are not shown. Rectangular boxes in (c) show two neighboring crystallites outlining the formation of lamellar structure. | ||
It has been experimentally demonstrated that xylem wires filled with in vivo polymerized ETE-S show a rather high conductivity (in the range of 10 S cm−1).10 In conducting polymers charge transport is caused by phonon-assisted hopping between or along the chains when charge carriers follow percolative paths through the system.47 It is therefore of interest to study the formation of the percolative paths in the system at hand. Fig. 1b and c shows representative percolative paths for ETE-S dimers and trimers. Note that percolative paths are absent in ETE-S monomers, see Fig. 1a. (The percolative paths are defined as those where charge carriers can jump along the backbone of the same oligomer chain or between neighboring π–π stacked chains.28) For dimers and trimers, the percolative paths include both crystallites and oligomers not belonging to crystallites. The latter provide the linkage between different crystallites, which gives rise to the percolative paths that extend throughout the whole structure, despite the fact that the crystallites are small and consist of only two or three oligomers. Our calculations showing the existence of the percolative paths explain the observed high conductivity in in vivo polymerized ETE-S.10 It is noteworthy that our simulations are also consistent with previous experimental findings where it was argued that good crystallinity is not necessary for high conductivity in conducting polymers provided the linkage between the individual polymeric chains leads to the formation of percolation paths in the system.48–50
3.2 Structural characterization
GIWAXS measurements have been conducted to elucidate the structure of the polymerized ETE-S oligomer. The (qr, qz) 2D scattering pattern of the solution-cast film is presented in Fig. 3. Anisotropical scattering is observed with three well-apparent diffraction peaks apparent along the near out-of-plane direction qz (where qr ≈ 0). These peaks testify the presence of crystallites in the film. In order to further study the properties of these crystallites, the 1D intensity vs. q scattering pattern was derived and is presented in Fig. 2a. Based on this, the maximum intensities of the diffraction peaks are located at q = 0.22 Å−1, 0.44 Å−1 and 0.66 A−1. The relative position of these peaks (q*, 2q*, 3q*) and their decreasing intensity suggest that they belong to the same family of reflections and that they correspond to an ordered lamellar structure. Following the interpretation by Aasmundtveit et al.,51 we assign these peaks to the h00 family of reflections of the oligomer crystallites, the h00 direction being perpendicular to the trimers backbone (c-axis) and along the EDOT direction (alternatively, along the aliphatic side chain direction). Therefore, the corresponding lattice size is α = 2π/q* = 28.5 Å. This size is big enough to commensurate the length of the two aliphatic chains that are extended on both sides of the backbone, i.e. the SO3−–SO3− distance as depicted in Fig. 1b and c. In fact, a closer look at the data shows that the 200 and 300 peaks can be deconvoluted in three peaks, located at 0.4 Å−1, 0.42 Å−1 and 0.44 Å−1 respectively, as far as the 200 peak is concerned (see Fig. S2† for details in an enlarged scale). Their close vicinity and the limited resolution at the low q's inhibit their deconvolution for the 100 peak. These could be suggestive of a slight disorder of the crystalline structure.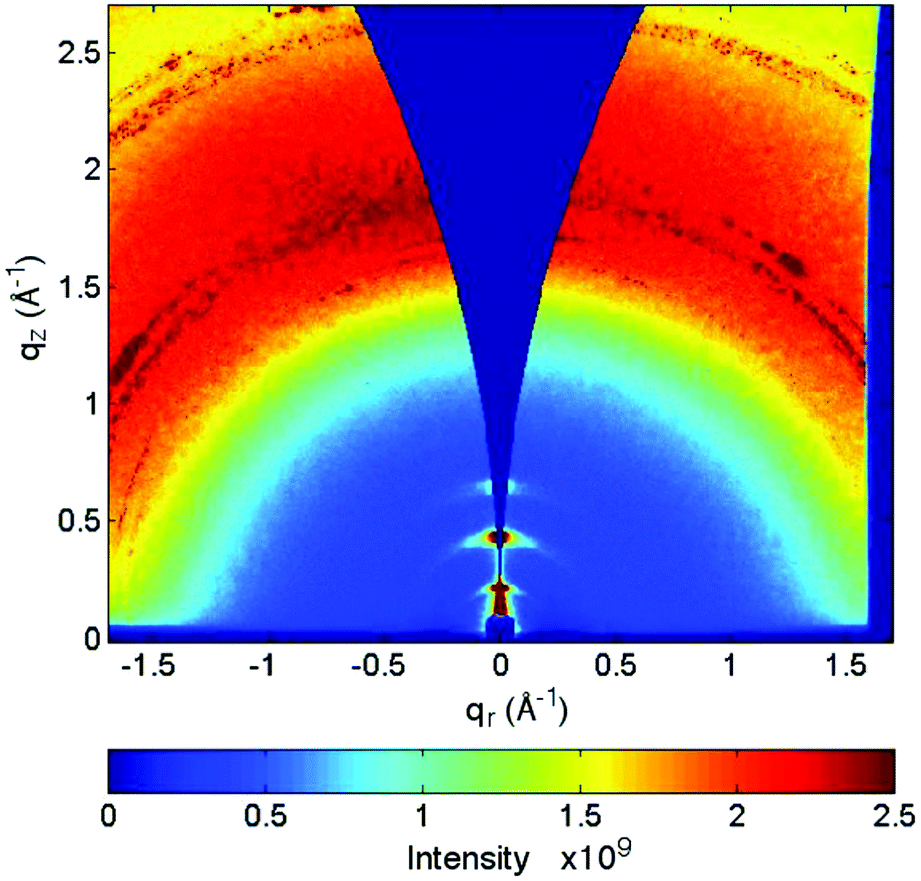 | ||
| Fig. 3 2D GIWAXS image of a film of trimer that has been polymerized from solution. | ||
Besides the h00 family, a broad peak is present at around q = 1.8 Å−1. The peak position and width are reminiscent of diffraction that arises from a quite disordered π–π stacking. Therefore, it can be assigned to the 020 peak.51 In order to extract the crystallite size L in the π–π stacking direction the Sherrer's equation52 is used,
 | (1) |
The experimental GIWAXS characterization of the ETE-S film is consistent by the results of MD simulations of the X-ray diffraction pattern. The X-ray diffraction pattern and morphology of conducting polymers are sensitive to the water content as experimentally shown for PEDOT:PSS53 and theoretically demonstrated in the MD simulations for PEDOT:TOS.28 Thus, we calculated the X-ray diffraction pattern for each water evaporation step to match the experimental GIWAXS pattern, see Fig. S3.†Fig. 2a shows the calculated X-ray diffraction pattern for ETE-S trimers with water content of 29.3 wt% where the best agreement in the peak width with the experimental pattern is found. The fitting of the main peak at q = 1.8 Å−1 (corresponding to the π–π stacking) gives the full width at the half maximum Δq020 = 0.78 Å−1. According to eqn (1) this corresponds to a crystallize size L020 = 8.1 Å, which matches very well the experimental value L020 = 7.4 Å extracted from the GIWAXS measurements. It is noteworthy that the calculated crystallite size L020 = 8.1 Å (corresponding to three chains in the π–π stacking) is fully consistent with the corresponding result obtained in section 3.1 from the analysis of the distribution function g(r) for the distance between ETE-S chains (Fig. 2d).
In addition to the main peak at q = 1.8 Å−1 the calculated diffraction pattern of ETE-S trimer exhibits three weak and broad peaks, located at q-values that agree well with the experimentally observed h00 peaks (q ≈ 0.25 Å−1, 0.44 Å−1 and 0.66 A−1). Therefore, we attribute these peaks to the formation of a lamellar structure along the a-axis (h00) direction, created by the aliphatic side chains, in consistence with the experimental results. This lamellar structure is well apparent in Fig. 2c which shows the production snapshots of the ETE-S trimer structure. The organization of the crystallites into lamellae is illustrated by dashed squares. According to the snapshot, two lamellae are separated by a lamellar-d spacing ≈ 14 Å along the aliphatic side chain direction. This spacing is half with respect to the α-lattice size of 28.5 Å that was calculated based on the experimental 100 diffraction peak. Yet it corresponds well to the d-spacing that is calculated based on the peak at q ≈ 0.4 Å−1 on the calculated diffraction pattern (Fig. 2a). We note that this later peak is more intense with respect to the calculated peak at q ≈ 0.25 Å−1 which corresponds to the experimental 100 peak. We attribute this to the fact that the computational box used herein has a typical size of 10 × 10 × 10 nm3, which is not big enough to reproduce the periodicity along the α-lattice direction. Moreover, the snapshot in Fig. 2c reveals a significant disorder of the aliphatic chains between the two lamellae. This disorder is expressed as a broad halo between 0.3 Å−1–1 Å−1 in the calculated diffraction pattern, on top of which the three broad h00 peaks are superposed. Note that the molecules within the computational box are not incurred to external factors that could affect their orientation or structuration. The snapshot corresponds, thus, to a bulk material and not to a thin, confined film. However, the molecules in a real film experience additional forces thanks to their interactions with the substrate. Therefore, a preferential orientation may be adopted and an increase in order may be expected, as is the case herein; the fact that the h00 peaks lie along the near out-of-plane direction qz (where qr ≈ 0) in the GIWAXS image (Fig. 3) indicates that the molecules are oriented with the aliphatic chain direction perpendicular to the substrate (edge-on orientation), in consistence with what has been already observed for PEDOT-based films.54–56 In our calculations we do not take into account the substrate contribution and thus our calculations point towards a much less ordered system along the α-lattice direction. It is noteworthy that weak lamellar peaks in the calculated X-ray diffraction pattern (with the intensity smaller than the experimental ones) have been already reported for PEDOT:TOS.28 Finally, we note that onset of the lamellas formation is also seen for ETE-S dimer, but it is less pronounced in comparison to the ETE-S trimer, cf. Fig. S3a and S3b.†
3.3 Geometry conformation of ETE-S oligomer
In order to describe the distribution of sulfonate groups around the ETE-S chains, the radial distribution function between sulfur in SO3− functional group and sulfur in thiophene ring, gs–s(r), was calculated and plotted in Fig. 4a. Also, the distribution function P(ϕ) for dihedral angles, ϕ, along the whole aliphatic chains (i.e. an average over all bonds) was calculated as shown and defined in Fig. 4b. In addition, the distribution function P(θ) for the angle θ between the thiophene ring, O-ether and the S-sulfonate (as defined in Fig. 4c) was calculated. In order to visualize the bending of the aliphatic chains, we plot together all the chains in the system with their backbone atoms in thiophene rings superposed, see Fig. 4d–f. This structural superposition was performed by the least-squares fitting algorithm as implemented in GROMACS suite,41 which finds an optimal rotation and translation by minimizing the sum of the squared distances among all structures in the superposition.57 This representation provides a graphical interpretation of the radial distribution function gS–S(r), and distribution functions P(ϕ) and P(θ). The distribution gs–s(r) shows three main peaks at r ≈ 4.8–5 Å (α), 8–8.5 Å (β) and 11–11.5 Å (γ). Fig. 4d and c indicate conformations of aliphatic chains contributing to the peaks α, β and γ for ETE-S oligomers of the lengths n = 1, 2, 3. The intensities of peaks α and γ respectively decreases and increases when n is increased. This is because crystallites contain fewer oligomers for the case of ETE-S dimers than for ETE-S trimers (Fig. 3d) and therefore, sulfonates groups can fold closer to the surface of thiophene rings for the case of shorter oligomers. This behavior is consistent with the distribution of the dihedral angles P(ϕ), where the main central peak at ϕ = 180° is lower for shorter oligomers, whereas the extra peak at ϕ = 70° and its complementary at ϕ = 290° are instead higher, see Fig. 4b. Note that full straight aliphatic chain should generate a single peak ϕ = 180°. The bending of the whole aliphatic chain at the O-ether is described by the distribution function P(θ), see Fig. 4c; the bending becomes more pronounced for longer oligomers. | ||
| Fig. 4 (a) Radial distribution function gS–S(r) for the distance between S from SO3 and S from the thiophene ring for different chain lengths, n. (b) Probability distribution function, P(ϕ) and definition of dihedral angle between neighbouring atoms in the aliphatic chain, ϕ. (c) Probability distribution function, P(θ) and definition of the angles between aryl-C, ether-O and sulfonate-S, θ. (d)–(f) Folding of sulfonates groups (green spheres) on the plane of ETE-S chains (blue) is visualized by plotting them with their thiophene rings aligned; chain lengths n = 1, 2, 3 respectively; water content is 29% w/w. No hydrogen atoms are showed. Circles and ellipses indicate the corresponding location of the SO3 groups given by peaks α, β, γ in the distribution function gS–S(r) in (a). | ||
Finally, we note that the distribution functions gS–S(r), P(ϕ) and P(θ) are affected by the formation of lamellar structure because the sulfonic groups belonging to oligomers in one crystallite can bend over to the backbone of oligomers in a neighboring crystallite as can be seen in Fig. 2c.
4. Conclusions
The recently synthesized self-doped conducting oligomer ETE-S represents a very promising material for green energy applications and bioelectronics because of its ability of in vivo polymerization inside living plants.10 Improving its material properties and developing device applications require detailed understanding of the morphology of this material. In the present study, we combine theoretical modelling of ETE-S morphology using atomistic molecular dynamics simulation and its experimental characterization using GIWAXS. To the best of our knowledge our study represents the first theoretical simulation of the morphology of a self-doped conducting oligomer.The experimental GIWAXS measurements show the formation of small crystallites composed of up to 3 π–π stacked oligomers separated by a stacking distance rπ–π = 3.5 Å. The crystallites are further organized in h00 lamellae structures. Our molecular dynamics simulations are in a good agreement with the experimental findings. In particular, the calculated X-ray diffraction pattern matches well the experimental one, and the calculated results reproduce well the π–π stacking distance, the size of crystallites and the formation of lamellar structures. Our simulations demonstrate the formation of the percolative paths that extend throughout the whole structure, despite the fact that that crystallites are small and consist of only two or three oligomers. The existence of the percolative paths explains the observed high conductivity in in vivo polymerized ETE-S.10 We also study the geometrical conformation of ETE-S oligomers and bending of their aliphatic chains depending on the oligomer lengths.
The agreement between theory and experiment demonstrates the predictive power of the molecular dynamics simulations and we hope that our results would motivate further theoretical studies of related conducting polymers.
Conflicts of interest
There are no conflicts to declare.Acknowledgements
This work was supported by the Swedish Energy Agency (grant 38332-1), and Knut and Alice Wallenberg Foundation (Project “The Tail of the Sun”). The computations were performed on resources provided by the Swedish National Infrastructure for Computing (SNIC) at NSC. E. S. is also supported by a Marie Sklodowska Curie Individual Fellowship (MSCA-IF-EF-ST, Trans-Plant, 702641). The ESRF and NWO are acknowledged for allocating beam time at the Dutch-Belgian beamline (DUBBLE) for the GIWAXS experiments.References
- N. K. Guimard, N. Gomez and C. E. Schmidt, Prog. Polym. Sci., 2007, 32, 876–921 CrossRef CAS.
- E. Stavrinidou, O. Winther-Jensen, B. S. Shekibi, V. Armel, J. Rivnay, E. Ismailova, S. Sanaur, G. G. Malliaras and B. Winther-Jensen, Phys. Chem. Chem. Phys., 2014, 16, 2275–2279 RSC.
- S. M. Richardson-Burns, J. L. Hendricks, B. Foster, L. K. Povlich, D. H. Kim and D. C. Martin, Biomaterials, 2007, 28, 1539–1552 CrossRef CAS PubMed.
- D. Khodagholy, J. N. Gelinas, Z. Zhao, M. Yeh, M. Long, J. D. Greenlee, W. Doyle, O. Devinsky and G. Buzsaki, Sci. Adv., 2016, 2, e1601027–e1601027 Search PubMed.
- Z. T. Zhu, J. T. Mabeck, C. Zhu, N. C. Cady, C. A. Batt and G. G. Malliaras, Chem. Commun., 2004, 1556–1557, 10.1039/b403327m.
- X. Strakosas, M. Huerta, M. J. Donahue, A. Hama, A.-M. Pappa, M. Ferro, M. Ramuz, J. Rivnay and R. M. Owens, J. Appl. Polym. Sci., 2017, 134, 44483 CrossRef.
- A. Jonsson, Z. Song, D. Nilsson, B. A. Meyerson, D. T. Simon, B. Linderoth and M. Berggren, Sci. Adv., 2015, 1, e1500039 Search PubMed.
- D. T. Simon, E. O. Gabrielsson, K. Tybrandt and M. Berggren, Chem. Rev., 2016, 116, 13009–13041 CrossRef CAS PubMed.
- E. Stavrinidou, R. Gabrielsson, E. Gomez, X. Crispin, O. Nilsson, D. T. Simon and M. Berggren, Sci. Adv., 2015, 1, 1–8 Search PubMed.
- E. Stavrinidou, R. Gabrielsson, K. P. Nilsson, S. K. Singh, J. F. Franco-Gonzalez, A. V. Volkov, M. P. Jonsson, A. Grimoldi, M. Elgland, I. V. Zozoulenko, D. T. Simon and M. Berggren, Proc. Natl. Acad. Sci. U. S. A., 2017, 114, 2807–2812 CrossRef CAS PubMed.
- L. Ouyang, C. L. Shaw, C. C. Kuo, A. L. Griffin and D. C. Martin, J. Neural Eng., 2014, 11, 026005 CrossRef PubMed.
- J. Saghaei, A. Fallahzadeh and M. H. Yousefi, Org. Electron., 2015, 19, 70–75 CrossRef CAS.
- J. Saghaei, A. Fallahzadeh and T. Saghaei, Org. Electron., 2015, 24, 188–194 CrossRef CAS.
- A. Fallahzadeh, J. Saghaei and M. H. Yousefi, Appl. Surf. Sci., 2014, 320, 895–900 CrossRef CAS.
- J. Ouyang, C. W. Chu, F. C. Chen, Q. Xu and Y. Yang, Adv. Funct. Mater., 2005, 15, 203–208 CrossRef CAS.
- K.-G. Lim, S. Ahn, H. Kim, M.-R. Choi, D. H. Huh and T.-W. Lee, Adv. Mater. Interfaces, 2016, 3, 1500678 CrossRef.
- M. R. Choi, T. H. Han, K. G. Lim, S. H. Woo, D. H. Huh and T. W. Lee, Angew. Chem., Int. Ed., 2011, 50, 6274–6277 CrossRef CAS PubMed.
- A. V. Volkov, S. K. Singh, E. Stavrinidou, R. Gabrielsson, J. F. Franco-Gonzalez, A. Cruce, W. M. Chen, D. T. Simon, M. Berggren and I. V. Zozoulenko, Adv. Electron. Mater., 2017, 3, 1700096 CrossRef.
- J. Yue and A. J. Epstein, Macromolecules, 1991, 24, 4441–4445 CrossRef CAS.
- J. Yue, Z. H. Wang, K. R. Cromack, A. J. Epstein and A. G. MacDiarmid, J. Am. Chem. Soc., 1991, 113, 2665–2671 CrossRef CAS.
- J. Lee, H. Kang, S. Kee, S. H. Lee, S. Y. Jeong, G. Kim, J. Kim, S. Hong, H. Back and K. Lee, ACS Appl. Mater. Interfaces, 2016, 8, 6144–6151 CAS.
- Y. K. Lan and C. I. Huang, J. Phys. Chem. B, 2008, 112, 14857–14862 CrossRef CAS PubMed.
- Y. K. Lan and C. I. Huang, J. Phys. Chem. B, 2009, 113, 14555–14564 CrossRef CAS PubMed.
- S. Dag and L. W. Wang, J. Phys. Chem. B, 2010, 114, 5997–6000 CrossRef CAS PubMed.
- K. Do, D. M. Huang, R. Faller and A. J. Moule, Phys. Chem. Chem. Phys., 2010, 12, 14735–14739 RSC.
- C. Melis, L. Colombo and A. Mattoni, J. Phys. Chem. C, 2011, 115, 576–581 CAS.
- K. N. Schwarz, T. W. Kee and D. M. Huang, Nanoscale, 2013, 5, 2017–2027 RSC.
- J. F. Franco-Gonzalez and I. V. Zozoulenko, J. Phys. Chem. B, 2017, 121, 4299–4307 CrossRef CAS PubMed.
- Y. S. Lin, G. D. Li, S. P. Mao and J. D. Chai, J. Chem. Theory Comput., 2013, 9, 263–272 CrossRef CAS PubMed.
- R. Krishnan, J. S. Binkley, R. Seeger and J. A. Pople, J. Chem. Phys., 1980, 72, 650–654 CrossRef CAS.
- M. J. Frisch, G. W. Trucks, H. B. Schlegel, G. E. Scuseria, M. A. Robb, J. R. Cheeseman, G. Scalmani, V. Barone, G. A. Petersson, H. Nakatsuji, X. Li, M. Caricato, A. V. Marenich, J. Bloino, B. G. Janesko, R. Gomperts, B. Mennucci, H. P. Hratchian, J. V. Ortiz, A. F. Izmaylov, J. L. Sonnenberg, D. Williams-Young, F. Ding, F. Lipparini, F. Egidi, J. Goings, B. Peng, A. Petrone, T. Henderson, D. Ranasinghe, V. G. Zakrzewski, J. Gao, N. Rega, G. Zheng, W. Liang, M. Hada, M. Ehara, K. Toyota, R. Fukuda, J. Hasegawa, M. Ishida, T. Nakajima, Y. Honda, O. Kitao, H. Nakai, T. Vreven, K. Throssell, J. A. Montgomery Jr., J. E. Peralta, F. Ogliaro, M. J. Bearpark, J. J. Heyd, E. N. Brothers, K. N. Kudin, V. N. Staroverov, T. A. Keith, R. Kobayashi, J. Normand, K. Raghavachari, A. P. Rendell, J. C. Burant, S. S. Iyengar, J. Tomasi, M. Cossi, J. M. Millam, M. Klene, C. Adamo, R. Cammi, J. W. Ochterski, R. L. Martin, K. Morokuma, O. Farkas, J. B. Foresman and D. J. Fox, Gaussian, Inc., Wallingford CT, 2016.
- U. C. Singh and P. A. Kollma, J. Comput. Chem., 1984, 5, 129–145 CrossRef CAS.
- J. Wang, R. M. Wolf, J. W. Caldwell, P. A. Kollma and D. A. Case, J. Comput. Chem., 2004, 25, 1157–1174 CrossRef CAS PubMed.
- A. Jewett, Moltemplate, http://www.moltemplate.org, (accessed November 18, 2015).
- S. Plimpton, J. Comput. Chem., 1995, 117, 1–19 CAS.
- H. J. C. Berendsen, J. P. M. Postma, W. F. van Gunsteren and J. Hermans, in Intermolecular Forces: Proceedings of the Fourteenth Jerusalem Symposium on Quantum Chemistry and Biochemistry Held in Jerusalem, Israel, April 13–16, 1981, ed. B. Pullman, Springer Netherlands, Dordrecht, 1981, pp. 331–342, DOI:10.1007/978-94-015-7658-1_21.
- W. Shinoda, M. Shiga and M. Mikami, Phys. Rev. B: Condens. Matter, 2004, 69, 134103 CrossRef.
- G. J. Martyna, D. J. Tobias and M. L. Klein, J. Chem. Phys., 1994, 101, 4177–4189 CrossRef CAS.
- M. Parrinello and A. Rahman, J. Appl. Phys., 1981, 52, 7182–7190 CrossRef CAS.
- M. E. Tuckerman, J. Alejandre, R. López-Rendón, A. L. Jochim and G. J. Martyna, J. Phys. A: Math. Gen., 2006, 39, 5629–5651 CrossRef CAS.
- B. Hess, C. Kutzner, D. van der Spoel and E. Lindahl, J. Chem. Theory Comput., 2008, 4, 435–447 CrossRef CAS PubMed.
- S. P. Coleman, D. E. Spearot and L. Capolungo, Modell. Simul. Mater. Sci. Eng., 2013, 21, 055020 CrossRef.
- W. Bras, I. P. Dolbnya, D. Detollenaere, R. van Tol, M. Malfois, G. N. Greaves, A. J. Ryan and E. Heeley, J. Appl. Crystallogr., 2003, 36, 791–794 CrossRef CAS.
- A. Hexemer and P. Muller-Buschbaum, IUCrJ, 2015, 2, 106–125 CrossRef CAS PubMed.
- P. Muller-Buschbaum, Adv. Mater., 2014, 26, 7692–7709 CrossRef PubMed.
- G. Renaud, R. Lazzari and F. Leroy, Surf. Sci. Rep., 2009, 64, 255–380 CrossRef CAS.
- S. D. Baranovskii, Phys. Status Solidi B, 2014, 251, 487–525 CrossRef CAS.
- R. Noriega, J. Rivnay, K. Vandewal, F. P. Koch, N. Stingelin, P. Smith, M. F. Toney and A. Salleo, Nat. Mater., 2013, 12, 1038–1044 CrossRef CAS PubMed.
- X. Zhang, H. Bronstein, A. J. Kronemeijer, J. Smith, Y. Kim, R. J. Kline, L. J. Richter, T. D. Anthopoulos, H. Sirringhaus, K. Song, M. Heeney, W. Zhang, I. McCulloch and D. M. DeLongchamp, Nat. Commun., 2013, 4, 2238 Search PubMed.
- S. Wang, S. Fabiano, S. Himmelberger, S. Puzinas, X. Crispin, A. Salleo and M. Berggren, Proc. Natl. Acad. Sci. U. S. A., 2015, 112, 10599–10604 CrossRef CAS PubMed.
- K. E. Aasmundtveit, E. J. Samuelsen, L. A. A. Petterson, O. Inganäs, T. Johansson and R. Feidenhans, Synth. Met., 1999, 101, 561–564 CrossRef CAS.
- D. M. Smilgies, J. Appl. Crystallogr., 2009, 42, 1030–1034 CrossRef CAS PubMed.
- C. M. Palumbiny, F. Liu, T. P. Russell, A. Hexemer, C. Wang and P. Muller-Buschbaum, Adv. Mater., 2015, 27, 3391–3397 CrossRef CAS PubMed.
- L. Viani, C. Risko, M. F. Toney, D. W. Breiby and J. L. Bredas, ACS Nano, 2014, 8, 690–700 CrossRef CAS PubMed.
- A. Ugur, F. Katmis, M. Li, L. Wu, Y. Zhu, K. K. Varanasi and K. K. Gleason, Adv. Mater., 2015, 27, 4604–4610 CrossRef CAS PubMed.
- I. Petsagkourakis, E. Pavlopoulou, G. Portale, B. A. Kuropatwa, S. Dilhaire, G. Fleury and G. Hadziioannou, Sci. Rep., 2016, 6, 30501 CrossRef PubMed.
- A. D. McLachlan, Acta Crystallogr., Sect. A: Cryst. Phys., Diffr., Theor. Gen. Cryst., 1982, 38, 871–873 CrossRef.
Footnote |
| † Electronic supplementary information (ESI) available. See DOI: 10.1039/c7nr04617k |
| This journal is © The Royal Society of Chemistry 2017 |