
 Open Access Article
 This Open Access Article is licensed under a
 Creative Commons Attribution 3.0 Unported Licence
Multifunctional nanoparticles for co-delivery of paclitaxel and carboplatin against ovarian cancer by inactivating the JMJD3-HER2 axis
Jingxin
Mo†
a,
Li
Wang†
a,
Xiaojia
Huang
a,
Bing
Lu
a,
Changye
Zou
b,
Lili
Wei
c,
Junjun
Chu
a,
Paul K.
Eggers
d,
Shen
Chen
a,
Colin L.
Raston
 e,
Jun
Wu
*f,
Lee Yong
Lim
*g and
Wei
Zhao
*a
e,
Jun
Wu
*f,
Lee Yong
Lim
*g and
Wei
Zhao
*a
aKey Laboratory for Stem Cells and Tissue Engineering, Ministry of Education, Sun Yat-sen University, Guangzhou 510080, China. E-mail: zhaowei23@mail.sysu.edu.cn
bMusculoskeletal Oncology Center, the First Affiliated Hospital of Sun Yat-sen University, Guangzhou, China
cPharmacy, the Affiliated Hospital of Guilin Medical University, China
dSchool of Chemistry and Biochemistry, The University of Western Australia, 35 Stirling Highway, Crawley, WA 6009, Australia
eCentre for Nanoscale Science and Technology, School of Chemical and Physical Sciences, Flinders University, Bedford Park, SA 5042, Australia
fGuangdong Provincial Key Laboratory of Sensor Technology and Biomedical Instrument, School of Engineering, Sun Yat-sen University, Guangzhou, 510006, Guangdong, P. R. China. E-mail: wujun29@mail.sysu.edu.cn
gPharmacy, School of Allied Health, University of Western Australia, 35 Stirling Highway, Crawley, WA 6009, Australia. E-mail: lee.lim@uwa.edu.au
First published on 3rd August 2017
Abstract
Ovarian cancer (OC) is the most lethal gynecologic cancer. Survival statistics have show no significant developments over the last three decades, highlighting the fact that current therapeutic strategies require substantial improvements. In this study, we designed a novel folic acid-PEG-conjugated p-phosphonated calix[4]arene nanoparticle (Fp-PCN) for the simultaneous delivery of paclitaxel (PAC) and carboplatin (CAR) at an optimal ratio (5![[thin space (1/6-em)]](https://www.rsc.org/images/entities/char_2009.gif) :1, mol:mol) to utilize their potential synergistic effect against OC cells. The Fp-PCNs loaded with PAC and CAR (Fp-PCNPAC+CAR) resulted in a remarkable efficacy in the suppression of OC, both in vitro and in vivo. Compared to free drugs, Fp-PCNPAC+CAR showed stronger apoptosis induction as well as invasion and self-renewal capacity suppression in SKOV-3 cells. The molecular mechanism to address the synergism is that Fp-PCNPAC+CAR downregulated JMJD3 expression to modulate the H3K27me3 epigenetic mark of the promoters of HER2 and MYCN. Furthermore, the expressions of JMJD3 and HER2 were significantly associated with poor outcomes for ovarian patients. Our study demonstrates that co-delivery of PAC and CAR can be achieved with the Fp-PCNs, and reveals a previously unrecognized and unexpected role of the JMJD3-HER2 signaling axis in PAC and CAR treatment of OC.
:1, mol:mol) to utilize their potential synergistic effect against OC cells. The Fp-PCNs loaded with PAC and CAR (Fp-PCNPAC+CAR) resulted in a remarkable efficacy in the suppression of OC, both in vitro and in vivo. Compared to free drugs, Fp-PCNPAC+CAR showed stronger apoptosis induction as well as invasion and self-renewal capacity suppression in SKOV-3 cells. The molecular mechanism to address the synergism is that Fp-PCNPAC+CAR downregulated JMJD3 expression to modulate the H3K27me3 epigenetic mark of the promoters of HER2 and MYCN. Furthermore, the expressions of JMJD3 and HER2 were significantly associated with poor outcomes for ovarian patients. Our study demonstrates that co-delivery of PAC and CAR can be achieved with the Fp-PCNs, and reveals a previously unrecognized and unexpected role of the JMJD3-HER2 signaling axis in PAC and CAR treatment of OC.
Introduction
Ovarian cancer (OC) is the most lethal of all gynecologic malignancies. The chief reason for the high mortality rate for OC is platinum-resistance, leading to exhaustion of available treatment options.One of the methods to tackle platinum-resistance is the combined usage of paclitaxel (PAC) and carboplatin (CAR). The so-called synergistic effects involving PAC and CAR can be advantageous, both for overcoming multidrug resistance and for palliating the side effects.1 For the purpose of co-encapsulating dual therapies and then controlling release in the targeted area, several nano-formulation approaches have been attempted.2–4 However, due to the significant differences between PAC and CAR in molecular weight and water solubility, the traditional nanocarriers for co-delivery of PAC and CAR often involving covalent bonding would have huge difficulties in maintaining the drug loading ratio and controlled simultaneous release. Therefore, there is an urgent need to develop novel nanovehicles with the aim of overcoming these difficulties.5
Another method is re-sensitization of resistant/refractory ovarian cancer using an epigenetic inhibitor. Whole-genome sequencing data of high-grade serous OC show that gene breakage of the tumor suppressors RB1, NF1, RAD51B and PTEN contributes to acquired chemotherapy resistance. Moreover, the high rate of epigenetic changes in OC tumors generates clonal molecular diversity that can cause the evolution of drug resistance during treatment. Pharmacological inhibition of epigenetic factors can achieve re-sensitization of tumor cells to chemotherapy. Some such drugs (DNA methylation inhibitors, HDAC inhibitors etc.) have been in clinical trials, showing promising success. However, such small-molecule inhibitors are void for the targeting of a wide range of biomolecules which lack defined binding pockets. Recently, a reverse approach of using supramolecular hosts to bind to a certain PTM (post-translational modifications) has been developed. Some aromatic macrocycles such as p-sulfonatocalix[4]arene have been found to bind selectively and with high affinity to histone trimethyllysine motifs that are relevant to gene regulation and oncogenesis.
Inspired by this finding, a novel calix[4]arene derivative of P-Cali4-HE (p-phosphonated calix[4]arene with hexane chains) (Fig. 1A) was designed as an epigenetic inhibitor and a surfactant as well. The size of aromatic macrocycles and the number of negative charges of p-phosphonated calix[4]arene, as determining factors for high affinity to histone trimethyllysine motifs, were consistent with those for p-sulfonatocalix[4]arene. Then four hexane chains were attached to the lower rim of p-phosphonated calix[4]arene. The resultant P-Cali4-HE is an amphiphilic compound with the ability to act as a surfactant. Moreover, one of the four phosphorus groups on the top rim will be replaced by the folate ligand for targeted delivery purpose.
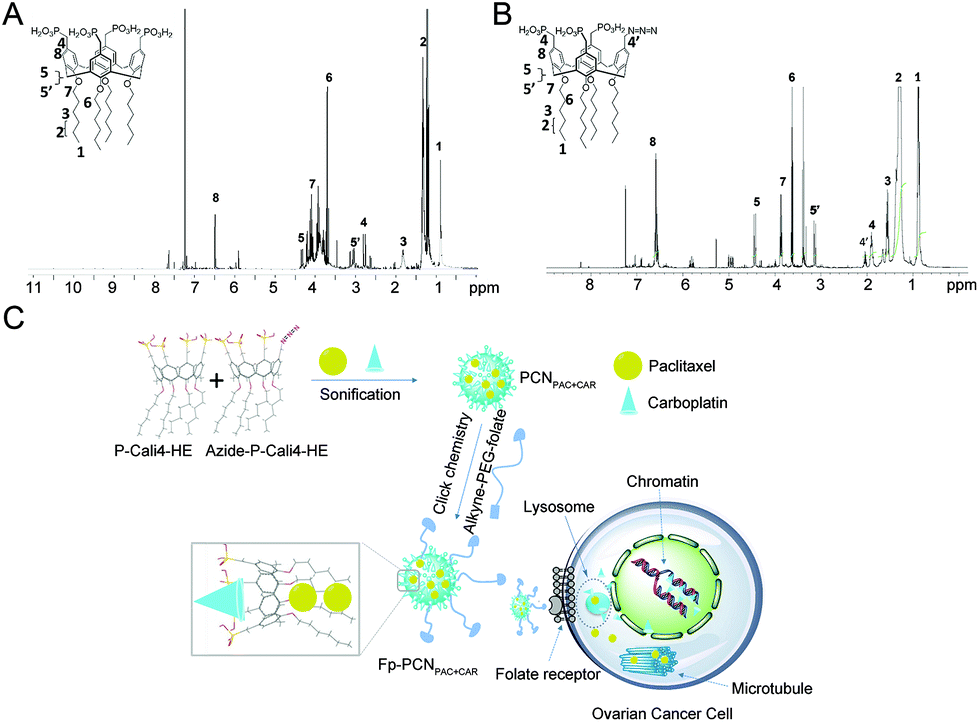 | ||
| Fig. 1 Characterization of the p-phosphonated calix[4]arene nanoparticles (PCN) and their derivative. 1H NMR spectra for (A) P-Cali4-HE (MeOD/CDCl3, 500 MHz): peak 1 = 0.88 (t, 3J = 7.17 Hz, 12H), peak 2 = 1.33 (m, 24H), peak 3 = 1.82 (m, 8H), peak 4 = 2.77 (d, 2J = 21.0 Hz, 8H), peak 5 = 3.05, peak 5′ = 4.33 (2d, 2J = 12.7 Hz, 2 × 4H), peak 6 = 3.70 (m, 8H), peak 7 = 4.25 (t, 3J = 7.16 Hz, 8H) and (B) Azide-P-Cali4-HE (MeOD/CDCl3, 500 MHz): peak 1 = 0.2 (t, 3J = 7.23 Hz, 12H), peak 2 = 1.25 (m, 24H), peak 3 = 1.58 (m, 8H), peak 4 = 1.85 (d, 2J = 22.4 Hz, 6H), peak 4′ = 2.08 (d, 2J = 28.2 Hz, 2H), peak 5 = 3.17, peak 5′ = 4.44 (2d, 2J = 12.2 Hz, 2 × 4H), peak 6 = 3.61 (m, 8H), peak 7 = 4.84 (t, 3J = 7.41 Hz, 8H). (C) Schematic illustrations of paclitaxel (PAC) and carboplatin (CAR) loading and intracellular performance of Fp-PCNPAC+CAR. | ||
Therefore, the aims of our study were to evaluate the anti-tumor effects of folic acid-PEG-conjugated phosphonated calix[4]arene nanoparticles (Fp-PCN) loaded with PAC and CAR (Fp-PCNPAC+CAR) in OC cells (Fig. 1C). In addition, we sought to determine whether the epigenetic regulation of gene expression was involved in the anti-tumor effects and whether the affected pathway signals could predict the clinical outcomes after PAC and CAR treatment.
Experimental section
Materials
PAC and CAR were obtained from Aladdin Chemical Reagent Co., Ltd, and fetal bovine serum (FBS) was purchased from Gibco. A Cell Titer-Glo® Luminescent Cell Viability Assay was acquired from Promega Biotech Co., Ltd. Annexin V-FITC/PI apoptosis kits were purchased from Lianke Technology Co., Ltd. A Matrigel® basement membrane matrix was obtained from Corning. Fluorescein 5(6)-isothiocyanate (FITC) (MW = 389.38) was obtained from Aladdin Chemical Reagent Co., Ltd. 4′,6-Diamidino-2-phenylindole (DAPI) was acquired from Sigma-Aldrich. 4% Paraformaldehyde was purchased from Guangzhou Ruishu Biotechnology Co., Ltd. Thermo Scientific™ Nunc™ glass bottom dishes and Lipofectamine 3000 reagent were purchased from Thermo Fisher Scientific Inc. Plastic cell culture dishes and plates were obtained from Thermo Fisher Scientific Inc.Cells
SKOV-3 cells, HO-8910 cells and A549 cells were acquired from Guangzhou Ji Niou Biotechnology Co., Ltd (Guangzhou, China). SKOV-3 cells and A549 cells were cultured in a complete medium (Dulbecco's modified Eagle's medium (DMEM) supplemented with 10% FBS and 1 mM L-glutamine).Animals
Female BALB/c nude mice (18 ± 2 g) were purchased from the Model Animal Research Center of Nanjing University (Nanjing, China) and maintained under standard sterile and pathogen-free (SPF) housing conditions. All animal experiments were performed under the guidance of the ethics committee of Sun Yet-Sen University (approval no. IACUC-DB-15-1209).Synthesis of the compounds P-Cali4-HE and Azide-P-Cali4-HE
The synthetic steps up to and including alkylation have been described previously. The formulation reaction, which was the lowest yielding reaction (70% yield), has been adapted from the method of Dondoniet et al. All subsequent reactions were completed in nearly quantitative yields.Particle size distribution and zeta-potential
The mean particle size and particle size distribution of the nanoparticles were determined using dynamic light scattering (Malvern Zetasizer Nano ZS). The change in particle size was determined at room temperature for 24 h to observe the aggregation of nanoparticles. The zeta potential of the nanoparticles was measured at room temperature after appropriate dilution with distilled deionized water.Morphology of PCNPAC+CAR and Fp-PCNPAC+CAR
The morphology of the PCNPAC+CAR and Fp-PCNPAC+CAR nanoparticles was observed via transmission electron microscopy (TEM) (JEM-2100, JEOL Ltd). In order to prepare the sample, the nanoparticles were diluted with distilled water, dropped on a formvar-coated copper grid (300 mesh, hexagonal fields), dried with filter paper, and then air-dried for 1 min at room temperature. After the sample was air-dried overnight at room temperature, it was observed via TEM.Entrapment efficiency and drug loading of PAC and CAR in nanoparticles
PAC and CAR loading in the PCNs and Fp-PCNs was simultaneously quantified by liquid chromatography-time of flight mass spectrometry (LC-TOF/MS) using an adapted literature-reported method. Detection and quantification were performed via electrospray ionization (ESI) in the positive ionization mode with selective ion monitoring (SIM) at m/z 876.3224 for PAC and m/z 310.0152 for CAR. The standard curves for PAC and CAR were y = 255.21x + 62.18 (R2 = 0.999) and y = 0.23x + 78.06 (R2 = 0.996), respectively.The concentration of PAC or CAR was determined via LC-TOF/MS after appropriate dilution. The entrapment efficiency (EE) was calculated using the following equation:

The drug loading (DL) of PAC or CAR in the freeze-dried nanoparticle powder was calculated using the following equation:

The EE and DL of PAC and CAR were determined from three separately prepared nanoparticle suspensions, and were expressed as the mean ± standard deviation.
Cytotoxicity of the P-Cali4-HE formulations against SKOV-3 OC cells
The cell viability of HO-8910, SKOV-3 and A549 cell lines treated with the three drug preparations was evaluated using the CellTiter-Glo Luminescent Cell Viability Assay (Promega). Cancer cells were seeded in 96-well plates (Fisher Scientific) at 3 × 10³ cells per well. After 24 hours of attachment to the bottom of the plates, cells were treated with free PAC + CAR solution (molar ratio of PAC:CAR = 5:1), PCNPAC+CAR or Fp-PCNPAC+CAR, respectively. The IC50 value of the nanoparticles is given by the concentration of PAC that inhibited cellular viability. All treatments were performed in triplicate and in three independent experiments. The cells were incubated for 48 h before 50 μl of the CellTiter-Glo reagent was added into each well for a further 30 minute incubation. The plate was read using a Synergy™ HTX multi-mode reader (BioTek). The relative dose-responsive cell survival percentages compared to the drug-free control were plotted against the PAC concentration. Half-maximum inhibitory concentrations (IC50 values as determined from the dose–response curves) were calculated using GraphPad Prism 7.0.
Cellular uptake mechanism
1 mL SKOV-3 and A549 cells in the logarithmic growth phase were cultured in Thermo Scientific™ Nunc™ glass bottom dishes with a density of 5 × 10⁵ cells per ml. For detection via flow cytometry or confocal microscopy, 5 μmol of FITC was incorporated in place of PAC, as described above, to obtain PCNFITC and Fp-PCNFITC. Different FITC formulations were separately added to obtain a final concentration of 2 μmol. After incubation for 2 h at 37 °C under 5% CO2, the supernatant was aspirated. The cells were then rinsed three times with cold PBS. A paraformaldehyde solution (4%) was used to fix the cells for 15 min at room temperature. Cell nuclei were stained by incubation with 1 mL DAPI solution for 3 min. After the supernatant was discarded, the cells were further rinsed three times with PBS. In each well, 0.2 mL of fresh PBS was added before the glass base dish was set in the dark box. The FITC fluorescence intensity of each dish was analyzed via confocal microscopy.Annexin V/propidium iodide (PI) apoptosis detection
After incubation with different formulations for 48 h, SKOV-3 cells were digested and collected by 157g centrifugation for 5 min. The cells were rinsed twice with PBS and re-suspended in 500 μL of binding buffer. After 2.5 μL of Annexin V and 5 μL of PI were added for each well, the solution was mixed and incubated in the dark for 15 min. Cell apoptosis was analyzed via flow cytometry.Wound healing assay
The effects of different formulations on the migratory activity of SKOV-3 cells were examined via the wound healing assay. Cells were plated into six-well plates and cultured in a 5% CO2 incubator for 24 h until completely confluent. The cell monolayer was scratched with a 200 μL pipette tip to make a wound, and washed twice with PBS (to remove any floaters), and the medium was then replaced with 0.5% fetal bovine serum/DMEM. Cells were subjected to the indicated treatments for 24 h, and cells migrating from the leading edge were photographed using a light microscope. Cell migration was quantified by measuring the area of the scratch at each of these time points and was presented as the percentage of cells that migrated compared with the area of the scratch at time 0.Cell invasion assay
In vitro invasion assays were conducted using a Falcon® 24 Well Permeable Support Companion Plate. Briefly, cells (4 × 10⁴) in 300 μL serum-free DMEM were seeded onto the upper chambers for 24 h before 800 μL DMEM with 10% serum was added to the lower chambers. Cells that had not penetrated the filter were wiped out using cotton swabs, and cells that had migrated to the lower surface of the filter were stained with 0.5% crystal violet for 30 min and counted using a light microscope in five randomly selected fields (magnification: 40×). Each assay was done in triplicate.3D preparation of tumor spheroids
To form three-dimensional tumor spheroids, SKOV-3 cells were seeded at a density of 5 × 10³ cells per 100 mL per well in a Corning® 96 Well Ultra Low Attachment Microplate. Several days after the cells were seeded, tumor spheroids were treated with PCNFITC and Fp-PCNFITC at a final concentration of 2.5 μg ml−1. After 4 h of incubation, the spheroids were rinsed three times with ice-cold PBS and fixed with 4% paraformaldehyde for 15 min. Then, the spheroids were transferred to glass-bottom Petri dishes and covered with glycerophosphate. The fluorescence intensity was observed using a confocal microscope (LSM710) and further quantified via flow cytometry (BD Fortesa).Ex vivo tumor imaging
For ex vivo imaging studies, after the tumor reached ∼1 cm in diameter, groups of mice were injected with 100 mL saline, 50 mg of a near-infrared dye (DiR) in 100 mL saline, and an equivalent amount of DiR loaded PCN (PCNDiR) in 100 mL saline or DiR loaded Fp-PCN (Fp-PCNDiR) in 100 mL saline. The mice were sacrificed and the tumor tissues were stripped off. Fluorescence images were taken at 4 and 6 h after intra-tumor injection using a PerkinElmer IVIS instrument (Waltham) with excitation at 748 nm and absorption at 780 nm to collect the fluorescence emission of DiR.Tumor xenograft mouse studies
Five- to six-week-old, nu/nu female BALB/c mice were obtained from the Model Animal Research Center of Nanjing University. The animals were allowed a period of adaptation in a sterile and pathogen-free (SPF) environment with food and water provided ad libitum. SKOV-3 tumor cells (5 × 10⁶; 200 μL of PBS) were injected subcutaneously into the right armpit of female BALB/c mice. Treatment with different formulations was initiated when tumors reached a volume of 200 mm3. The nude mice were randomly divided into four groups, with five mice per group. PAC + CAR (molar ratio of PAC:CAR = 5:1, 5 mg PAC per kg) and an equivalent amount (calculated using PAC concentration) of PCNPAC+CAR, Fp-PCNPAC+CAR, and saline (negative control group) were administered via intratumor injection once every other day after the animal weights and tumor volumes were measured. The tumor volume was calculated according to the following equation:
Tumors were not allowed to grow beyond a critical size of 4000 mm3, in accordance with the Institutional Animal Care guidelines. Once the maximum tumor volume was reached, the animal was euthanized with pentobarbital. The tumor tissues were completely stripped off and then fixed in 4% formaldehyde, embedded in paraffin, and cut into 5.0 mm sections. After hematoxylin and eosin (HE) staining, the histology of tumor tissue was observed with an optical microscope (Olympus, Tokyo, Japan).
JMJD3 shRNA gene silencing
JMJD3 and non-specific control lentiviral shRNAs were purchased from Shanghai Transheep Biotech Co. JMJD3 shRNA targeting sequences are: shRNA-1, TTGAGCACAAACGGAACTATG; shRNA-2, AGATTCTTTCTATGGGCTTTA. SKOV-3 cells were transduced with lentivirus harboring different shRNAs individually. Before being used for further experiments, cells were cultured with 2 μg ml−1 puromycin for 5 days to remove the uninfected cells.qPCR assay
Total RNA was isolated using an RNeasy Mini Kit (Qiagen). Reverse transcription was performed using SuperScript III reverse transcriptase (Invitrogen). Real-time PCR (qPCR) was performed using Power SYBR® PCR Master Mix (Life Technologies). All reactions were performed in triplicate. qPCR primers are detailed in Table 1.| Gene (human) | Forward | Reverse |
|---|---|---|
| HER2 | CCAGACCATAGCACACTCGG | GACGCCTTCAGCACGAACT |
| BCL2 | GGTGGGGTCATGTGTGTGG | CGGTTCAGGTACTCAGTCATCC |
| RB1 | TTGGATCACAGCGATACAAACTT | AGCGCACGCCAATAAAGACAT |
| GAPDH | CTGGGCTACACTGAGCACC | AAGTGGTCGTTGAGGGCAATG |
| JMJD3 | CGCTGCCTCACCCATATCC | ATCCGCGACCTCTGAACTCT |
| LSD1 | TGACCGGATGACTTCTCAAGA | GTTGGAGAGTAGCCTCAAATGTC |
| MYCN | CACGTCCGCTCAAGAGTGTC | GTTTCTGCGACGCTCACTGT |
| E2F1 | CATCCCAGGAGGTCACTTCTG | GACAACAGCGGTTCTTGCTC |
| HER2 (ChIP-qPCR) | CGGGAGCAAGACAAATGG | GCAGTGCGAAGAGCAGAAC |
| MYCN (ChIP-qPCR) | CCCTGCTATTTTGCACCTT | GACCGATGCTTCTAACCCA |
| BCL2 (ChIP-qPCR) | AAGCGGTCCCGTGGATAGA | TTCGCAGAAGTCCTGTGATGTT |
ChIP-qPCR analysis
SKOV-3 cells were grown to 80–90% confluence and were chemically cross-linked by the addition of a formaldehyde solution to a final concentration of 1% for 10 min at room temperature. Cells were rinsed twice with cold PBS followed by the addition of 2 M glycine to stop crosslinking. Cells were lysed and sonicated to solubilize and shear cross-linked DNA, with a minor modification. The resulting whole cell extract was pre-cleared and then incubated overnight at 4 °C with 15 μL protein A/G agarose beads, 10 μL IgG, 10 μL 5% bovine serum albumin (BSA), 2 μg of the appropriate antibodies, and 20 μg of sheared salmon sperm DNA. Beads were washed four times the next day. Bound complexes were eluted from the beads, and crosslinking was reversed by incubation at 65 °C for 4 h. Whole cell extract DNA was also treated for reverse crosslinking. Immunoprecipitated DNA and whole cell extract DNA were purified and analyzed. ChIP-PCR primers are detailed in Table 2.| Tested samples | Diametera (nm) | Polydispersity indexa | Zeta potentiala (mV) | EE (%) of PACb | DL (%) of PACb | EE(%) of CARb | DL (%) of CARb | Molar ratio of PAC:CARc |
|---|---|---|---|---|---|---|---|---|
| a Determined via DLS. b Analyzed via LC-TOF/MS as described before.8. c Calculated using DLs of PAC and CAR. | ||||||||
| PCNPAC+CAR | 159.6 ± 23.1 | 0.237 ± 0.087 | −32.07 ± 6.48 | 89.67 ± 6.57 | 3.78 ± 0.19 | 55.4 ± 3.47 | 8.58 ± 0.27 | 1:0.19 |
| Fp-PCNPAC+CAR | 183.6 ± 19.4 | 0.274 ± 0.062 | −26.09 ± 5.5 | 88.45 ± 5.19 | 3.52 ± 0.05 | 48.6 ± 5.47 | 7.37 ± 0.54 | 1:0.21 |
Statistical analysis
Statistical differences were evaluated with a Student's t-test and analysed using one-way analysis of variance (ANOVA) for multiple groups. *P < 0.05, **P < 0.01 and ***P < 0.001.Results and discussion
Characterization of nanoparticles and drug encapsulation
Our studies showed that, among the PCNs, P-Cali4-HE is an excellent vesicle for encapsulating PAC and CAR, respectively.6,7 The encapsulation efficiency (EE) of PAC was 89.67 ± 6.57% and that of CAR was 55.4 ± 3.47% in PCN carriers. When placed into Fp-PCN carriers according to a previous method with a minor modification,6 the EE of PAC (88.45 ± 5.19%) and CAR (48.6 ± 5.47%) were changed a little (Table 2). We found that the molar ratio of PAC to CAR in both PCN and Fp-PCNs is fixed (about 1:0.2) regardless of the feeding concentration of the drugs. This result suggests that multiple therapeutic agents could be co-delivered with a single nano-carrier. More importantly, the fixed ratio of drug loading increases the feasibility of clinical applications.
The size distributions of the PCNPAC+CAR and Fp-PCNPAC+CAR nanoparticles were determined using dynamic light scattering (DLS) measurements. As shown in Fig. 2A, the diameter of the PCNPAC+CAR nanoparticles is 159.6 ± 23.1 nm at room temperature. The mean particle size was increased following conjugation with the PEG-Folic Acid (FA) ligand, but the size distribution remained narrow. Besides the size, the surface zeta potential of the Fp-PCNPAC+CAR was also responsive to the surface attachment of the PEG-FA ligand. The zeta potential of Fp-PCNPAC+CAR showed a decrease from −32.07 ± 6.48 mV to −26.09 ± 5.5 mV as the negative charges of the phosphonated groups became partially masked by the PEG chain. Having a net negative surface charge could improve the blood compatibility and blood circulation time of the nanoparticles.
 | ||
| Fig. 2 Solution behaviors of the nanoparticles. (A) Hydrodynamic size distributions of p-phosphonated calix[4]arene nanoparticles loaded with paclitaxel (PAC) and carboplatin (CAR) (PCNPAC+CAR), folic acid-PEG conjugation PCNPAC+CAR (Fp-PCNPAC+CAR) estimated via dynamic light scattering. (B) Transmission electron microscopy (TEM) images of PCNPAC+CAR and Fp-PCNPAC+CAR. Scale bar = 200 nm, arrows indicate carboplatin in a PCNPAC+CAR or PEG shell in Fp-PCNPAC+CAR. (C) Release profile of paclitaxel and carboplatin from folic acid-PEG-conjugated phosphonated calix[4]arene nanoparticles (Fp-PCNPAC+CAR) under acidic (pH 5.5) and neutral (pH 7.4) conditions. The data in panels are plotted as the mean ± SD with the indicated significance (**P < 0.01, according to a Student's t-test). | ||
The morphologies of the nanoparticles were studied via TEM. TEM micrographs showed most of the PCNPAC+CAR and Fp-PCNPAC+CAR to be uniformly spherical in shape and homogeneous in size distribution (Fig. 2B), which correlate with the DLS data. The PCNPAC+CAR has CAR as black spots evenly distributed on the surface while the Fp-PCNPAC+CAR has a core–shell structure with the PEG coating (arrows) observable as a corona. These data again indicate the successful preparation of the PCNPAC+CAR and Fp-PCNPAC+CAR nanoparticles.
Drug-release kinetics for Fp-PCNPAC+CAR under acidic and neutral conditions
Drug release kinetics for Fp-PCNPAC+CAR were monitored at 37 °C and different pH values (7.4 and 5.5) using a dialysis bag method as described before.6 As shown in Fig. 2C, Fp-PCNPAC+CAR was stable at pH 7.4, releasing only 20% of its PAC and CAR cargoes after 2 days at 37 °C. At pH 5.5 and 37 °C, however, about 30% of PAC and 25% of CAR were released from Fp-PCNPAC+CAR during the initial 8 h, and this increased to 66% of PAC and 58% of CAR released at 48 h. The enhanced drug-releasing properties of the P-Cali4-HE platform under acidic conditions, compared to neutral conditions, has been ascribed to the four head groups of phosphonate whose pKa1 is nearly 7.2. At pH < 7.2, P-Cali4-HE will become less soluble and this in turn destabilizes the drug-loaded nanoparticles.Cellular uptake behavior of the dual-drug loaded nanoparticles
Fluorescein 5(6)-isothiocyanate (FITC) is a widely used fluorophore; its high quantum efficiency and stability when encapsulated in nanoparticles allows tracking of the nanoparticles by confocal microscopy and quantifying by flow cytometry techniques. To investigate whether Fp-PCNFITC was taken up by cells through the folic acid receptor (FR)-mediated endocytosis, Fp-PCNFITC with and without 2 mM free folic acid solution were incubated with FR-expressing SKOV-3 cells for 8 h. The fluorescence of FITC emitting from the incubated cells was studied by confocal laser-scanning fluorescence microscopy (CLSM). As shown in Fig. 3A, after 8 h of incubation, an improved distribution of FITC in the cytoplasm of SKOV-3 cells was detected in the group of Fp-PCNFITC alone, suggesting that more Fp-PCNFITC were taken up through FR-mediated endocytosis. However, the fluorescence intensities of the cells that were cultured with both Fp-PCNFITC and 2 mM folic acid were weak, indicating that folic acid receptor expressed on SKOV-3 cells may mostly be occupied by free folates. A549 cells under similar Fp-PCNFITC uptake experimental conditions exhibited weaker fluorescence intensities, compared to the SKOV-3 cells. The difference in fluorescence intensities caused by co-incubation with free folates was also subtle in the A549 cells. | ||
| Fig. 3 Cellular uptake behavior of the dual-drug loaded nanoparticles. (A) Cellular uptake and localization of different fluorescein 5(6)-isothiocyanate (FITC) formulations in SKOV-3 and A549 cancer cells observed via confocal microscopy; scale bar = 25 μm. (B) In vitro uptake and penetration evaluation of FITC loaded folic acid-PEG-conjugated p-phosphonated calix[4]arene nanoparticles (Fp-PCNFITC) and PCNFITC. (B, left) Bright light image of SKOV-3 or A549 cell spheroids. (B, right) Cellular uptake of Fp-PCNFITC and PCNFITC with SKOV-3 cells or A549 cells. (C) Confocal laser scanning microscopy images showing fluorescence intensities of different sections in SKOV-3 or A549 tumor spheroids after incubation with Fp-PCNFITC and PCNFITC. Scale bar = 100 μm. (D) Fluorescence intensities of SKOV-3 cells quantified via flow cytometry after being treated with Fp-PCNFITC and PCNFITC; (E) tumor affinity of different DiR formulations at 0 h, 4 h and 6 h. All the typical results are from three independent experiments. | ||
The uptake of the cell monolayer shown above might not exactly imitate the behavior of the nanoparticles within the solid tumor due to more complex situations such as modest drug permeation, distorted enzyme activities, and escalated oxygen tension present in the solid tumor.9–11 To mimic that actual situation, 3D tumor spheroids were constructed to investigate the uptake of the nanoparticles. The fluorescence intensity of Fp-PCNFITC in the outer layer of SKOV-3 tumor spheroids was clearly seen (Fig. 3B and C). The distributions of PCNFITC in different sections of SKOV-3 tumor spheroids were weak, indicating PCNFITC had difficulties in diffusing into hidden territories of the tumor spheroid. In contrast, the distribution of Fp-PCNFITC significantly increased in every section of the spheroid, indicating that particles with FA ligands may help penetrate into the tumor spheroids, probably through FA receptor-mediated uptake (Fig. 3B and C). Quantitative measurements of the fluorescence intensity of SKOV-3 tumor spheroids via flow cytometry confirmed the penetrating efficiency of PCNFITC and Fp-PCNFITC (Fig. 3D) and this was consistent with the results of Fig. 3B and C.
To show that the superior cellular uptake of Fp-PCNFITCin vitro could be translated into promising tumor targeting efficacy in vivo, DiR (a near-infrared dye) was encapsulated to form PCNDiR and Fp-PCNDiR and injected into tumor-bearing nude mice, which were euthanized at 4 h or 6 h post intra-tumoral injection of DiR, PCNDiR, or Fp-PCNDiR dispersions, and the tumors were collected and imaged. As shown in Fig. 3E, the DiR arm showed a low tumoral fluorescence intensity at 4 h, and this dropped to negligible levels at 6 h post injection, indicating that the free DiR was poorly retained at the tumor site. On the other hand, the fluorescence signals of the PCNDiR treatment arm remained at steady levels for up to 6 h post-injection. In comparison, the fluorescence intensity of tumor tissues in Fp-PCNDiR was observed to intensify going from 4 h to 6 h after injection. The intensification of fluorescence might be attributed to the time-dependent FA receptor-mediated uptake of the nanoparticles followed by the acid pH-triggered DiR release feature of Fp-PCNDiR in the tumor microenvironment. The combined mechanisms have the potential to avoid significant drug leakage from the nanoparticles into non-tumorigenic tissues during blood circulation.
Evaluation of the anticancer efficacy of PCNPAC+CAR and Fp-PCNPAC+CARin vitro and in vivo
To verify the synergistic effects of PAC and CAR in the Fp-PCN nanoparticle delivery system, the in vitro antitumor effects of free drugs and drug-loaded nanoparticles against OC cells were tested using the ATP bioluminescence assay. FR-positive HO-8910 and SKOV-3 cells were exposed to PAC + CAR (molar ratio 5:1) presented as either free PAC + CAR solution, PCNPAC+CAR, Fp-PCNPAC+CAR or Fp-PCNPAC+CAR with free folates. FR-negative A549 cells were used as the negative control. After 72 h incubation, all free drugs and drug-loaded nanoparticles showed dose-dependent inhibition of cancer cell proliferation. The drug-loaded nanoparticle formulations showed better efficacy than free co-drugs, possibly attributable to the pH-triggered drug-releasing properties of P-Cali4-HE. The difference in cytotoxicity toward HO-8910 and SKOV-3 cells between PCNPAC+CAR and Fp-PCNPAC+CAR was significant owing to the FA receptors on the HO-8910 and SKOV-3 cells, suggesting an enhanced binding affinity resulting from the multivalent binding nature of Fp-PCNPAC+CAR (Fig. 4A).
 | ||
| Fig. 4 Cell viabilities of ovarian cancer (OC) cells after treatment with different formulations in vitro and in vivo. (A) Dose–response curves for free paclitaxel (PAC) + carboplatin (CAR) solution, p-phosphonated calix[4]arene nanoparticles loaded with PAC and CAR (PCNPAC+CAR), folic acid-PEG-conjugated PCNPAC+CAR (Fp-PCNPAC+CAR) and Fp-PCNPAC+CAR with free folates after 96 h incubation, the corresponding IC50 for free PAC + CAR solution, PCNPAC+CAR, Fp-PCNPAC+CAR or Fp-PCNPAC+CAR with free folates. (B) Schematic diagram showing an in vivo xenograft model using the SKOV-3 and the time of drug injection used in the study. (C) Mice were treated with free paclitaxel (PAC) + carboplatin (CAR) solution, p-phosphonated calix[4]arene nanoparticles loaded with PAC + CAR (PCNPAC+CAR) or folic acid-PEG-conjugated PCNPAC+CAR (Fp-PCNPAC+CAR). Negative control cells were treated with blank PCN. (D) Images of excised SKOV-3 tumors in different groups of mice after treatment. (E) Cumulative body weight during treatment. All results are presented as data from three independent experiments. The data in panels are plotted as the mean ± SD with the indicated significance (***P < 0.001, according to a Student's t-test). | ||
On the basis of the above results, the in vivo antitumor efficacy of the dual drug-loaded nanoparticles was further investigated on SKOV-3 human ovarian tumor-bearing nude mice. Mice were treated with PBS and different drug formulations every 2 days via intra-tumor injection, and the tumor volume and the body weight were measured every 2 days (Fig. 4B). As shown in Fig. 4C and D, tumor growth was suppressed after successive intra-tumor injections of various PAC + CAR formulations, including PAC + CAR solution, PCNPAC+CAR and Fp-PCNPAC+CAR, compared with free PCN as a control. It is worth noting that Fp-PCNPAC+CAR showed a dominant effect on tumor inhibition compared with the other nanoparticles, further validating the synergistic effect on active-targeting and cell internalization of tumors by a combination of folate ligand and nanoparticle pH-responsive effects. The Fp-PCN vehicle also efficiently delivered its cargo to the desired sites of activity, thereby accomplishing an optimal antitumor efficacy. Obvious adverse effects did not appear, as the body weights of all groups increased at similar rates (Fig. 4E). The in vivo studies mentioned above have further shown that the strengths of dual-functional nano-particulates can be attributed to the combination of FA receptor targeting and tumor acidity-responsive features.
Effects of Fp-PCNPAC+CAR on OC cell cycle and apoptosis
The results summarized in Fig. 5A indicate that SKOV-3 cells treated with Fp-PCNPAC+CAR for a continuous 24 h period exhibited over 50% of the cells arrested at the G2/M-phase. Treatment with PCNPAC+CAR induced about 30% G2/M-phase cell arrest. However, upon the exposure of SKOV-3 cells to free PAC + CAR less than 10% of the cells were arrested at the G2/M-phase. These results clearly indicate that significantly more cells (p < 0.01) were arrested at the G2/M-phase when exposed to drug-loaded nanoparticles compared to the free drugs. These results also suggest that some proliferation inhibition events were caused by mitotic arrest. | ||
| Fig. 5 Effects of different drug formulations on cell cycle, apoptosis, migration, and invasion in SKOV-3 cells. (A) Cell cycle analysis of SKOV-3 after treatment with a negative control, a free PAC + CAR solution, PCNPAC+CAR, and Fp-PCNPAC+CAR for 48 h. (B) Flow cytometric analysis of SKOV-3 cells treated with a negative control, a free PAC + CAR solution, PCNPAC+CAR, and Fp-PCNPAC+CAR for 24 h. (C) Cells were scratched with a pipette tip and photographed (0 h); they were then treated with free PAC + CAR solution, p-phosphonated calix[4]arene nanoparticles loaded with PAC and carboplatin (PCNPAC+CAR) or folic acid-PEG-conjugated PCNPAC+CAR (Fp-PCNPAC+CAR). Negative control cells were treated with blank PCN. Cell migration was measured by a scratch assay and monitoring the migration of cells into the scratched area. Data are presented as percentage of cell migration, which indicates the scratched area at a given time as a proportion of the initial scratched area. Scale bar = 200 μm. (D) Cells were treated with different formulations in a serum-free medium for 24 h in Matrigel matrix coated invasion chambers. Cells which reached the bottom of the membranes were photographed (200× magnification). Each membrane was extracted and quantified. Each bar represents the mean ± SD for three independent experiments. A tumor sphere formation assay under (E) suspension culture conditions and (F) the Matrigel matrix was used to assess the self-renewal capacity of SKOV-3 cells treated with different drug formulations. The sphere number and cell number per sphere were counted after 7 days. Scale bar = 100 μm. All results are presented as data from three independent experiments. The data in panels are plotted as the mean ± SD with the indicated significance (*P < 0.05, **P < 0.01, ***P < 0.001, according to a Student's t-test). | ||
This high efficacy is also reflected in the flow cytometric analysis shown in Fig. 5B where PCNPAC+CAR resulted in 26.13 ± 2.06% apoptotic cells at 1 μM, compared to 8.95 ± 1.76% apoptotic cells at 1 μM of PAC + CAR. Thus, there was a 2.92-fold increase in cell mortality by loading the PAC and CAR into the bare nanoparticles. By introducing the FA ligand onto the nanoparticle surface, the cell mortality rate increased to 44.76%, which was a further 2.46-fold increase compared to that of the PAC + CAR solution. This increase is not due to the toxicity of P-Cali4-HE, with the flow cytometric analysis results showing 98.5% live cells for P-Cali4-HE at 5 μM (data not shown). The collective data suggest that the co-loading of PAC and CAR onto FA-PCN had evident superiority as compared with the free drug combination. Moreover, studying the connection between cell cycle arrest and apoptosis caused by co-loading of PAC and CAR may aid in identifying novel therapeutic target to improve the clinical outcome.
Effects of Fp-PCNPAC+CAR on OC cell migration, invasion, and sphere formation activity
For investigating the influences of different formulations on the in vitro motility and invasiveness of SKOV-3 cells, two experiments were performed. The wound healing analysis was carried out to examine whether different formulations hindered the SKOV-3 cells from migrating to the middle of the scratch. As depicted in Fig. 5C, after 96 h of incubation, the area of scratch dwindled differently among different groups. The wound was completely healed in the negative control group. The area of the scratch shrank from 100% to 54.26 ± 6.14% in the PAC + CAR solution treatment group, 43.6 ± 2.41% in the PCNPAC+CAR treatment group, and 23.72 ± 2.78% in the Fp-PCNPAC+CAR treatment group. To study the effects of different formulations on the invasiveness of SKOV-3 cells in a three-dimensional setting, the Boyden transwell chamber assay wasconducted. As depicted in Fig. 5D, the percentage of invasive cells also decreased significantly in the Fp-PCNPAC+CAR treatment group.Subsequently, we performed the sphere formation assay to investigate the effect of different formulations on the SKOV-3 self-renewal capacity. We found that the average number of colonies formed under suspension cell culture conditions by PCNPAC+CAR and Fp-PCNPAC+CAR treated cells was significantly lower than the number formed by free PAC + CAR and control cells (P < 0.001 and P < 0.001, respectively), and the sizes of the colonies were also reduced (Fig. 5E). To exclude the possibility of artifact induction by suspension cell culture, we further confirmed the above results in a mimic environment in vivo using a three-dimensional (3D) Matrigel cell culture assay. Consistent with the results obtained from the sphere formation assay, the average diameter of cancer spheroids formed from PCNPAC+CAR and Fp-PCNPAC+CAR treated cells was significantly lower than the diameter formed from free PAC + CAR and control cells in the 3D cell culture environment (Fig. 5F). These data show that OC cell invasiveness, migratory activity, and stemness were significantly suppressed after Fp-PCNPAC+CAR treatment.
JMJD3 as a novel target of Fp-PCNPAC+CAR in human OC cells
To determine the molecular mechanisms by which Fp-PCNPAC+CAR inhibits OC cell functions (proliferation, migration, invasion, and stemness), we performed an RNA-seq analysis of SKOV-3 cells in the presence of different formulations (Fig. 6A). Functional analysis of these differentially expressed genes revealed that Fp-PCNPAC+CAR regulates directly and/or indirectly the expression of more than 200 genes involved in many critical aspects of cancer functions (Fig. 6B). To understand the mechanisms by which Fp-PCNPAC+CAR regulates tumor functions more precisely, we defined the genes preferentially regulated in Fp-PCNPAC+CAR treated cells via qPCR assay. These genes included epigenetic regulators (for example, JMJD3), genes that control tumor stemness in OC malignancies (for example, HER2), cell proliferation (for example, RB1), apoptosis (for example, BCL-2) and metastasis (for example, MYCN).12–15 We found that JMJD3, BCL-2, MYCN, and HER2 levels strongly decreased with Fp-PCNPAC+CAR treatment (Fig. 6C). JMJD3 is an H3K27me3-specific demethylase, and the H3K27me3 results in suppression of transcription in mammalian cells.16 Therefore, we tested whether modulation of BCL-2, MYCN, and HER2 expressions by Fp-PCNPAC+CAR correlated with H3K27me3 as the gene promoter. The ChIP-qPCR assay using an H3K27me3 antibody showed that decreased MYCN and HER2 expressions in Fp-PCNPAC+CAR treated cells were associated with significantly increased H3K27me3 levels at the gene promoter region compared with free drug treated cells (Fig. 6D). However, we did not find a difference in H3K27me3 levels at the BCL-2 promoter region. | ||
| Fig. 6 Folic acid-PEG-conjugated p-phosphonated calix[4]arene loaded with paclitaxel (PAC) and carboplatin (CAR) (Fp-PCNPAC+CAR) affects an JMJD3 mediated gene network. (A) RNA-seq analysis of genes upregulated and downregulated in SKOV-3 OC cells treated with different drug formulations. (B) GO analysis illustrating that apoptosis and gene transcriptional signaling pathways were affected more by Fp-PCNPAC+CAR treatment than by PCNPAC+CAR treatment. (C) qRT-PCR analysis of selected genes from different functional categories after Fp-PCNPAC+CAR treatment. (D) ChIP-qPCR analysis of H4K27me3 mark of the HER2, MYCN, and BCL-2 promoters in SKOV-3 cells treated with different drug formulations. (E) mRNA expression of JMJD3, HER2, MYCN, and BCL-2 in JMJD3 shRNA transduced SKOV-3 cells. (F) mRNA expression of HER2, MYCN, and BCL-2 in JMJD3 inhibitor (GSK-J4) treated and untreated SKOV-3 cells. (G) Dose–response curves for two JMJD3 inhibitors (GSK-J4 and GSK-J1) after 96 h incubation. All results are presented as data from three independent experiments. The data in panels are plotted as the mean ± SD with the indicated significance (**P < 0.01, according to a Student's t-test). | ||
The JMJD3 specific shRNAs or inhibitor (GSK-J4) could significantly reduce MYCN and HER2 mRNA expression (Fig. 6E and F). Meanwhile, JMJD3 inhibitor (GSK-J4 or GSK-J1) treatment also led to strong proliferation suppression in SKOV-3 cells (Fig. 6G). These results suggest that JMJD3 directly regulates MYCN and HER2 expressions and related phenotypes in OC cells.
JMJD3-HER2 expression is associated with aggressiveness in OC
Landen et al. reported that combined CAR and PAC treatment of patient-derived xenograft (PDX) tumors enriches the ovarian cancer stem-like cell (CSC) populations and drug resistant cells.17 We analyzed their RNA-seq data and found that HER2 mRNA expression highly increased in PDX tumors after CAR and PAC treatment compared to untreated tumors, suggesting that HER2 may mediate chemoresistance (Fig. 7A). We analyzed the clinical correlation between JMJD3 and HER2 expressions in the human OC TCGA dataset. We found that JMJD3 expression correlated in a positively significant manner with HER2 expression (R = 0.233, P < 0.001; Fig. 7B). Furthermore, Kaplan–Meier analyses of overall survival of patients whose tumors express high or low JMJD3 and HER2 levels revealed that the elevation of both JMJD3 and HER2 expressions correlates with poor outcome in terms of survival of OC patients (P = 0.0145, Fig. 7C). | ||
| Fig. 7 JMJD3 and HER2 are highly expressed in drug resistant OC cells and correlate with the poor outcome of OC patients. (A) mRNA expression heatmap of upregulated genes in PAC and CAR treated and untreated PDX tumors. The red arrow indicates HER2. (B) Pearson correlation analysis of JMJD3 with HER2 in OC tumors. P was calculated using a Student's t-test. (D) Kaplan–Meier analyses of the overall survival of OC patients with different JMJD3 and HER2 expression levels (D) Model of the Fp-PCNPAC+CAR molecular mechanism in OC. | ||
These data suggest that JMJD3-HER2 has a key role in maintaining malignancy in ovarian tumor cells. It has been reported that overexpression of HER2 was associated with stemness and acquired carboplatin resistance in OC.18,19 It will be important to eradicate the HER2-overexpressed subpopulation if aiming at improving the treatment of OC. Several HER2 inhibitors have been used in clinical trials, but drug resistances occur due to HER2 mutation resulting in alteration of drug binding.20,21 Here, we found that JMJD3 epigenetically regulated HER2 transcription. Antitumor effects of a specific JMJD3 inhibitor have been described. Therefore, a JMJD3 inhibitor has great potential to target these key drug-resistant tumor-sustaining cells.
Discussion
Although combination therapy of PTX and CAR has improved the survival and quality of life for OC patients, most patients eventually suffer from attenuated therapeutic outcomes because of drug resistance. Therefore, resistance to PTX and CAR represents a major obstacle to treatment for improving the overall survival rate of OC patients. We recently described the characterization of FA calixarene nanoparticles. The novelty of the present study is the ability of these nanoparticles to co-deliver PTX and CAR and reverse the aberrant epigenetic states to fight against OC tumor cells, especially drug resistant and stem-like tumor cells.Co-administrating PTX and CAR by traditional methods demonstrated limited synergism, due to the distinct pharmacokinetics and biodistributions of PTX and CAR. Moreover, decreased accumulation of both drugs in OC cells will lead to small populations of PTX or CAR-resistant cells flourishing while the others die. Thus, co-delivery of PTX with CAR by single nanoparticles is needed. In our study, we showed that both PTX and CAR achieved good encapsulation efficiency with a fixed molar ratio, which can achieve synergistic cytotoxicity to platinum resistant OC tumor cells. We also checked the physicochemical properties including the shape and size of the nanocarriers, which may affect their behavior in the bloodstream. The SEM and TEM data showed nano-scale size and spherical shape of particles, which can provide potential surface area hyperactivity. Clinicians have administered PTX and CAR directly via the intraperitoneal (IP) route for delivery in a localized confined manner and demonstrated a therapeutic benefit. Our nanoparticle delivery techniques may improve the systemic toxicity profile via the IP route. Importantly, pH controlled release and folate-targeted profile of the nanoparticles were designed to facilitate drug accumulation in the tumor microenvironment. Indeed, we found that nanoparticles preferentially accumulated in SKOV-3 cells and at the tumor site in an in vivo mouse xenograft of the human OC model. Therefore, the intrinsic nature of our nanoparticles to preferentially localize in tumor tissues and cells within the tumor microenvironment may help decrease platinum-partially resistant subpopulations.
Beyond their use as drug carriers, our nanomaterials in OC therapy are also used as an epigenetic “drug” themselves. Some nanomaterials have antitumor effects. Sun et al. have shown that C60(OH)22, which is frequently used as a drug carrier, could itself suppress angiogenesis in human umbilical vein endothelial cell (HUVEC) xenograft mice by inhibiting the enzymatic activities of MMP2 and MMP9, as well as the expression levels of HDAC1, HDAC2, HIF-1α and VEGF expression.22 Recently, nanocrystalline cerium oxide particles were shown to reduce angiogenesis in an OC model. Another study showed that iron oxide nanoparticle effectively reduced tumor size in a murine OC xenograft model. However, in our study, we utilized the epigenetic modulation effects of calixarene derivatives. Aberrant epigenetic states play a crucial role in the development of inherent and acquired resistance in OC. The calixarene-based supramolecular host can associate with methylated lysine in chromatin to selectively disrupt the binding of the PHD finger to H3K9me3. These findings suggest a high potential for these calixarene-based nanoparticles for reversing epigenetic abnormality caused chemotherapy resistance. We found that calixarene-based nanoparticles affect H3K27me3 by decreasing the demethylase JMJD3 expression. JMJD3 appears to have global effects on intracellular epigenetic events, because of its specific inhibitor, GSK-J4, eliciting changes in tumor cell behavior. Several reports have shown that high JMJD3 expression is associated with several poor prognostic parameters, such as advanced OC stage, poor survival or cytotoxic drug resistance. FP-PCNPAC+CAR showed anti-tumor efficacy that may be synergistic with its cargos. Understanding the mechanistic basis of these pharmacological outcomes is critical for maximizing the benefits of JMJD3 inhibitors in the clinic.
The co-delivery system elicits enhanced anticancer effects against OC tumors. We first proved that the nanoparticle encapsulated drugs showed significantly reduced IC50 and increased apoptotic induction, resulting in a stronger anti-tumor effect when compared to free drug combinations. These data also offer hope clinically for reduced negative chemotherapeutic symptoms. And more importantly, Fp-PCNPAC+CAR suppressed OC cell migration and invitation, and the growth of SKOV-3 spheroids in vitro, which meant that Fp-PCNPAC+CAR reduced the metastasis capacity and the stemness of OC cells. The definition of CSC has been a topic of debate. CSC possessed stemness properties that refer to unlimited self-renewal and multi/pluripotency. The stemness of CSCs is maintained by various signaling pathways that are overactivated, including HER2 and JMJD3, depending on the tumor type. Importantly, the CSCs tend to be resistant to chemo- and radiation therapy through their self-renewal ability, capacity for DNA repair, and ABC-transporter expression.11 In this research, we focused on validating whether Fp-PCNPAC+CAR could down regulate HER2 to disrupt stemness and drug resistance of OC cells. Recently, HER2 targeted therapy has been beneficial for ovarian cancer patients in several clinical trials. We first elucidated the dramatic decrease of HER2 gene expression in SKOV-3 cells after they were exposed to Fp-PCNPAC+CAR. It is well known that HER2 crosstalks with a variety of signaling pathways that are essential in the self-renewal maintenance of ESCs. Without HER2 gene expression, tumorigenesis and metastasis of OCs would be reduced. In addition, we found that PTX and CAR treatment enriched HER2+ positive OC cells. The expression of HER2 is correlated with JMJD3 and reversely related with the outcome of OC patients. These findings further supported that Fp-PCNPAC+CAR may have more superiority in suppressing the stemness of OC cells than free drugs.
Conclusion
In this study, for the first time, we described an Fp-PCN nano-carrier that could co-deliver PAC and CAR simultaneously into OC, which greatly improves the therapeutic efficacy. This is also the first study to show PAC and CAR loaded calixarene derivative nanoparticles epigenetically affecting OC cell proliferation, apoptosis, invasive capacity, and stemness via the JMJD3-HER2 axis (Fig. 7D).Conflicts of interest
The authors declare that they have no competing interests.Acknowledgements
This work was supported by the National Key Research and Development Program of China (grant number 2017YFA0103802), National Natural Science Foundation of China (No. 81572766 and 31771630), Guangdong Innovative and Entrepreneurial Research Team Program (2016ZT06S029), Science and Technology Planning Project of Guangdong Province (No. 2016A010103015 and 2016A030313238), SYSU Young Teachers Training Program (No. 16YKZD14), Science Foundation of Guangxi (No. 2014GXNSFAA118267), and University Scientific Research Projects of Guangxi (No. YB2014279), Guangdong Innovative and Entrepreneurial Research Team Program (No. 2013S086), Guangdong Natural Science Foundation (No. 2016A030313215 and 2014A030312018), Science and Technology Program of Guangzhou (No. 201707010094) and National Health and Medical Research Council of Australia (APP1028339, GNT1028339).References
- N. Katsumata, M. Yasuda, F. Takahashi, S. Isonishi, T. Jobo, D. Aoki, H. Tsuda, T. Sugiyama, S. Kodama, E. Kimura, K. Ochiai, K. Noda and G. Japanese Gynecologic Oncology, Lancet, 2009, 374, 1331–1338 CrossRef CAS.
- A. Rodzinski, R. Guduru, P. Liang, A. Hadjikhani, T. Stewart, E. Stimphil, C. Runowicz, R. Cote, N. Altman, R. Datar and S. Khizroev, Sci. Rep., 2016, 6, 20867 CrossRef CAS PubMed.
- M. A. Miller, Y. R. Zheng, S. Gadde, C. Pfirschke, H. Zope, C. Engblom, R. H. Kohler, Y. Iwamoto, K. S. Yang, B. Askevold, N. Kolishetti, M. Pittet, S. J. Lippard, O. C. Farokhzad and R. Weissleder, Nat. Commun., 2015, 6, 8692 CrossRef CAS PubMed.
- S. Dhar, N. Kolishetti, S. J. Lippard and O. C. Farokhzad, Proc. Natl. Acad. Sci. U. S. A., 2011, 108, 1850–1855 CrossRef CAS PubMed.
- X. You, Y. Kang, G. Hollett, X. Chen, W. Zhao, Z. Gu and J. Wu, J. Mater. Chem. B, 2016, 4, 7779–7792 RSC.
- J. Mo, P. K. Eggers, X. Chen, M. R. Ahamed, T. Becker, L. Yong Lim and C. L. Raston, Sci. Rep., 2015, 5, 10414 CrossRef PubMed.
- J. Mo, P. K. Eggers, Z. X. Yuan, C. L. Raston and L. Y. Lim, Sci. Rep., 2016, 6, 23489 CrossRef CAS PubMed.
- J. X. Mo, P. K. Eggers, C. L. Raston and L. Y. Lim, Anal. Bioanal. Chem., 2014, 406, 2659–2667 CrossRef CAS PubMed.
- S. Shi, L. Han, T. Gong, Z. Zhang and X. Sun, Angew. Chem., 2013, 52, 3901–3905 CrossRef CAS PubMed.
- S. Seton-Rogers, Nat. Rev. Cancer, 2011, 11, 538–539 CrossRef CAS PubMed.
- T. Reya, S. J. Morrison, M. F. Clarke and I. L. Weissman, Nature, 2001, 414, 105–111 CrossRef CAS PubMed.
- Q. Li, J. Zou, M. Wang, X. Ding, I. Chepelev, X. Zhou, W. Zhao, G. Wei, J. Cui, K. Zhao, H. Y. Wang and R. F. Wang, Nat. Commun., 2014, 5, 5780 CrossRef CAS PubMed.
- L. Castagnoli, G. C. Ghedini, A. Koschorke, T. Triulzi, M. Dugo, P. Gasparini, P. Casalini, A. Palladini, M. Iezzi, A. Lamolinara, P. L. Lollini, P. Nanni, C. Chiodoni, E. Tagliabue and S. M. Pupa, Oncogene, 2017, 36, 1721–1732 CrossRef CAS PubMed.
- S. Carreira, J. Goodall, I. Aksan, S. A. La Rocca, M. D. Galibert, L. Denat, L. Larue and C. R. Goding, Nature, 2005, 433, 764–769 CrossRef CAS PubMed.
- L. Ma, J. Young, H. Prabhala, E. Pan, P. Mestdagh, D. Muth, J. Teruya-Feldstein, F. Reinhardt, T. T. Onder, S. Valastyan, F. Westermann, F. Speleman, J. Vandesompele and R. A. Weinberg, Nat. Cell Biol., 2010, 12, 247–256 CAS.
- V. Santini, A. Melnick, J. P. Maciejewski, E. Duprez, C. Nervi, L. Cocco, K. G. Ford and G. Mufti, Crit. Rev. Oncol. Hematol., 2013, 88, 231–245 CrossRef PubMed.
- Z. C. Dobbin, A. A. Katre, A. D. Steg, B. K. Erickson, M. M. Shah, R. D. Alvarez, M. G. Conner, D. Schneider, D. Q. Chen and C. N. Landen, Oncotarget, 2014, 5, 8750–8764 Search PubMed.
- A. Arkhipov, Y. B. Shan, E. T. Kim, R. O. Dror and D. E. Shaw, eLife, 2013, 2 DOI:10.7554/eLife.00708.
- A. Goltsov, Y. Deeni, H. S. Khalil, T. Soininen, S. Kyriakidis, H. Hu, S. P. Langdon, D. J. Harrison and J. Bown, Cells, 2014, 3, 563–591 CrossRef PubMed.
- A. Chakrabarty, V. Sanchez, M. G. Kuba, C. Rinehart and C. L. Arteaga, Proc. Natl. Acad. Sci. U. S. A., 2012, 109, 2718–2723 CrossRef CAS PubMed.
- M. J. Ellis and C. M. Perou, Cancer Discovery, 2013, 3, 27–34 CrossRef CAS PubMed.
- C. Sun, L. Wang, D. Gao, Y. Pan, Y. Zhao, C. Chen and M. Guo, Nanoscale, 2016, 8, 16332–16339 RSC.
Footnote |
| † These authors contributed equally to this work. |
| This journal is © The Royal Society of Chemistry 2017 |