 Open Access Article
Creative Commons Attribution 3.0 Unported Licence
Lifetime nanomanometry – high-pressure luminescence of up-converting lanthanide nanocrystals – SrF2:Yb3+,Er3+†
Marcin
Runowski
 a,
Jędrzej
Marciniak
a,
Tomasz
Grzyb
a,
Jędrzej
Marciniak
a,
Tomasz
Grzyb
 a,
Dominika
Przybylska
a,
Andrii
Shyichuk
a,
Dominika
Przybylska
a,
Andrii
Shyichuk
 b,
Bolesław
Barszcz
 c,
Andrzej
Katrusiak
 *a and
Stefan
Lis
 *a
*a
aAdam Mickiewicz University, Faculty of Chemistry, Umultowska 89b, 61-614 Poznań, Poland. E-mail: katran@amu.edu.pl; blis@amu.edu.pl; Tel: +48618291590 Tel: +48618291679
bFaculty of Chemistry, University of Wrocław, F. Joliot-Curie 14, 50-383 Wrocław, Poland
cInstitute of Molecular Physics, Polish Academy of Sciences, Mariana Smoluchowskiego 17, 60-179 Poznań, Poland
First published on 21st September 2017
Abstract
Anti-Stokes luminescence of up-converting nanocrystals SrF2:Yb3+,Er3+ can be used as a high pressure optical sensor alternative to the ruby fluorescence-scale. In nanocrystalline SrF2:Yb3+,Er3+, high pressure reversibly shortens the emission lifetimes nearly linearly up to 5.29 GPa at least. Its advantage is the use of NIR (≈980 nm) radiation, highly penetrable for many materials. The shortening of up-conversion lifetimes has been attributed mainly to the changes in energy transfer rates, caused by decreased interatomic distances and increased overlap integrals between 4f electrons and the valence shells of ligand ions. The origin of high-pressure effects on the luminescence intensity, band ratio and their spectral position has been explained by the increased interactions and distortions of the crystal-field symmetry around the emitting ions in the compressed structure.
Introduction
Functional nanomaterials are currently extensively studied due to their unique optoelectronic, magnetic and structural properties, in comparison with their bulk analogues.1–6 This phenomenon is usually related to the large surface-to-volume ratio of the nanoparticles (NPs) and to the quantum confinement of electrons.7–10 Luminescent NPs based on lanthanide ions (Ln3+) exhibit multicolor emission under UV or IR (up-conversion) excitation, long radiative lifetimes and narrow emission bands, resulting from the 4f–4f transitions within the Ln3+ ions (forbidden by the Laporte selection rules).11–16 Ln3+-Doped NPs are resistant to high temperature and photodegradation. Moreover, small NPs can form luminescent colloidal solutions which are useful for various applications.4,11 Inorganic fluorides are good hosts for Ln3+ ions, as their quantum efficiency of luminescence is usually high, due to the low phonon energy of their crystal lattice.17 Moreover, their synthesis is easy, reproducible and cheap.6,18,19 For these reasons, fluoride NPs are applied for bioimaging (luminescent labels, contrast agents), drug delivery techniques, forensics, photovoltaics or as components of functional materials.13,18,20,21 Owing to the high sensitivity of the emitting ions to alterations of the local coordination environment, the Ln3+-doped NPs can be used as nanothermometry sensors.22,23 Presently, we show that the luminescence of Ln3+-doped NPs can be used in nanomanometry as optical pressure sensors, capable of measuring pressure in nano-sized regions. Such up-converting nanomanometry is a promising alternative method for measuring pressure, particularly suitable for small chambers, including the commonly used diamond anvil cell (DAC). It has some advantages over other spectroscopic pressure determination techniques, such as the ruby fluorescence-scale. In the case of high-pressure studies of luminescent compounds, their excitation/emission spectra can overlap with that of ruby, obscuring its spectrum and hampering the pressure determination. Moreover, dielectrics, semiconductors and some metals are more transparent to near infrared (NIR) light than to visible light used for the ruby excitation.Here we report the high-pressure luminescence studies of cubic up-converting SrF2:Yb3+,Er3+ nanocrystals (space group Fm3m). We have investigated the SrF2:Yb3+,Er3+ NPs in the monotonic range of compression up to 5.29 GPa, about 1.3 GPa below the phase transition reported for SrF2.24 We have observed a shortening of the up-conversion emission lifetimes in the compressed SrF2:Yb3+,Er3+ NPs. The strong relationship between the pressure and emission lifetimes is reversible and nearly linear. Therefore, this relationship for the SrF2:Yb3+,Er3+ NPs is ideally suited for pressure-sensing purposes.
Results and discussion
The experimental setup for the measurements of high-pressure up-conversion luminescence and a fragment of crystal lattice of the SrF2:Yb3+,Er3+ NPs are schematically presented in Fig. 1.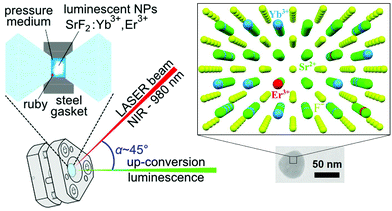 | ||
| Fig. 1 Schematic configuration of the setup for high-pressure luminescence measurements and the TEM image with a fragment of the SrF2:20% Yb3+,1% Er3+ NP structure. | ||
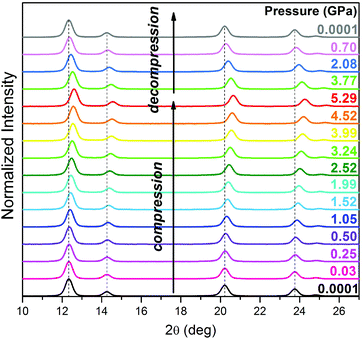
The powder X-ray diffraction patterns of the compressed SrF2:20% Yb3+,1% Er3+ nanomaterial (Fig. 2) conform to the cubic SrF2 structure.24 The compression of interplanar spacing results in a shift of diffraction maxima towards higher 2Θ angle values.
The SrF2:20% Yb3+,1% Er3+ NPs are nearly linearly compressed in the investigated pressure range (Fig. 3). We have fitted the third-order Birch–Murnaghan isothermal equation of state (EOS) to the SrF2:Yb3+,Er3+ unit-cell volume data measured under ambient and high-pressure.25,26 Under 0.1 MPa the bulk modulus Bo is 67.9(8) GPa and B′ (the pressure derivative of the isothermal bulk modulus) is 6.5(4).
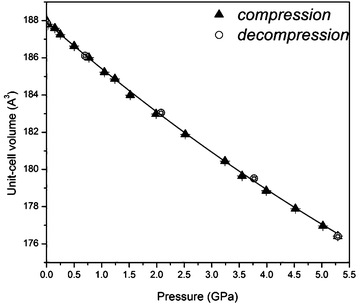 | ||
| Fig. 3 Unit-cell volume compression of SrF2:Yb3+,Er3+ nanocrystals. The line shows the third-order Birch–Murnaghan isothermal equation of state fitted to the unit-cell volume data. | ||
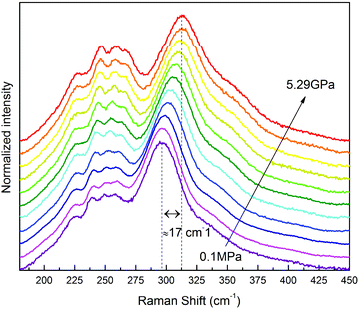
The Raman spectra of the compressed SrF2:Yb3+,Er3+ nanomaterial reveal a characteristic phonon band located at 296 cm−1, which gradually shifts to 313 cm−1 under 5.29 GPa (Fig. 4). This phonon band shift is related to shorter interionic distances in the structure, i.e. the average distances between the F− anions and Sr2+, Yb3+, Er3+ cations and increased energy of the lattice-mode phonons. The observed increase of the phonon mode energy agrees well with the literature data reported for the bulk SrF2.27 The determined pressure dependence of the phonon energy values (peak centroids) in a compression–decompression cycle is presented in Fig. S1 in the ESI.†
The TEM images recorded before and after the compression–decompression cycles show that the oval SrF2:Yb3+,Er3+ NPs have not changed in shape nor in the size range 50–100 nm (Fig. 5). Moreover, the cubic structure of the material was not permanently affected by high pressure, as evidenced by the unchanged diffraction pattern (Fig. 2), crystal volume (Fig. 3) and FFT insets of the corresponding HR-TEM images (Fig. 5e and f).
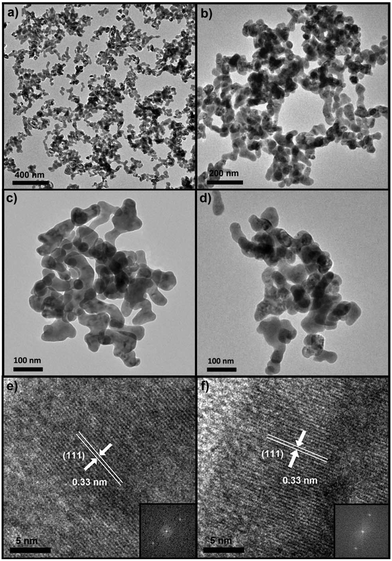 | ||
| Fig. 5 TEM images of the SrF2:20% Yb3+,1% Er3+ sample before (a, c, e) and after the compression–decompression cycle to 5.29 GPa (b, d, f); HR-TEM with the corresponding FFT insets (e, f). | ||
The synthesized fluoride NPs display the phenomenon of up-conversion luminescence, due to the doping with Yb3+ and Er3+ ions. The dopants and their concentration have been optimized for intense emission by NIR excitation (980 nm), crucial for the conducted experiment. The Yb3+ ions can be effectively excited with NIR radiation and transfer the energy to other co-dopants, such as Er3+, Tm3+ or Ho3+ ions.28 The luminescence in Yb3+/Er3+-doped materials is usually based on the energy transfer up-conversion (ETU) mechanism, where Yb3+ ions transfer the absorbed energy (NIR light) to the neighboring Er3+ ions, pumping their excited states.29 In the studied system, the Er3+ ions were used as a luminescent probe for the pressure changes. The emission of Er3+ ions depends on the local coordination environment and the phonon energy of the matrix. These factors can influence energy transfer (ET) rates between Yb3+ and Er3+ ions, the color of luminescence and the emission lifetimes.30–32
Under high pressure the SrF2:Yb3+,Er3+ NP emission bands retain their shape (Fig. 6); the intensity of the hypersensitive 2H11/2 → 4I15/2 transition gradually decreases with pressure, as illustrated in Fig. S5.† It is plausible that this decrease in the intensity of the 2H11/2 → 4I15/2 band is caused by structural shifts in the local coordination environment of Er3+ ions during compression.33 All of the emission bands of SrF2:Yb3+,Er3+ are red-shifted under high pressure (Fig. 7). Shorter distances and stronger interactions between the ions result in a smaller energy gap between the ground and excited states of Er3+ ions.34 All up-conversion excitation spectra of the nanoluminophore recorded under high pressure (Fig. S3†) show a broad absorption peak centered at 976 nm, corresponding to the 2F7/2 → 2F5/2 transition. The shape and position of this band hardly changes with pressure.
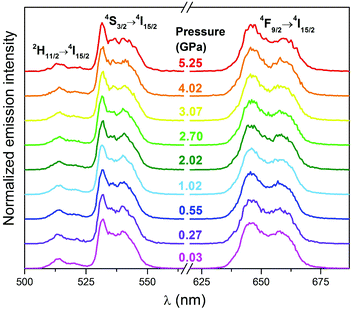 | ||
| Fig. 6 Emission spectra of the SrF2:Yb3+,Er3+ sample under high pressure; λex = 980 nm, normalized to the 4S3/2 → 4I15/2 band. | ||
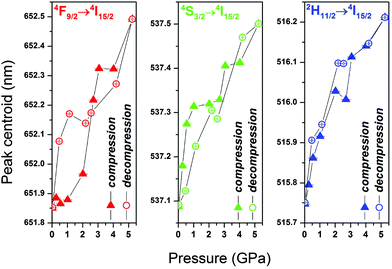 | ||
| Fig. 7 Comparison of the spectral position of the emission bands for SrF2:Yb3+,Er3+ NPs under high pressure. | ||
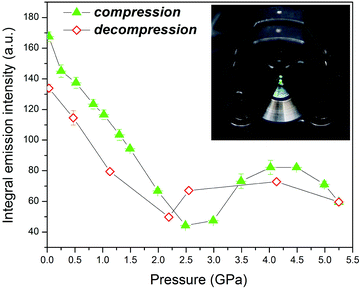
The integrated up-conversion luminescence intensity of the nanomaterial in the pressure range from 0.03 to 2.5 GPa continuously decreases (Fig. 8), which can be due to increased phonon-assisted non-radiative relaxation caused by the higher energy of lattice-mode phonons in the compressed crystal (shorter Ln–F bonds),34,35 as well as the increased Er–Er cross-relaxation. In contrast to the fully reversible lifetimes of SrF2:Yb3+,Er3+, the luminescence intensity displays a hysteresis in the compression and decompression runs. This hysteresis can be caused by the formation of pressure-induced crystal defects, which affect the luminescence intensity.35 In the pressure range from 2.5 to 4.0 GPa the luminescence intensity increases. A similar effect was observed by Wisser et al.35 for the cubic α-NaYF4:Yb3+,Er3+ NPs and was attributed to pressure-induced distortions in the centrosymmetric environment of Ln3+ ions. The Laporte selection rules forbid the electric dipole transitions between the states of the same parity, and if such transitions occur their intensity is relatively low. In a perfect crystal, the hydrostatic pressure shortens the bonds only, without altering the coordination-environment symmetry. However, in doped crystals the local geometry around Ln3+ ions is inhomogeneous. This distortion of symmetry around Ln3+ can be even stronger in nanocrystals due to the abundance of surface defects. These structural distortions can be amplified under high pressure, which leads to an increased luminescence intensity.35 The hysteresis of the luminescence intensity indicates that the reversion to a more centrosymmetric environment around Ln3+ ions requires the pressure magnitude lower by about 0.5 GPa during decompression. A bright green-yellow up-conversion luminescence of the NPs compressed to 2 GPa in DAC is shown in the inset in Fig. 8 and in the recorded movie in the ESI.†
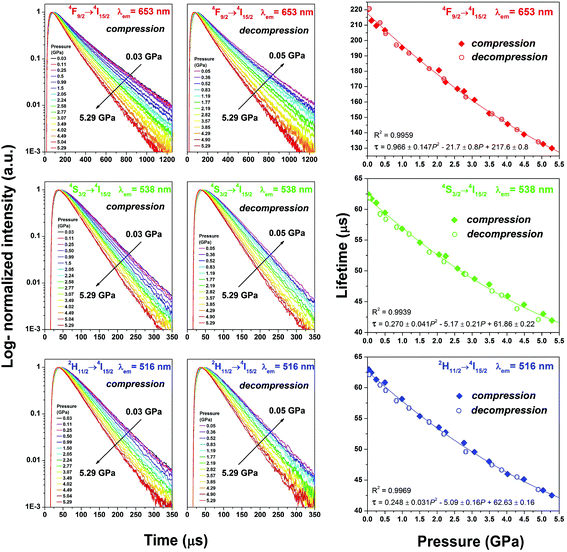
The luminescence intensity is also affected by the shortening of interionic distances in Yb3+–Er3+ which enhances the energy-transfer rates, whereas the shorter distances in Er3+–Er3+ can enhance the interionic cross-relaxation.6,15,16,36–38 Also, other effects, such as backward energy transfer from Er3+ to Yb3+ ions, can be more efficient in the compressed structure.39 The enhancement and deterioration of the energy transfer rates compete in the SrF2:Yb3+,Er3+ NPs, affecting the luminescence rise and decay curves presented in Fig. 9. The magnified luminescence rise curves are shown in Fig. S6.†
In order to calculate the luminescence lifetimes (τ) of the material under high pressure, the recorded decay profiles were fitted to the exponential function I = A·exp(−t/τ), with R2 > 0.999 (I – luminescence intensity at time t; A – amplitude; t – time; τ – emission lifetime; R2 – correlation coefficient). The pressure increase from 0.03 to 5.29 GPa induces a nearly linear and reversible shortening of the emission lifetimes (Fig. 9), i.e. from 220 to 130 μs for the 4F9/2 → 4I15/2 transition (λem = 653 nm); from 62.5 to 41.5 μs for the 4S3/2 → 4I15/2 transition (λem = 538); from 63.0 to 42.5 μs for the 2H11/2 → 4I15/2 transition (λem = 516). The τ values were correlated with pressure according to the 2nd order polynomial: τ = aP2 + bP + c, with R2 > 0.99 (P – pressure; a, b, c – coefficients depending on the given transition, as shown in Fig. 9). An irreversible decrease of the luminescence intensity after the compression–decompression cycle is caused by the formation of crystal defects which permanently quenched some of the emitting centers. The changes in measured lifetimes do not depend on inelastic deformations or generated defects and are reversible.
Influence of pressure on phonon quenching
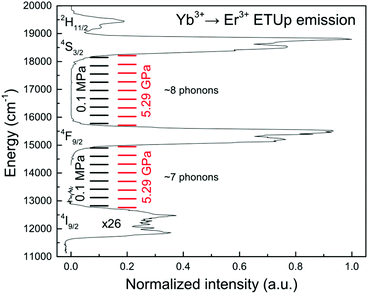
The compressed interionic distances result in the increased phonon energy from 296 under 0.1 MPa to 313 cm−1 under 5.29 GPa (Fig. 4 and S1†). The gaps between the energy levels 2H11/2, 4S3/2, 4F9/2 and 4I9/2 decrease by about 15 cm−1. Compared to the FWHM of the emission peaks (∼700 cm−1) the measured increase of the phonon energy and the decrease in the energy gaps are small. Consequently, the number of phonons participating in quenching is unlikely to change up to 5.29 GPa, at least. Thus, it is plausible that the pressure-induced changes in up-conversion emission lifetimes and the number of phonons in the elementary quenching acts are not related; this conclusion is illustrated in Fig. 10.In order to clarify the increase of the phonon energy on the spectroscopic properties of SrF2:Yb3+,Er3+ we performed a theoretical analysis and calculated the multi-phonon relaxation rates under ambient and high pressure. Detailed information on the calculations can be found in the ESI.†
Kinetics of ETU excitation
Our calculations suggest that the multi-phonon relaxation rates in SrF2:Yb3+,Er3+ are much less affected by pressure than the ET rates. The experimental trends of photoemission lifetimes as a function of hydrostatic pressure can be simulated using structural data on Ln–Ln and Ln–F distances in SrF2:Yb3+,Er3+ according to the equations discussed by Malta.40 During compression the reduced Ln–Ln distance enhances the ET rates.40 On the other hand, compressed Ln–F distance increases the overlap of Er3+ 4f electrons with valence shells of anions and the ET rates are reduced.41 The effective (total) rate of energy transfers including the energy transfer sensitization (ETU) and quenching (through cross-relaxation) increases with pressure. The theoretical estimation of ET dependence on pressure is shown in Fig. S10–S12.† The balance of ETU excitation is given by competition of three kinds of processes: direct transfer (Yb3+ to Er3+), back-transfer (Er3+ to Yb3+) and cross-relaxation. The sum of these processes is defined as the effective energy transfer from Yb3+ to Er3+. Pressure amplifies all these elementary transitions and increases their sum. The observed kinetics is caused by the competition between the populating and depopulating processes. Under direct excitation the lifetimes of transitions 2H11/2 → 4I15/2 (λex/λem = 512/522 nm) and 4S3/2 → 4I15/2 (λex/λem = 534/545 nm) are equal to 24 μs and 26 μs, respectively. In the up-conversion process, under 980 nm excitation, the lifetimes of these transitions are longer and equal to 62.5 μs for 2H11/2 → 4I15/2 and 63 μs for 4S3/2 → 4I15/2. We assume that these longer lifetimes of levels 2H11/2 and 4S3/2 depend on the rate of effective Yb-to-Er ET that populates the 4F7/2 level of Er3+. After excitation, the up-converted energy is channeled via a chain of transitions: Yb3+ 2F5/2 → Er3+ 4F7/2 → 2H11/2 → 4S3/2 → 4F9/2; the transitions 4F7/2 → 2H11/2 and 2H11/2 → 4S3/2 in Er3+ occur as fast multi-phonon decays.The similar values of lifetimes under direct excitation indicate a strong cross-relaxation coupling of the 2H11/2 and 4S3/2 levels. The measured lifetimes of the 2H11/2 and 4S3/2 levels depend on the effective ETU rate (under up-conversion excitation) or cross-relaxation (under direct excitation). The energy gap between the 2H11/2 and 4S3/2 levels is close to the energy of 2 phonons, while the gap between 4S3/2 → 4F9/2 is close to 8 phonons. If the 2H11/2 → 4S3/2 and 4S3/2 → 4F9/2 lifetimes were determined by multi-phonon relaxation, their duration would be different by several orders of magnitude. Considering the low rates of radiative relaxation of Er3+ in SrF2,42 it is reasonable to neglect the radiative part. The up-conversion emission lifetime of the 4F9/2 level under ambient pressure (220 μs) is also larger than the lifetime after direct excitation (200 μs, λex/λem = 640/660 nm). Under 5.29 GPa, the up-conversion emission lifetime is reduced by 41% and equals 130 μs. Our calculations suggest that if the multi-phonon processes were dominating in the observed kinetics, the lifetimes of the 4F9/2, 4S3/2 and 2H11/2 levels would have decreased under 5.29 GPa by about 8%, 8% and 23%, respectively. It is worth noting that the calculated multi-phonon decay lifetimes of the 2H11/2 → 4S3/2 transition are about 10 and 220 ns for 1- and 2-phonon processes, compared to the measured 62.5 μs. The experiment lifetimes of the 4F9/2, 4S3/2 and 2H11/2 levels decrease with pressure in a nearly linear manner, and under 5.29 GPa are shorter by 41%, 34% and 37% respectively. The difference between the measured and simulated values of lifetimes suggests that the decays of the 2H11/2, 4S3/2 and 4F9/2 levels are governed by ET (either cross-relaxation or ETU) and are affected by pressure in a similar fashion.
Luminescence decays of Yb3+
The potential contribution of the energy back-transfer to the pressure-induced shortening of Er3+ lifetimes can be assessed by measuring the luminescence decays of Yb3+ ion emission bands (λex/λem = 980/1020 nm). Yb3+ emission is insensitive to cross-relaxation and multi-phonon quenching due to the presence of only one ground (2F7/2) and one excited (2F5/2) states separated by an energy gap of about 10![[thin space (1/6-em)]](https://www.rsc.org/images/entities/char_2009.gif) 000 cm−1.43,44 We have measured the decay curves of these levels (Fig. S7 and S8†) and determined the τ values (Fig. S9†), which reversibly shorten from 59.0 to 49.5 μs between 0.03 and 5.29 GPa. Our results indicate that there is no significant energy back-transfer from Er3+ to Yb3+. According to Ramirez et al.,43 the Yb3+ radiative lifetime shortening can be caused by the interconfigurational mixing of the 5d and 4f orbitals (4f13 and 4f125d1 configurations), resulting in a relaxation of selection rules due to the pressure-induced increase of the odd-parity crystal-field distortions (the configurations have opposite parity). The coupling between these configurations is more efficient, as the energy of the 4f125d1 level decreases with the increasing pressure.43,45
000 cm−1.43,44 We have measured the decay curves of these levels (Fig. S7 and S8†) and determined the τ values (Fig. S9†), which reversibly shorten from 59.0 to 49.5 μs between 0.03 and 5.29 GPa. Our results indicate that there is no significant energy back-transfer from Er3+ to Yb3+. According to Ramirez et al.,43 the Yb3+ radiative lifetime shortening can be caused by the interconfigurational mixing of the 5d and 4f orbitals (4f13 and 4f125d1 configurations), resulting in a relaxation of selection rules due to the pressure-induced increase of the odd-parity crystal-field distortions (the configurations have opposite parity). The coupling between these configurations is more efficient, as the energy of the 4f125d1 level decreases with the increasing pressure.43,45
Pressure calibration via lifetime nanomanometry
Reversible changes in the duration of emission lifetimes after the compression–decompression cycles of SrF2:Yb3+,Er3+ NPs are particularly important for the sensor applications. The values of the isothermally measured lifetimes of the Ln3+ ions embedded in crystalline NPs can be used for pressure calibration. We have tested this method by measuring the critical pressure of transition between phases I and III in urea under 0.48 GPa, clearly visible due to the strong strain in these crystals.46 Apart from the known critical pressure, we compared the ruby fluorescence and SrF2:Yb3+,Er3+ NP lifetime methods for the pressure calibration. The pressure value during the phase transition in urea was 0.49 ± 0.03 GPa according to the ruby fluorescence shift, and 0.50 ± 0.1 GPa according to the curves of Er3+ lifetime shortening in SrF2:Yb3+,Er3+ NPs (Fig. S10–S12). The accuracy of our method, of 0.1 GPa, is similar to that of most of the commercial pressure-sensing photoluminescence systems based on the ruby spectral shift measurement. The advantages of the lifetime nanomanometry are the use of a NIR excitation source and the small size of the NP-based pressure sensors. The NPs can be used in a convenient way as a luminescent colloid uniformly distributed in the DAC chamber, in contrast to the ruby crystals mounted in its specific places. We were able to probe the pressure by using a diluted colloidal NP solution, at a concentration down to 0.1% (1 mg mL−1).Conclusions
These first high-pressure measurements of SrF2:Yb3+,Er3+ NP luminescence and its lifetime have revealed their strong pressure dependence that can be applied for pressure calibration. We developed a new spectroscopic method for the experimental determination of pressure based on the luminescence lifetime measurements of lanthanide ions. This method has been successfully applied for determining the critical pressure of the phase transition of urea crystals. This kind of measurement can be an alternative to the commonly used ruby-based optical sensing of high-pressure or IR spectroscopic methods.47 Up-converting SrF2:Yb3+,Er3+ nanocrystals were used as an exemplary material exhibiting anti-Stokes emission under NIR (≈980 nm) irradiation, for optical sensing of pressure, in a diamond anvil cell (DAC). The recorded luminescence decay curves show that the emission lifetimes are shortened under high pressure, and that the relationship between the lifetime shortening and pressure up to 5.29 GPa is almost linear. The decrease of lifetime values is related to the compressed interionic distances, which enhance the energy transfer and cross-relaxation processes. This shortening of lifetimes is reversible and was confirmed by emission measurements during decompression. High-pressure powder XRD data and Raman spectra reveal that SrF2:Yb3+,Er3+ undergoes nearly linear compression without phase transitions up to 5.29 GPa at least. The TEM analysis of the sample performed after the high-pressure experiments shows that the morphology and structure of the SrF2:Yb3+,Er3+ nanocrystals do not change during the compression–decompression cycle. However, the compression of the material alters the luminescence intensity and red-shift of the emission bands. Finally, up-conversion in SrF2:Yb3+,Er3+ allows its excitation with NIR light, which may be beneficial for high-pressure studies of non-transparent systems.Conflicts of interest
The authors declare no competing financial interest.Acknowledgements
This work was supported by the Polish National Science Centre (grant numbers 2016/23/D/ST4/00296 and 2013/11/N/ST3/03793) and the Polish Ministry of Science and Higher Education: Iuventus Plus Programme, grant No. IP2014 014573. M. R. is a recipient of a scholarship supported by the Foundation for Polish Science (FNP). J. M. is a recipient of a scholarship supported by the Adam Mickiewicz University Foundation.References
- K. Ostrikov, E. C. Neyts and M. Meyyappan, Adv. Phys., 2013, 62, 113–224 CrossRef CAS.
- X. Batlle and A. Labarta, J. Phys. D: Appl. Phys., 2002, 3, R15–R42 CrossRef.
- K. Bharathi, N. R. Kalidindi and C. V. Ramana, J. Appl. Phys., 2010, 108, 083529–083533 CrossRef.
- M. Runowski, S. Goderski, J. Paczesny, M. Księżopolska-Gocalska, A. Ekner-Grzyb, T. Grzyb, J. D. Rybka, M. Giersig and S. Lis, J. Phys. Chem. C, 2016, 120, 23788–23798 CAS.
- H. Lv, M. Yao, Q. Li, Z. Li, B. Liu, R. Liu, S. Lu, D. Li, J. Mao, X. Ji, J. Liu, Z. Chen, B. Zou, T. Cui and B. Liu, J. Phys. Chem. C, 2012, 116, 2165–2171 CAS.
- M. Runowski and S. Lis, J. Alloys Compd., 2016, 661, 182–189 CrossRef CAS.
- V. Skumryev, S. Stoyanov, Y. Zhang, G. Hadjipanayis, D. Givord and J. Nogués, Nature, 2003, 423, 850–853 CrossRef CAS PubMed.
- M. Runowski, K. Dąbrowska, T. Grzyb, P. Miernikiewicz and S. Lis, J. Nanopart. Res., 2013, 15, 2068–2083 CrossRef PubMed.
- Z. Tang, N. Kotov and M. Giersig, Science, 2002, 297, 237–240 CrossRef CAS PubMed.
- H. Yu, J. Li, R. A. Loomis, L.-W. Wang and W. E. Buhro, Nat. Mater., 2003, 2, 517–520 CrossRef CAS PubMed.
- W. Zheng, P. Huang, D. Tu, E. Ma, H. Zhu and X. Chen, Chem. Soc. Rev., 2014, 44, 1379–1415 RSC.
- A. Nadort, J. Zhao and E. M. Goldys, Nanoscale, 2016, 8, 13099–13130 RSC.
- K. Binnemans, Chem. Rev., 2009, 109, 4283–4374 CrossRef CAS PubMed.
- P. Tanner, Chem. Soc. Rev., 2013, 42, 5090–5101 RSC.
- T. Grzyb, M. Runowski, A. Szczeszak and S. Lis, J. Phys. Chem. C, 2012, 116, 17188–17196 CAS.
- B. G. Wybourne and L. Smentek, Optical spectroscopy of lanthanides, CRC Press, New York, 2007 Search PubMed.
- M. J. Weber, Phys. Rev., 1967, 157, 262–272 CrossRef CAS.
- S. Wang, J. Feng, S. Song and H. Zhang, CrystEngComm, 2013, 15, 7142–7151 RSC.
- T. Grzyb, M. Runowski and S. Lis, J. Lumin., 2014, 154, 479–486 CrossRef CAS.
- M. Runowski, A. Ekner-Grzyb, L. Mrówczyńska, S. Balabhadra, T. Grzyb, J. Paczesny, A. Zep and S. Lis, Langmuir, 2014, 30, 9533–9543 CrossRef CAS PubMed.
- G. Lakshminarayana, J. Alloys Compd., 2009, 481, 582–589 CrossRef CAS.
- S. Balabhadra, M. L. Debasu, C. D. S. Brites, L. A. O. Nunes, O. L. Malta, J. Rocha, M. Bettinelli and L. D. Carlos, Nanoscale, 2015, 7, 17261–17267 RSC.
- A. S. Souza, L. A. O. Nunes, I. G. N. Silva, F. A. M. Oliveira, L. L. da Luz, H. F. Brito, M. C. F. C. Felinto, R. A. S. Ferreira, S. A. Júnior, L. D. Carlos and O. L. Malta, Nanoscale, 2016, 8, 5327–5333 RSC.
- J. Wang, H. Zhu, C. Ma, X. Wu, J. Zhang, D. Li, R. Cong, J. Liu and Q. Cui, J. Phys. Chem. C, 2013, 117, 615–619 CAS.
- F. Birch, Phys. Rev., 1947, 71, 809–824 CrossRef CAS.
- R. J. Angel, J. Gonzalez-Platas and M. Alvaro, Z. Kristallogr., 2014, 229, 405–419 CAS.
- G. A. Kourouklis and E. Anastassakis, Phys. Rev. B: Condens. Matter, 1986, 34, 1233–1237 CrossRef CAS.
- D. C. Rodriguez Burbano, R. Naccache and J. A. Capobianco, Near-IR Triggered Photon Upconversion, 1st edn, Elsevier B.V., 2015, vol. 47 Search PubMed.
- F. Auzel, Chem. Rev., 2004, 104, 139–173 CrossRef CAS PubMed.
- A. Li, T. Guan and Z. Sun, Europhys. Lett., 2014, 106, 48001–48006 CrossRef.
- Y. Tian, B. Tian, C. Cui, P. Huang, L. Wang and B. Chen, RSC Adv., 2015, 5, 14123–14128 RSC.
- J. Zhao, Z. Lu, Y. Yin, C. McRae, J. A. Piper, J. M. Dawes, D. Jin and E. M. Goldys, Nanoscale, 2013, 5, 944–952 RSC.
- M. Hatanaka and S. Yabushita, Theor. Chem. Acc., 2014, 133, 1517–1531 CrossRef.
- Transition Metal and Rare Earth Compounds Excited States, Transitions, Interactions I, ed. K. L. Bray, M. Glasbeek, H. Kunkely, A. Vogler and H. Yersin, Springer, New York, 2001 Search PubMed.
- M. D. Wisser, M. Chea, Y. Lin, D. M. Wu, W. L. Mao, A. Salleo and J. A. Dionne, Nano Lett., 2015, 15, 1891–1897 CrossRef CAS PubMed.
- M. Weber, Phys. Rev., 1968, 171, 283–291 CrossRef CAS.
- H. Moos, J. Lumin., 1970, 1–2, 106–121 CrossRef.
- X. Liu, X. Kong, Y. Zhang, L. Tu, Y. Wang, Q. Zeng, C. Li, Z. Shi and H. Zhang, Chem. Commun., 2011, 47, 11957–11959 RSC.
- D. Solis, E. De La Rosa, O. Meza, L. A. Diaz-Torres, P. Salas and C. Angeles-Chavez, J. Appl. Phys., 2010, 108, 023103–023111 CrossRef.
- O. L. Malta, J. Non-Cryst. Solids, 2008, 354, 4770–4776 CrossRef CAS.
- A. Shyichuk, S. S. Câmara, I. T. Weber, A. N. Carneiro Neto, L. A. O. Nunes, S. Lis, R. L. Longo and O. L. Malta, J. Lumin., 2016, 170, 560–570 CrossRef CAS.
- X. Qiao, X. Fan and J. Wang, J. Appl. Phys., 2006, 99, 074302–074309 CrossRef.
- M. Ramirez, L. Bausa, S. W. Biernacki, A. Kaminska, A. Suchocki and M. Grinberg, Phys. Rev. B: Condens. Matter, 2005, 72, 224104–224108 CrossRef.
- M. Ito, G. Boulon, A. Bensalah, Y. Guyot, C. Goutaudier and H. Sato, J. Opt. Soc. Am. B, 2007, 24, 3023–3033 CrossRef CAS.
- G. Boulon, J. Alloys Compd., 2008, 451, 1–11 CrossRef CAS.
- A. Olejniczak, K. Ostrowska and A. Katrusiak, J. Phys. Chem. C, 2009, 113, 15761–15767 CAS.
- T. P. Shakhtshneider, E. V. Boldyreva and H. Ahsbahs, Zh. Fiz. Khim., 2000, 74, 851–854 Search PubMed.
Footnote |
| † Electronic supplementary information (ESI) available: Phonon energy values; Raman spectra (decompression); excitation spectra; emission spectra (decompression); band ratios; enlarged luminescence rise curves; NIR luminescence decay curves and determined lifetimes for Yb3+ ions; pressure calibration curves, theoretical analysis of ET rate dependence on pressure; theoretical analysis of multi-phonon decay rates. A recorded movie of the NP high-pressure luminescence in a DAC chamber in AVI format. See DOI: 10.1039/c7nr04353h |
| This journal is © The Royal Society of Chemistry 2017 |

