 Open Access Article
Creative Commons Attribution 3.0 Unported Licence
Probing nanoscale functionalities of metal–organic framework nanocrystals†
Yao
Sun
 a,
Zhigang
Hu
 b,
Dan
Zhao
 *b and
Kaiyang
Zeng
 *a
*a
aDepartment of Mechanical Engineering, National University of Singapore, 9 Engineering Drive 1, Singapore, 117576, Singapore. E-mail: mpezk@nus.edu.sg
bDepartment of Chemical and Biomolecular Engineering, National University of Singapore, 4 Engineering Drive 4, Singapore, 117585, Singapore. E-mail: chezhao@nus.edu.sg
First published on 1st August 2017
Abstract
Experimental investigation of functional properties of metal–organic frameworks (MOFs) at nanoscale precision is challenging and rarely reported. In this study, we report the piezo- and ferroelectric properties of NUS-6 MOF nanocrystals using dual AC resonance tracking piezoresponse force microscopy and piezoresponse force spectroscopy for the first time. Both NUS-6-(Hf) and NUS-6-(Zr) nanocrystals displayed anomalous piezoelectricity with the calculated piezoelectric coefficient dzz constants of 2.0–3.5 pm V−1 and 1.5–2.5 pm V−1, respectively. Moreover, NUS-6-(Hf) showed much better polarization-switching behaviors (ferroelectricity) than NUS-6-(Zr), featured by very low coercive biases in the ferroelectric hysteresis (PR) loop. Furthermore, elasticity and thermal stability of the NUS-6 nanocrystals have been presented. The results have opened a realm of probing piezo- and ferro-electric properties as well as mechanical properties of MOF nanocrystals, which are promising materials for applications in integrated microelectromechanical systems (MEMS).
Introduction
Piezoelectricity is an effect via which dielectric materials can produce electrical charges in the presence of a force and vice versa.1 With the development of integrated microelectromechanical systems (MEMS) in the 1980s, piezoelectric materials have been playing an indispensable role in our daily life.2 For example, MEMS have various applications in automotive industry, smart phones, etc.,3 whereas the core components are dominantly made of silicon-based piezoelectric materials. Similarly, ferroelectricity is defined as a phenomenon in which materials exhibit a spontaneous and reversible polarization under external electric fields.4 In addition to the hydrogen-bonded and non-hydrogen-bonded ferroelectrics, many inorganic compounds, liquid crystals, and polymers have been found to be ferroelectric active and are used in various piezoelectric, pyroelectric, and optical devices such as ferroelectric random access memories (FeRAM) and field-effect transistors.5 However, traditional piezo/ferroelectric materials (transition metal oxide-based) are relatively expensive, require high temperature for polar reorientation, and lack flexibility.6,7 Compared to inorganic compounds, organic and hybrid materials are promising because of their low costs, high flexibility, and processability.8Metal–organic frameworks (MOFs) are newly emerging inorganic and organic hybrid materials constructed by directional coordination bonds between metal ions/clusters and organic ligands.9–14 In general, although many studies have been conducted on gas storage, separation, and purification, as well as catalysis applications of the MOFs,15 only few studies have been reported on their piezo- and ferroelectric properties. In fact, because of wide tunability in organic ligands and metal clusters as well as the incorporation of internal host–guest interactions, MOFs can be, in principle, tuned for ferroelectric, magnetic, and multiferroic applications.16,17 For example, Cheetham and colleagues reported the first lead-free hybrid frameworks ([(CH3)2NH2]M(HCOO)3, M = Mn, Fe, Co, and Ni) with the traditional ABX3-type perovskite structure18 that showed multiferroic behaviors at 160–185 K because the hybrid transition metal ions exerted strong hydrogen bond ordering.19 Stroppa et al. conducted ab initio simulations on [C(NH2)3]M[(HCOO)3] with an ABX3 structure and proved that Cu- and Cr-based MOFs might be new multiferroic materials due to the Jahn–Teller effects, and the antiferro-distortion metals could induce a switchable ferroelectric polarization through hydrogen bonding.20,21 Sante et al. predicted the ferroelectric behaviors of [(CH3)2NH2]Mn(HCOO)3via density functional theory (DFT) calculations and achieved a ferroelectric polarization up to 6 μC cm−2 by tuning the organic cations.22 Li et al. observed the coexistence of resistance switching and ferroelectricity in an indium MOF, [InC16H11N2O8]·1.5H2O,23 which could be explained via the ferroelectric transition of N⋯H–O⋯H–N bridge-structured dipoles of water molecules and the amino-tethered MOFs. Despite these progresses, the reported measurements are mainly performed on large single crystal MOFs, whereas the experimental probing of the ferroelectric properties of MOF nanocrystals is challenging and rarely reported.
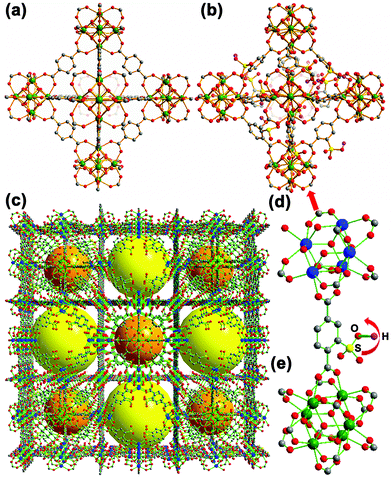
Some of the water-stable MOFs, such as UiO-series24,25 and MIL-series,26 are often considered as piezo- and ferro-electric inactive materials because of their high central symmetry and neutral structures.16 However, no solid experiments have been conducted to verify this may be due to the detection limits of the macroscopic ferroelectric testing systems (for example, large size of crystals).27 In fact, most of the water-stable Zr/Hf/Cr-based MOFs can only be prepared at the nanometer range (50–1000 nm).28 Therefore, a new approach is highly aspired and should be highly beneficial for the fundamental understanding of the relationships between the microstructures and the functional properties of these MOFs. In the previous study, two UiO-66 (Fig. 1a)-derived MOF materials, named NUS-6-(M) (M = Zr and Hf, C120O291S15M21), were synthesized.29,30 NUS-6-(M) can be best described by periodically replacing the 12-connected M6 clusters (M = Zr or Hf) in the parental UiO-66-SO3H framework (Fig. 1b) with 9-connected M6 clusters (Fig. 1c–e).30 The details of MOF synthesis and characterization are included in the corresponding sections of the ESI (ESI: Fig. S1 and S2, sections S1.1 and S1.2†). The consistency of missing ligands and clusters resulted in a charged asymmetric crystal structure, which might lead to piezoelectricity and ferroelectricity in these materials.31 To study this, herein, we have applied the dual AC resonance tracking piezoresponse force microscopy (DART-PFM) and piezoresponse force spectroscopy (PFS) for the first time to characterize the piezo- and ferro-electric properties of these MOFs at the nanoscale precision.
Results and discussion
Piezoelectricity of the NUS-6 MOFs
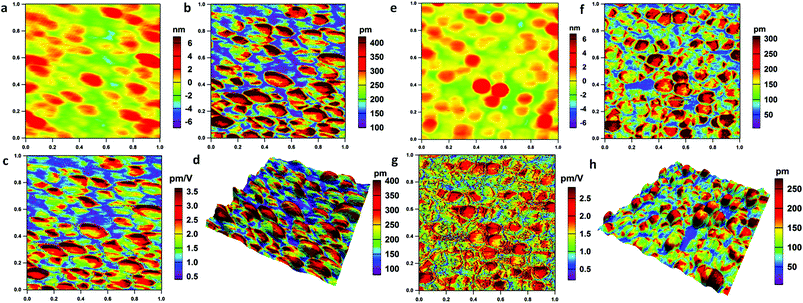
DART-PFM is a technique capable of measuring piezoelectric responses with reduced crosstalk with the topography due to the shift in the resonant frequency. This technique uses a feedback loop to adjust the drive frequency of the probe cantilever to match the resonance frequency (ESI: Fig. S3, section S1.3.1†).32 Rather than using the phase (ϕ) information as the input to the frequency feedback, it uses the difference between two amplitudes as the input feedback, based on monitoring the surface displacement of the piezoelectric materials induced by an electric bias. A functional generator is used to apply an AC voltage between the tip and the sample surface. This voltage induces deflection of the cantilever and can be detected by a reflected laser beam on a four-quadrant photodiode. In the DART-PFM experiments of this study, a 5 V AC driving voltage was applied on the probe (240AC-PP, OPUS, CA, USA). The detailed specification of the probe is listed in Table S1 (ESI†). Fig. 2 shows the corresponding topography and PFM amplitude images as well as the dzz [calculated images] using DSHO [damped simple harmonic oscillator model, see ESI: section 1.3.2†]. Fig. 2a and e show that the sizes of the NUS-6-(Hf) and NUS-6-(Zr) nanocrystals are approximately 150–200 nm with mild variation, which agree with the SEM observations (ESI: Fig. S2†). It is obvious that both NUS-6-(Hf) and NUS-6-(Zr) nanocrystals show significant piezoresponse with several hundreds of picometer (pm) amplitudes under the applied bias (Fig. 2b and f). Moreover, NUS-6-(Hf) shows significantly larger piezoresponse with a PFM amplitude of 300–400 pm as compared to the NUS-6-(Zr) nanocrystals (200–300 nm amplitude responses).Generally, a piezoelectric coefficient (also called piezoelectric modulus, d33) quantifies the volume change when a piezoelectric material is subjected to an uniform electric field.33d33 represents the deformation in the same direction of the electric field. However, during the PFM-based measurements, since the electric field is non-uniform due to the sharp tip of the PFM probe, d33 cannot be directly determined from the PFM measurements. Instead, we measured the vertical deformation under the applied electric field, which was also applied vertically by the PFM tip. This deformation by the voltage is then defined as dzz. This value can be determined by applying the DSHO model fitting and can also be mapped with the corresponding images. Larger values of dzz = 2.0–3.5 pm V−1 were determined for NUS-6-(Hf) nanocrystals, which were much larger than those of the NUS-6-(Zr) (1.5–2.5 pm V−1). The dzz values of the NUS-6 series MOFs are smaller than those of the typical piezoelectric materials such as a lead zirconate titanate (PZT) film (∼18 pm V−1),34 but larger than those of the biopiezoelectric materials such as bones (∼0.7 pm V−1).35Fig. 2d and h show the 3D images in which the PFM amplitude image overlaid on the topographic image for both NUS-6-(Hf) and NUS-6-(Zr) nanocrystals, respectively. From these images, the non-uniform piezoresponse distribution in each nanocrystal can be clearly seen. The results also suggest the possible structural anisotropy in the NUS-6 series nanocrystals.36
Ferroelectricity of NUS-6
In addition to the PFM measurement, piezoresponse force spectroscopy (PFS)37,38 technique (ESI: section 1.3.3†) was further applied to acquire the local ferroelectric hysteresis loops from the surface of the NUS-6 series nanocrystals. In this technique, the optimal signal-to-noise ratio is achieved at a frequency near the contact resonance frequency of the probe cantilever. The probe approaches the sample surface in the vertical direction with the deflection set point (trigger force) used as a feedback (ESI: Fig. S4†). When the set point is reached, a hysteresis loop is acquired by sweeping the voltages. Fig. 3 shows the respective PFS results for the NUS-6-(Hf) and NUS-6-(Zr) nanocrystals. The amplitude butterfly loops (Fig. 3a and d) obtained during the DC-off state correspond to the piezoelectric responses of the nanocrystals. The maximum amplitudes of the butterfly loops are 1.1 nm and 0.6 nm for NUS-6-(Hf) and NUS-6-(Zr) nanocrystals, respectively, which confirm the larger piezoresponse of the NUS-6-(Hf); this agrees well with the results of the DART-PFM measurements. It has been found that a negative bias induces more deformation than the positive bias for both NUS-6 series MOFs. Fig. 3b and e show the piezoelectric phase loop. The phase shifts are very close to 180° for both NUS-6-(Hf) and NUS-6-(Zr) nanocrystals, and this suggests a possible ferroelectric behavior for both nanocrystals.39 The amplitude butterfly loops and phase loops obtained during the DC-off state are, therefore, strong evidences for ferroelectricity in NUS-6-(Hf) and NUS-6-(Zr) nanocrystals.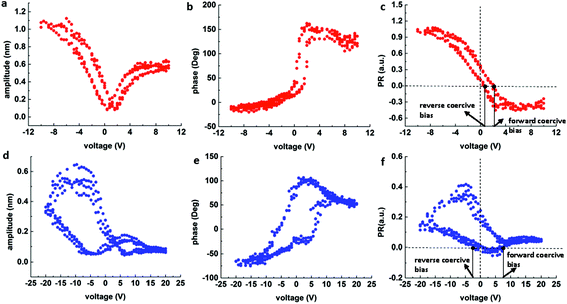 | ||
| Fig. 3 PFS results of NUS-6-(Hf) (a–c) and NUS-6-(Zr) (d–f): (a and d) amplitude butterfly loops; (b and e) phase loops; and (c and f) calculated PR loops. | ||
It has been reported that the ferroelectric hysteresis loops (PR loops) are in good agreement with results of the macroscopic ferroelectric tests (P–E tests).40 Although it is not possible to obtain the PR loops in every point on the NUS-6 nanocrystals, the ferroelectric properties of NUS-6 can be exquisitely found. The PR loops (Fig. 3c and f) are thus calculated using the equation: PR = A × cos(ϕ), where A and ϕ denote the amplitude (pm) and phase responses, respectively. It is noticeable that the PR loops obtained from both NUS-6-(Hf) and NUS-6-(Zr) are non-symmetric with the positive values of the remnant piezoresponses (that is, PR when bias = 0 V). In addition, the PR loops are shifted along the voltage axis; this indicates that the internal bias exists from the aligned dipoles.41
In the hybrid structures of NUS-6, the metal (Hf/Zr)–oxygen coordination system42 (Fig. 1) is supposed to serve as active dipoles. It has been reported that non-covalent bonds are polar since asymmetry of electron density appears when two or more molecules interact.43 However, there might also be other factors, such as encapsulation of water molecules in the lattice to form polar ordering, leading to the ferroelectric behaviors.44 Furthermore, molecular fragments of MOFs could exhibit free rotation of ligands around a static axis; this could be treated as bistable orientations43 and may also result in the ferroelectric behavior of the MOF-based materials. It is interesting to note that the PR loop of the NUS-6-(Hf) nanocrystal has a slim and tilted shape (Fig. 3c). This type of PR loop resembles those of some synthetic ferroelectric polymers used for energy application, which can be characterized by large electric energy density and very small remnant polarization.45–48 It is generally believed that this type of PR loop represents materials having high energy storage and release capabilities.49 In addition, the coercive biases (that is, biases when PR = 0) for NUS-6-(Hf) are less than 3 V, indicating an easier polarization switching in this material. By contrast, NUS-6-(Zr) shows quite little ferroelectric polarization switching because the PR loop remains almost at the positive level (PR > 0, Fig. 3f). Compared to that in the NUS-6-(Hf), no obvious switching behavior is observed in NUS-6-(Zr). Moreover, the forward coercive bias of NUS-6-(Zr) is around 7.5 V, which is significantly larger than that of NUS-6-(Hf) (∼2.1 V). These observations suggest that NUS-6-(Hf) has much better ferroelectric characteristics than NUS-6-(Zr). Considering the fact that these two types of nanocrystals share the same crystal structure and ligands (Fig. 1 and Fig. S1†),30 the only factor that may lead to these significant differences in the ferroelectric behaviors between NUS-6-(Hf) and NUS-6-(Zr) is their different metal clusters (Hf vs. Zr). In fact, the polarity of the Hf–O bond is larger than that of the Zr–O bond; this is also supported by the studies of NU-1000(Hf).50 Furthermore, it has been found that HfO2 is more ionic than ZrO2.51 Therefore, the results obtained in this study suggest that the ferroelectric properties of MOFs can be easily tuned via judicious selection of metal ions in their asymmetric structures. These metal ions with larger bond polarity are capable of resulting in better ferroelectric switching behaviors.
Mechanical property and thermal stability of NUS-6
In addition to the piezo- and ferro-electric properties, the thermal stability and mechanical robustness are also important issues for the design and application of MOFs.52 There are many studies on the mechanical properties of MOFs; among these, the majority have reported traditional nanoindentation or three-point bending tests to obtain the elastic modulus of large single crystal MOFs.53–55 However, direct experimental measurements of nanomechanical properties and high-temperature mechanical behaviors of MOF nanocrystals are rarely reported. Recently, Tan and his co-workers have conducted pioneering experiments to measure the nanomechanical properties of HKUST-1 thin films in situ via an AM–FM mode based on the multifrequency (bimodal) AFM technique with a high-resolution amplitude tapping mode (topography by AM) and high-sensitivity frequency modulation mode (elasticity by FM).56In this study, we proposed an off-line approach using the AM–FM experiments (ESI: Fig. S5, section S1.4.1†) to derive the elastic modulus (E) from the tip–sample contact stiffness image at room temperature and high temperatures (ESI: section S1.4.2†). The detailed specifications of the probe (AC160TS, Asylum Research, CA, USA) used for AM–FM characterization are listed in Table S2 (ESI†). Fig. 4 shows the AM–FM images of the NUS-6 nanocrystals. Tip–sample contact stiffness images can be found in Fig. S6 (ESI†). A wafer of pure magnesium (E ≈ 40 GPa) (ESI: Fig. S7†) is chosen as a reference sample to calculate the MOFs’ elastic modulus. The topography of NUS-6-(Hf) and NUS-6-(Zr) (Fig. 4a–b) is in good agreement with the results of the DART-PFM measurements. By acquiring data points along the line profiles (Fig. 4c–d) across the nanocrystals, an average elastic modulus for NUS-6-(Hf) and NUS-6-(Zr) is obtained as 54.7 ± 29.0 GPa and 45.9 ± 14.5 GPa, respectively (ESI: Fig. S8†). Again, NUS-6-(Hf) shows higher elastic modulus than NUS-6-(Zr); this can be explained via the larger binding and breaking energy for the Hf–O bonds than for Zr–O bonds.50 Furthermore, we conducted AM–FM experiments on both the NUS-6-(Hf) and NUS-6-(Zr) nanocrystals with different particle sizes (ESI: Fig. S9†) ranging from 200 to 500 nm, with mild variation (ESI: Fig. S9a and S9d†). By acquiring data points along the line profiles (Fig. S9c and S9f†), it can be observed that the larger particles have larger elastic moduli than the smaller particles (ESI: Fig. S10†). This finding is consistent with the study conducted on MOF-5 by Siegel and co-workers in which they have reported that a smaller particle size can lead to an increased contribution of the external surface area and intraparticle porosity, as well as decreased particle strength.57
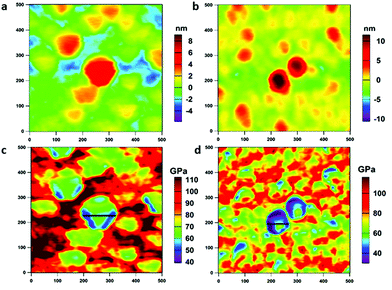 | ||
| Fig. 4 AM–FM images (500 nm × 500 nm) of NUS-6-(Hf) (1st column) and NUS-6-(Zr) (2nd column): (a and b) topography and (c and d) elastic modulus. | ||
Using the heating stage together with AM–FM technique, we also measured the change in the elastic modulus of NUS-6 series MOFs with the increase in temperature to determine the relationship between the temperature-dependent mechanical property and structure at the nanoscale. The average elastic modulus values as a function of temperature are shown in Fig. 5a. The detailed AM–FM images of NUS-6 nanocrystals at 298 K, 333 K, and 363 K are shown in Fig. S11–S12 (ESI†). Fig. S13 and S14 (ESI†) show the change in height and elastic modulus along the line profiles, as shown in Fig. S11 and S12 (ESI†), for NUS-6-(Hf) and NUS-6-(Zr) nanocrystals, respectively.
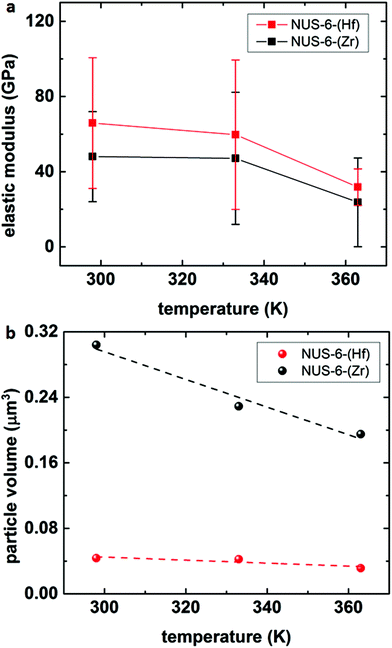 | ||
| Fig. 5 AM–FM results of the (a) elastic modulus and (b) particle volume of NUS-6-(Hf) and NUS-6-(Zr) as a function of temperature (298 K, 333 K, and 363 K). | ||
It is interesting to note that a decrease in particle diameter and elastic modulus along the line profiles (ESI: Fig. S13–S14†) can be observed with an increase in temperature. In addition, the changes in the particle area as well as the particle volume were determined by performing particle analysis on the topographic images using a commercial software (SPIP 6.5.2, Image Metrology A/S, Denmark), and the results are shown in Fig. 5b and Fig. S15 (ESI†). Fig. 5b clearly shows that the volume of the particles for both NUS-6-(Hf) and NUS-6-(Zr) decreases with the increase in temperature. It can be observed that the particle volume of NUS-6-(Hf) decreases from 0.0436 μm3 (298 K) to 0.0423 μm3 (333 K) and finally to 0.0314 μm3 (363 K), whereas the particle volume of NUS-6-(Zr) shows a similar trend, i.e. from 0.304 μm3 at 298 K to 0.229 μm3 at 333 K and 0.195 μm3 at 363 K. It seems that both NUS-6-(Hf) and NUS-6-(Zr) demonstrate a negative thermal expansion (NTE) behavior, which is similar to that of the UiO-66,58 as almost a linear decrease in the particle volume is observed with the increase in temperature for both materials. Similarly, decrease in particle areas is observed for both NUS-6-(Hf) and NUS-6-(Zr) (Fig. S15, ESI†). Furthermore, Fig. 5a shows the reduction in the elastic modulus of NUS-6-(Hf) from 65.9 ± 34.8 GPa (298 K) to 59.7 ± 39.8 GPa (333 K) and finally to 31.8 ± 9.7 GPa (363 K), whereas NUS-6-(Zr) shows a similar decreasing trend from 48.0 ± 24.0 GPa to 47.1 ± 35.1 GPa and finally to 23.7 ± 23.6 GPa. Despite the large deviations in the elastic modulus for both NUS-6-(Hf) and NUS-6-(Zr), which is likely due to the elastic anisotropy associated with the structure anisotropy of the NUS-6 crystals at the nanoscale, a decrease in modulus with the increasing temperature can be clearly seen for both materials. The range of the elastic moduli of the NUS-6 crystals intersects with those of the ceramics, metals, and polymers and is similar to the large elastic modulus ranges simulated for MIL-140 MOF.59 Therefore, MOFs can well connect the essentially rigid inorganic solids and the relatively soft polymers. This phenomenon is found to be more significant than that reported in a previous study.52 Moreover, Fig. 5a confirms that NUS-6 series MOFs degrade upon thermal treatment; this agrees with the thermal gravimetric analysis (TGA) curves reported in the literature.29,30 In addition, from Fig. 5a, it is found that the degradation temperature for NUS-6 series MOFs is higher than 330 K; this finding has offered a new approach other than TGA to accurately probe the thermal stability of MOFs60 and also suggests a suitable temperature range for the application of the MOF-based materials.
Conclusions
In summary, we present the results of piezo- and ferro-electric properties of the NUS-6 series MOF nanocrystals using the dual AC resonance tracking piezoresponse force microscopy (DART-PFM) and piezoresponse force spectroscopy (PFS) techniques. NUS-6-(Hf) nanocrystals demonstrate much stronger nanoscale piezoresponses and ferroelectric polarization behaviors than NUS-6-(Zr) nanocrystals at room temperature; this can be explained by the larger bond polarity of the Hf–O bond than that of the Zr–O bond. It is worth noting that the piezoresponse (PR) loop of the NUS-6-(Hf) nanocrystal resembles that of the commonly used synthetic polymers with large electric energy density and very small remnant polarization used for energy application. It is also demonstrated that the ferroelectric properties of MOFs can be tuned by judicious selection of metal ions to form more polar coordination bonds capable of forming an electronic structure in an asymmetric lattice. In addition, we offer a newly developed approach to accurately probe the thermal stability of MOFs by measuring the elastic modulus versus temperature through the multifrequency AFM technique. The elastic anisotropy of MOFs resulted from the competition between inorganic solids and organic ligands is well revealed, which offers a valuable insight into the rational design for mechanical robustness. This study also aims to open a realm of probing ferroelectric properties of MOF nanocrystals and designing novel MOF-based ferroelectrics using advanced scanning probe microscopy-based techniques.Conflicts of interest
There are no conflicts to declare.Acknowledgements
This work was supported by the Ministry of Education (Singapore) through the National University of Singapore under the Academic Research Grant (AcRF) R-265-000-495-112. D. Z. acknowledges the financial support received from the National University of Singapore (CENGas R-261-508-001-646) and Ministry of Education – Singapore (MOE AcRF Tier 2 R-279-000-429-112). Y. S. also thanks the postgraduate scholarship received from the National University of Singapore.Notes and references
- S. Marauska, V. Hrkac, T. Dankwort, R. Jahns, H. J. Quenzer, R. Knöchel, L. Kienle and B. Wagner, Microsyst. Technol., 2012, 18, 787–795 CrossRef CAS.
- N. Setter, D. Damjanovic, L. Eng, G. Fox, S. Gevorgian, S. Hong, A. Kingon, H. Kohlstedt, N. Y. Park, G. B. Stephenson, I. Stolitchnov, A. K. Taganstev, D. V. Taylor, T. Yamada and S. Streiffer, J. Appl. Phys., 2006, 100, 051606 CrossRef.
- S. Tadigadapa and K. Mateti, Meas. Sci. Technol., 2009, 20, 092001 CrossRef.
- R. Ramesh and N. A. Spaldin, Nat. Mater., 2007, 6, 21–29 CrossRef CAS PubMed.
- G. H. Haertling, J. Am. Ceram. Soc., 1999, 82, 797–818 CrossRef CAS.
- S. R. Khaled, D. Sameoto and S. Evoy, Smart Mater. Struct., 2014, 23, 033001 CrossRef.
- N. A. Benedek and C. J. Fennie, Phys. Rev. Lett., 2011, 106, 107204 CrossRef PubMed.
- K.-H. Jakob, S. Clemens and R. Horst-Günter, Rep. Prog. Phys., 2013, 76, 126502 CrossRef PubMed.
- G. Férey, C. Serre, T. Devic, G. Maurin, H. Jobic, P. L. Llewellyn, G. De Weireld, A. Vimont, M. Daturi and J. S. Chang, Chem. Soc. Rev., 2011, 40, 550–562 RSC.
- T. R. Cook, Y.-R. Zheng and P. J. Stang, Chem. Rev., 2013, 113, 734–777 CrossRef CAS PubMed.
- H.-C. Zhou and S. Kitagawa, Chem. Soc. Rev., 2014, 43, 5415–5418 RSC.
- H. Furukawa, K. E. Cordova, M. O'Keeffe and O. M. Yaghi, Science, 2013, 341, 1230444 CrossRef PubMed.
- A. J. Howarth, Y. Liu, P. Li, Z. Li, T. C. Wang, J. T. Hupp and O. K. Farha, Nat. Rev. Mater., 2016, 1, 15018 CrossRef CAS.
- O. M. Yaghi, J. Am. Chem. Soc., 2016, 138, 15507–15509 CrossRef PubMed.
- I. Ahmed and S. H. Jhung, Mater. Today, 2014, 17, 136–146 CrossRef CAS.
- W. Zhang and R.-G. Xiong, Chem. Rev., 2012, 112, 1163–1195 CrossRef CAS PubMed.
- R. Ramesh, Nature, 2009, 461, 1218–1219 CrossRef CAS PubMed.
- K.-L. Hu, M. Kurmoo, Z. Wang and S. Gao, Chem. – Eur. J., 2009, 15, 12050–12064 CrossRef CAS PubMed.
- P. Jain, V. Ramachandran, R. J. Clark, H. D. Zhou, B. H. Toby, N. S. Dalal, H. W. Kroto and A. K. Cheetham, J. Am. Chem. Soc., 2009, 131, 13625–13627 CrossRef CAS PubMed.
- A. Stroppa, P. Jain, P. Barone, M. Marsman, J. M. Perez-Mato, A. K. Cheetham, H. W. Kroto and S. Picozzi, Angew. Chem., Int. Ed., 2011, 50, 5847–5850 CrossRef CAS PubMed.
- A. Stroppa, P. Barone, P. Jain, J. M. Perez-Mato and S. Picozzi, Adv. Mater., 2013, 25, 2284–2290 CrossRef CAS PubMed.
- D. Di Sante, A. Stroppa, P. Jain and S. Picozzi, J. Am. Chem. Soc., 2013, 135, 18126–18130 CrossRef CAS PubMed.
- L. Pan, G. Liu, H. Li, S. Meng, L. Han, J. Shang, B. Chen, A. E. Platero-Prats, W. Lu, X. Zou and R.-W. Li, J. Am. Chem. Soc., 2014, 136, 17477–17483 CrossRef CAS PubMed.
- J. H. Cavka, S. Jakobsen, U. Olsbye, N. Guillou, C. Lamberti, S. Bordiga and K. P. Lillerud, J. Am. Chem. Soc., 2008, 130, 13850–13851 CrossRef PubMed.
- Z. Hu and D. Zhao, Dalton Trans., 2015, 44, 19018–19040 RSC.
- G. Férey, C. Mellot-Draznieks, C. Serre, F. Millange, J. Dutour, S. Surblé and I. Margiolaki, Science, 2005, 309, 2040–2042 CrossRef PubMed.
- H.-Y. Ye, D.-W. Fu, Y. Zhang, W. Zhang, R.-G. Xiong and S. D. Huang, J. Am. Chem. Soc., 2009, 131, 42–43 CrossRef CAS PubMed.
- M. Bosch, S. Yuan and H.-C. Zhou, in The Chemistry of Metal–Organic Frameworks, Wiley-VCH Verlag GmbH & Co. KGaA, 2016, pp. 137–170 Search PubMed.
- J. M. Taylor, T. Komatsu, S. Dekura, K. Otsubo, M. Takata and H. Kitagawa, J. Am. Chem. Soc., 2015, 137, 11498–11506 CrossRef CAS PubMed.
- Z. Hu, Y. Peng, Y. Gao, Y. Qian, S. Ying, D. Yuan, S. Horike, N. Ogiwara, R. Babarao, Y. Wang, N. Yan and D. Zhao, Chem. Mater., 2016, 28, 2659–2667 CrossRef CAS.
- S. Beeby, G. Ensell, M. Kraft and N. White, Microelectromechanical Systems Series, 2004 Search PubMed.
- A. L. Kholkin, S. V. Kalinin, A. Roelofs and A. Gruverman, Review of Ferroelectric Domain Imaging by Piezoresponse Force Microscopy, Springer, New York, 2007, vol. 173, pp. 173–214 Search PubMed.
- S. K. Mahadeva, K. Walus and B. Stoeber, J. Mater. Chem. C, 2016, 4, 1448–1453 RSC.
- H.-N. Lin, S.-H. Chen, S.-T. Ho, P.-R. Chen and I.-N. Lin, J. Vac. Sci. Technol., B, 2003, 21, 916–918 CAS.
- Y. Zhang, L. Chen, J. Zeng, K. Zhou and D. Zhang, Mater. Sci. Eng., C, 2014, 39, 143–149 CrossRef CAS PubMed.
- J. C. Tan, T. D. Bennett and A. K. Cheetham, Proc. Natl. Acad. Sci. U. S. A., 2010, 107, 9938–9943 CrossRef CAS PubMed.
- V. K. Sergei, N. M. Anna, C. Long Qing and J. R. Brian, Rep. Prog. Phys., 2010, 73, 056502 CrossRef.
- S. Jesse, H. N. Lee and S. V. Kalinin, Rev. Sci. Instrum., 2006, 77, 073702 CrossRef.
- S. Horiuchi and Y. Tokura, Nat. Mater., 2008, 7, 357–366 CrossRef CAS PubMed.
- B. J. Rodriguez, S. Jesse, K. Seal, N. Balke, S. V. Kalinin and R. Proksch, Scanning Probe Microscopy of Functional Materials, 2010 Search PubMed.
- G. Arlt and H. Neumann, Ferroelectrics, 1988, 87, 109–120 CrossRef CAS.
- W. Zhang, H.-Y. Ye and R.-G. Xiong, Coord. Chem. Rev., 2009, 253, 2980–2997 CrossRef CAS.
- A. S. Tayi, A. Kaeser, M. Matsumoto, T. Aida and S. I. Stupp, Nat. Chem., 2015, 7, 281–294 CrossRef CAS PubMed.
- H.-B. Cui, K. Takahashi, Y. Okano, H. Kobayashi, Z. Wang and A. Kobayashi, Angew. Chem., Int. Ed., 2005, 44, 6508–6512 CrossRef CAS PubMed.
- B. Chu, X. Zhou, K. Ren, B. Neese, M. Lin, Q. Wang, F. Bauer and Q. M. Zhang, Science, 2006, 313, 334–336 CrossRef CAS PubMed.
- Z. Zhang and T. C. M. Chung, Macromolecules, 2007, 40, 9391–9397 CrossRef CAS.
- Z. Zhang, Q. Meng and T. C. M. Chung, Polymer, 2009, 50, 707–715 CrossRef CAS.
- Y. Wang, X. Zhou, Q. Chen, B. Chu and Q. Zhang, IEEE Trans. Dielectr. Electr. Insul., 2010, 17, 1036–1042 CrossRef CAS.
- X. Hao, J. Adv. Dielectr., 2013, 03, 1330001 CrossRef.
- M. H. Beyzavi, R. C. Klet, S. Tussupbayev, J. Borycz, N. A. Vermeulen, C. J. Cramer, J. F. Stoddart, J. T. Hupp and O. K. Farha, J. Am. Chem. Soc., 2014, 136, 15861–15864 CrossRef CAS PubMed.
- W. Zheng, K. H. Bowen, J. Li, I. D
![[a with combining cedilla]](https://www.rsc.org/images/entities/char_0061_0327.gif) bkowska and M. Gutowski, J. Phys. Chem. A, 2005, 109, 11521–11525 CrossRef CAS PubMed.
bkowska and M. Gutowski, J. Phys. Chem. A, 2005, 109, 11521–11525 CrossRef CAS PubMed. - J. C. Tan and A. K. Cheetham, Chem. Soc. Rev., 2011, 40, 1059–1080 RSC.
- R. J. Marshall, T. Richards, C. L. Hobday, C. F. Murphie, C. Wilson, S. A. Moggach, T. D. Bennett and R. S. Forgan, Dalton Trans., 2016, 45, 4132–4135 RSC.
- Z. Chen, G. Wang, Z. Xu, H. Li, A. Dhôtel, X. C. Zeng, B. Chen, J.-M. Saiter and L. Tan, Adv. Mater., 2013, 25, 6106–6111 CrossRef CAS PubMed.
- J.-C. Tan, P. Jain and A. K. Cheetham, Dalton Trans., 2012, 41, 3949–3952 RSC.
- A. K. Chaudhari, I. Han and J.-C. Tan, Adv. Mater., 2015, 27, 4438–4446 CrossRef CAS PubMed.
- Y. Ming, J. Purewal, D. a. Liu, A. Sudik, C. Xu, J. Yang, M. Veenstra, K. Rhodes, R. Soltis, J. Warner, M. Gaab, U. Müller and D. J. Siegel, Microporous Mesoporous Mater., 2014, 185, 235–244 CrossRef CAS.
- M. J. Cliffe, J. A. Hill, C. A. Murray, F.-X. Coudert and A. L. Goodwin, Phys. Chem. Chem. Phys., 2015, 17, 11586–11592 RSC.
- M. R. Ryder, B. Civalleri and J.-C. Tan, Phys. Chem. Chem. Phys., 2016, 18, 9079–9087 RSC.
- A. U. Czaja, N. Trukhan and U. Muller, Chem. Soc. Rev., 2009, 38, 1284–1293 RSC.
Footnote |
| † Electronic supplementary information (ESI) available: Materials and method; Fig. S1–S15; Tables S1 and S2. See DOI: 10.1039/c7nr04245k |
| This journal is © The Royal Society of Chemistry 2017 |

