
 Open Access Article
 This Open Access Article is licensed under a
 Creative Commons Attribution 3.0 Unported Licence
Polymer sequencing by molecular machines: a framework for predicting the resolving power of a sliding contact force spectroscopy sequencing method†
Alex
Dunlop
a,
Kate
Bowman
b,
Olav
Aarstad
c,
Gudmund
Skjåk-Bræk
c,
Bjørn T.
Stokke
d and
Andrew N.
Round
 *b
*b
aHH Wills Physics Laboratory, University of Bristol, Tyndall Avenue, Bristol BS8 1TL, UK
bSchool of Pharmacy, University of East Anglia, Norwich Research Park, Norwich NR4 7TJ, UK. E-mail: a.round@uea.ac.uk
cDepartment of Biotechnology, The Norwegian University of Science and Technology, NTNU, NO-7491 Trondheim, Norway
dDepartment of Physics, The Norwegian University of Science and Technology, NTNU, NO-7491 Trondheim, Norway
First published on 2nd October 2017
Abstract
We evaluate an AFM-based single molecule force spectroscopy method for mapping sequences in otherwise difficult to sequence heteropolymers, including glycosylated proteins and glycans. The sliding contact force spectroscopy (SCFS) method exploits a sliding contact made between a nanopore threaded over a polymer axle and an AFM probe. We find that for sliding α- and β-cyclodextrin nanopores over a wide range of hydrophilic monomers, the free energy of sliding is proportional to the sum of two dimensionless, easily calculable parameters representing the relative partitioning of the monomer inside the nanopore or in the aqueous phase, and the friction arising from sliding the nanopore over the monomer. Using this relationship we calculate sliding energies for nucleic acids, amino acids, glycan and synthetic monomers and predict on the basis of these calculations that SCFS will detect N- and O-glycosylation of proteins and patterns of sidechains in glycans. For these applications, SCFS offers an alternative to sequence mapping by mass spectrometry or newly-emerging nanopore technologies that may be easily implemented using a standard AFM.
Introduction
While the sequencing of DNA is now routine, with more rapid and more accurate approaches under constant development, a method for sequencing long stretches of other polymers, whether naturally occurring (such as polysaccharides) or synthetic, does not exist. There is a pressing, unmet need for a polysaccharide sequence mapping tool, since these polymers lack a canonical sequence and instead the pattern of monomer and branching sequence depends on several factors, determined by cellular metabolism, developmental stage, nutrient availability and others.1 Even in polymers with canonical sequences, such as proteins and nucleic acids, post-translational modification of proteins by glycosylation, phosphorylation and other additions,2,3 as well as epigenetic modifications of nucleic acids,4 occur in micro- and macroheterogeneous patterns that are not always easy to discern. Recently, the emergence of sequence-defined synthetic polymers has created a new class of materials in which relevant properties may be controlled with much greater precision than before, where sequence directly controls function.5–7 Previously the authors8,9 and others10 explored the feasibility of a new route, here called sliding contact force spectroscopy (SCFS), to obtaining sequence information in linear heteropolymers by atomic force microscopy (AFM), but the limits and applicability of the method have not been fully explored. Here we set out to describe the parameters that determine how easy or difficult it is to pass a cyclodextrin (CD)-based macrocycle over a particular monomer, and from that basis derive a framework within which we can predict whether the monomers in a particular copolymer are distinguishable using this method.The SCFS method uses a cyclodextrin (CD)-based macrocycle tethered to the AFM probe, with the polymer to be interrogated tethered likewise to another surface and induced to form a host–guest complex with the macrocycle to form a polyrotaxane11 or molecular ring-thread complex. Rotaxanes are examples of a broad group of supramolecular complexes that can be induced to do mechanochemical work, and which can be described as ‘molecular machines’.12 This rapidly expanding group includes molecular ‘walkers’,13 shuttles and switches that can in some cases do work against significant external loads.14 The SCFS experiment has parallels with the nanopore sequencing approach that is under continuous development as a DNA sequencing tool15,16 and which has recently been shown to discriminate between different poly(ethylene glycol) (PEG) polymers on the basis of their molecular weight, with monomer resolution.17 In particular, AFM has been used to measure the forces acting on ssDNA as it slides by either a “frictionless” or a “stick-slip” mode in a nanopore.18 The most common terminology19 for describing the processes occurring in a rotaxane depicts a macrocyclic ‘bead’ shuttling between ‘stations’ on the polymer axle. In the SCFS method described here and previously,8–10 the bead is α- or β-cyclodextrin (α-CD and β-CD hereafter) and the stations are the individual monomers comprising the polymer axle, while the AFM probe supplies the unidirectional driving force for shuttling the bead between stations (hereafter ‘sliding’) under a load generated by the controlled separation of probe and sample. Fig. 1 illustrates the parallels between a conventional rotaxane system and the assembly constructed for SCFS. The concept of manipulating a rotaxane using a local force probe has been explored before: Komiyama and coworkers20 used STM (Scanning Tunnelling Microscopy) to manipulate α-CD beads forming a polyrotaxane with poly(ethylene glycol) (PEG) back and forth along the PEG axle, while Stoddart et al.21 and Leigh and Duwez14 have used AFM to measure the force required to drive a bead between two stations in a rotaxane. None of these works addressed the use of a sliding contact between a bead and a polymer as a sequencing tool. Previous analyses of the challenges to polymer sequencing by single molecule force spectroscopy (SMFS), with or without a sliding contact, have focused on DNA sequencing.22,23
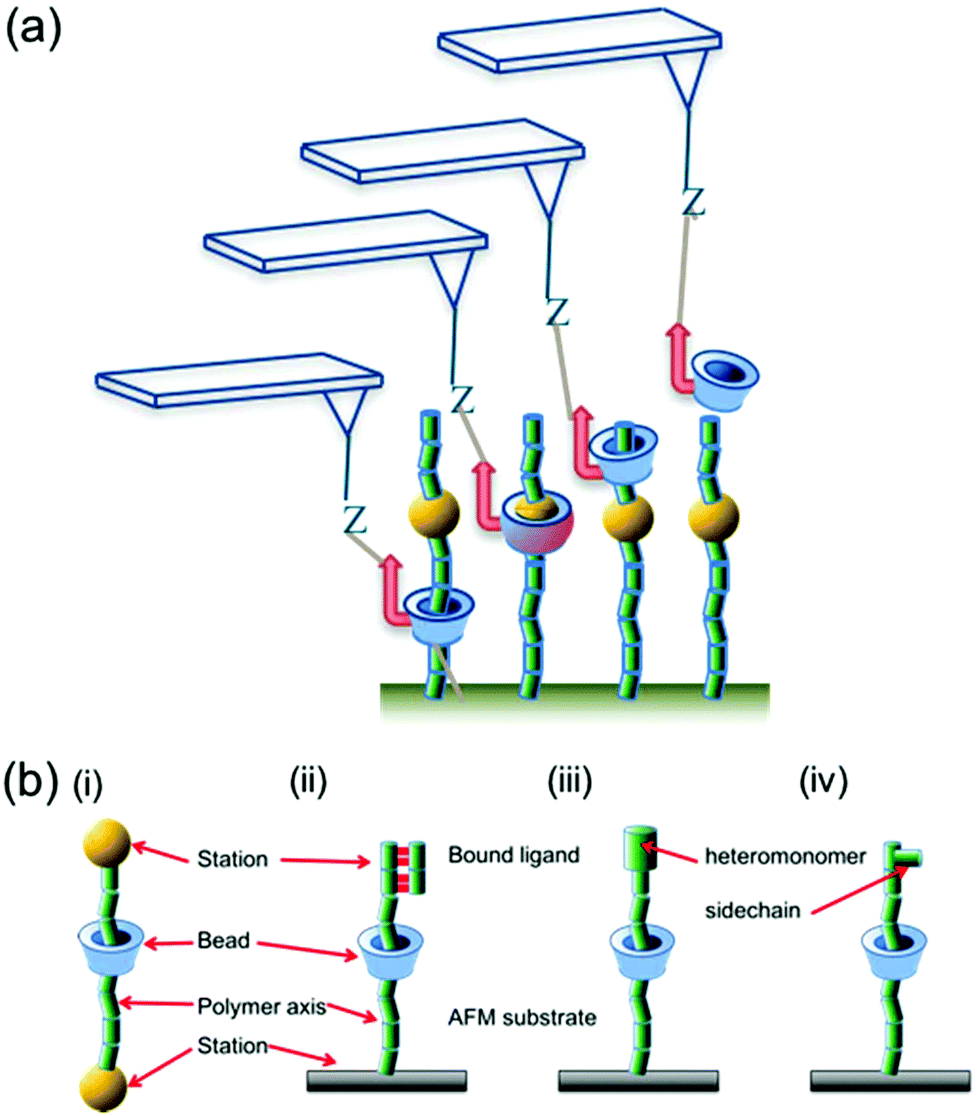 | ||
| Fig. 1 (a) Schematic illustration highlighting how the SCFS experiment is conducted. An AFM probe makes a bond (Z) with a functionalised CD bead that is threaded onto a polymer, forming a pseudorotaxane. The AFM probe drives the bead along the polymer strand, encountering each monomer in turn. (b) The parallels between a conventional rotaxane system (i) and various iterations of the sliding contact pseudorotaxane (ii–iv). The common features (station, bead, axis) are labelled in each, along with examples of the monomer features that may constitute a ‘station’ in the sliding contact experiment: a bound ligand (ii), a different monomer (iii) or a sidechain (iv). | ||
We have shown previously that measurements made with the SCFS approach described here yielded excellent agreement with the predicted positions of aromatic rings substituted into PEG polymers based upon the measured molecular weights of the polymers,8 and that the CD bead could be used to unzip interactions between the polymer axle and molecules bound to specific sequences within that polymer.9 Thus the available evidence suggests that SCFS may offer a method for mapping or sequencing long, linear polymers where there are large differences between monomers or blocks, or where specific sequences are recognised by other molecules. However, the limits on the size and nature of the different monomer stations and macrocyclic beads for which differences in force may be distinguished remain undefined.
In the present work we compare the forces measured during the forced sliding of α- and β-CD beads along PEG-based polymers possessing one or more of 4 different stations representative of 2 classes of monomer: aromatic rings and glycans. As well as representing common polymers, these groups encompass a wide range of molecular cross-sectional areas, aqueous solubilities and affinities for complexation with α- and β-CDs. We apply the Friddle–Noy–de Yoreo (F–N–Y)24,25 method for analysing single molecule force spectra in order to extract the energies involved in the bead-station interactions and consider the parameters that have predictive power in determining the resolution of the SCFS sequencing approach. Finally, we consider the potential and the limits of the method for sequencing common polymers.
Results and discussion
Analysing sliding contact force spectra
In addition to previously published8,9 datasets using α-CD and stations 1, 2, 4 and 5 on PEG axles (pyromellitic acid, aminoaniline, guluronic and mannuronic acid respectively; see Fig. 2 for structures), we have conducted SCFS experiments using β-CD beads in order to probe the effect of differences in pore size. Recently Friddle, Noy and De Yoreo introduced a new model24,25 for analysing single molecule force spectroscopy experiments that describes both the near-equilibrium (at low loading rates) and far-from-equilibrium (at high loading rates) regimes of the dynamic force spectrum (plot of most probable rupture force vs. instantaneous loading rate at rupture). The model has been shown to apply to interactions between ligands and receptors, small molecules and bulk surfaces.24 In common with the established Bell–Evans model,26 the method is used to extract the parameters koff and xt, the intrinsic unbinding rate of the bond and the distance to the transition state, from the force spectrum. In cases where the near-equilibrium regime is reached, a third parameter, the equilibrium force feq (the minimum force required to move the binding pair apart by the distance xt, beyond which they can no longer instantaneously rebind) may be obtained and from it ΔGbu, the equilibrium unbinding free energy, for the bond. The term ‘equilibrium’ here is used in the sense used by Friddle et al.24,25 and denotes a process that is occurring rapidly in both forward and reverse direction with respect to the travel of the AFM probe and the CD bead attached to it. Here we treat the process of shuttling (sliding a bead over a station in a polymer) in the same way as breaking a conventional ligand–receptor bond and so we use the values of feq we have recorded to calculate ΔGsl, the sliding free energy, in analogy with the ΔGbu term described above. Our justification for taking this approach lies in the common features of both processes: the elastic polymer tethers will act as entropic springs at low forces and undergo enthalpic bond stretching at higher forces until the tension is released, either by breaking a bond or by forcing the bead to slide over the monomer station. Before applying the model we follow Akhremitchev's method27 of using the fitted Kuhn lengths to distinguish between single and multiple polymer stretches, selecting only single polymer stretches (those with Kuhn lengths equal to or greater than the Kuhn length of a single PEG chain) for further analysis. This approach was recently applied to the crosslinking of DNA by intercalators.28 The analysis of the data is presented in the ESI.†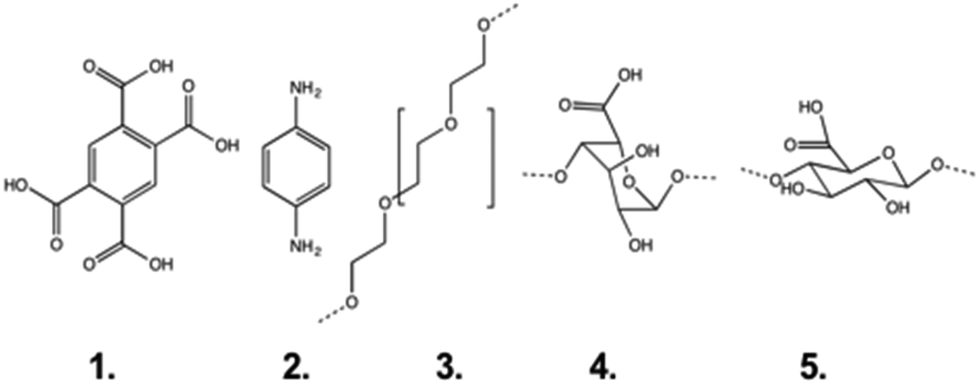 | ||
| Fig. 2 The monomers used as stations in this study: pyromellitic acid (1), aminoaniline (2), (poly)ethylene glycol (3), guluronic acid (4) and mannuronic acid (5). | ||
Fig. 3 shows examples of force curves, the dynamic force spectrum and histogram of forces for each dataset, while the values of equilibrium force feq and free energy of sliding ΔGsl for the interactions studied are presented in Table 1. The equilibrium forces for sliding over the stations ranged from 29 to 98 pN and are always larger for the α-CD interaction than for the β-CD interaction. They occupy a comparable range to that predicted and observed for single molecule ligand–receptor unbinding events24 and intercalation into DNA.28 Correspondingly, the energies calculated for the sliding interactions (ΔGsl) are found to range from 20 to 160 kJ mol−1; equivalent to between approximately 1 and 8 hydrogen bonds (free energy of hydrogen bond in water = 23.3 kJ mol−1).29,30 In subsequent analyses presented below we use the free energy of sliding ΔGsl rather than equilibrium force feq since the latter quantity is dependent on the spring constant of the particular cantilever used,24 making direct comparison of values obtained with different cantilevers more difficult. ΔGsl is calculated from the value of feq and the spring constant of the cantilever used and is therefore directly comparable across different experiments. However, direct comparison with literature data can only be made when the spring constants of the cantilevers used for each specific data set are reported. As an example, the range of magnitudes of the forces observed in the present study is consistent with those found for the unbinding of host–guest complexes between β-CD and a range of aromatic groups,31,32 although when the equilibrium forces and spring constants reported in the first of those works are used to calculate ΔGbu by Friddle and Noy's method the values range between 13 and 87 kJ mol−1 (see ESI†). The discrepancy in values of ΔGbu calculated from the data in ref. 31 and the ΔGsl values obtained in the present work highlights the distinction between the dissociation of equilibrated host–guest complexes and the forced sliding of the host cyclodextrin ring over the guest monomers.
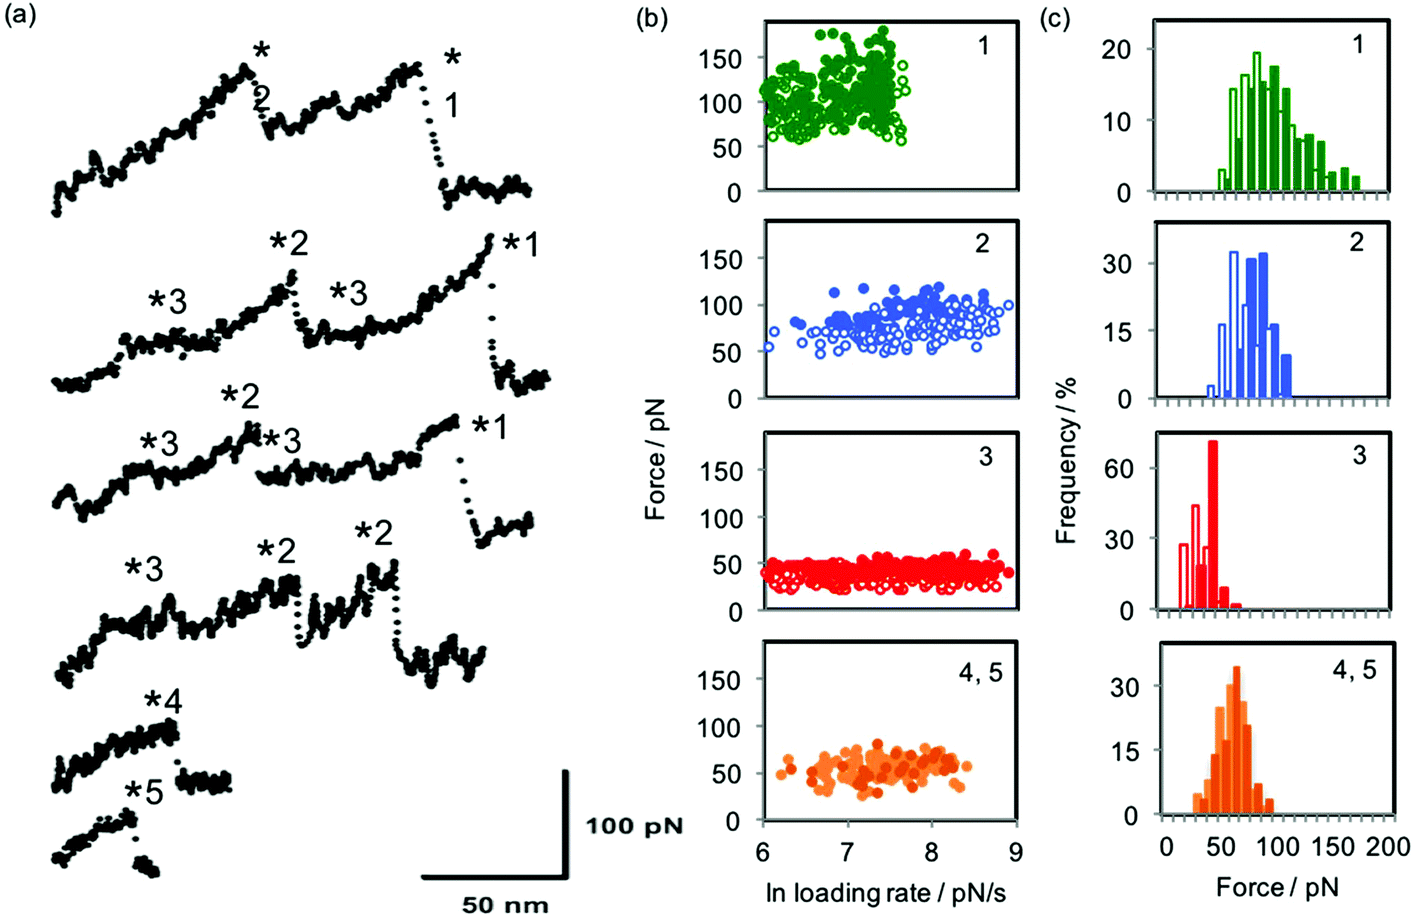 | ||
| Fig. 3 (a) Example force curves for the interactions investigated here: from the bottom, the first two curves were collected when sliding α-CD over oligoguluronic and mannuronic acids (stations 4 and 5); the remaining curves were collected when (top two curves) α-CD and (middle two curves) β-CD were pulled over a polymer consisting of PEG (station 3) and individual monomers of aminoaniline (station 2) and pyromellitic acid (station 1). Asterisks mark the rupture points at which forces and loading rates are measured. For more details of the polymer characterisation see ref. 1. (b) Dynamic force spectra for the interactions of α-CD (filled circles) and β-CD (open circles) with each of the five stations. For stations 4 and 5, all data is for α-CD; lighter symbols are for guluronic acid and darker symbols for mannuronic acid. (c) Histograms of the most probable sliding force, equivalent to feq, the equilibrium force, for the five stations. Colours of bars follow those described for symbols in part (b). | ||
![[thin space (1/6-em)]](https://www.rsc.org/images/entities/char_2009.gif) K, the binding constant; feq, the equilibrium force; kc, the cantilever spring constant; and ΔGsl, the free energy of sliding) for interactions of stations 1 to 5 with α- and β-CD
K, the binding constant; feq, the equilibrium force; kc, the cantilever spring constant; and ΔGsl, the free energy of sliding) for interactions of stations 1 to 5 with α- and β-CD
| Station | Bead | LogK, literature values |
LogK, UV valuesa |
f eq ± sd (pN) | k c (pN nm−1) | ΔGsl ± sd (kJ mol−1) |
|---|---|---|---|---|---|---|
|
a Values for K were calculated from UV measurements using the Benesi–Hildebrand method.
b For stations 4 and 5, the value of K is the mean of values for several pyranoses. Details of method for the calculation of logK are available in ESI.
|
||||||
| 1 | α-CD | — | 1.4 | 98 ± 8 | 25 | 159 ± 17 |
| β-CD | — | 2.81 | 86 ± 12 | 22 | 134 ± 26 | |
| 2 | α-CD | 1.41 [ref. 23] | 1.47 | 76 ± 6 | 25 | 95 ± 13 |
| β-CD | 2.05 [ref. 23] | 1.74 | 63 ± 6 | 22 | 72 ± 14 | |
| 3 | α-CD | 2.51–4.43 [ref. 24] | — | 29 ± 4; 37 ± 3 | 14; 25 | 22 ± 4; 23 ± 4 |
| β-CD | 3.03–3.17 [ref. 24] | — | 34 ± 5 | 22 | 21 ± 6 | |
| 4b | α-CD | 1.56 [ref. 25] | — | 45 ± 5 | 14 | 54 ± 12 |
| 5b | α-CD | 1.56 [ref. 25] | — | 46 ± 7 | 16 | 50 ± 15 |
Additional comparison can be made with the values predicted and observed for the sliding of a β-CD bead over single-stranded DNA: Lindsay and Williams23 predicted that the force required to drive a β-CD bead along a single strand of DNA was 75–78 pN (corresponding to 31–33 kJ mol−1 using the F–N–Y relation between feq and ΔGbu and a reported spring constant of 0.3 N m−1, see Table S2 in ESI†), depending on whether the base passed over was a purine or a pyrimidine. Therefore, no distinguishing force signature between purine and pyrimidine nucleotides would be detected above instrumental noise (∼15 pN or more). These authors proposed that this rather low value was due to the mobility of the bases around their point of attachment to the (deoxy)ribose backbone, allowing them to fold flat against the phosphate-deoxyribose backbone to pass through the CD pore. The same group subsequently published experimental data10 showing force plateaus for the sliding of β-CD along DNA somewhat larger than this value, at approximately 125 pN. We report here most probable sliding forces of 63–98 pN for differently-substituted aromatic groups and 45–46 pN for a monosaccharide (passing through α-CD), at comparable or higher loading rates (instantaneous loading rates from 400 to 8000 pN s−1).
Relationship between complexation constant and sliding energy
We sought to discern the parameters that might be used to predict the sliding free energy for passing a CD bead over a particular monomer, and with the example of Auletta et al.31 in mind, started by considering whether the sliding of the CD over the monomer reflects the well-known host–guest (hereafter H–G) complexation interaction. Here the guest (monomer) forms a complex by penetrating into the pore of the host (CD). Using the data provided in that work, we calculated values of ΔGbu from the most probable rupture forces and spring constants reported, and find a positive dependence of ΔGbu on logK, where K is the binding constant for the H–G complex, derived from ΔG° as measured by Auletta et al. using ITC (Fig. 4a). We then compared values of the same binding constant K for each of the monomers used in the present work, (presented in Table 1, and derived from literature reports,33–36 and/or measured by a UV spectroscopic method, see ESI†), to ΔGsl, and find no clear relationship between ΔGsl and logK, as depicted in Fig. 4b. The lack of dependence observed in our SCFS data, in contrast to the clear relationship observable in Auletta et al.'s data, reflects the distinction between H–G complexation and forced threading of the CD over the monomer in SCFS: in H–G complexation the geometry that favours the lowest (kinetically accessible) energy state for the guest in the host may not involve complete inclusion of that guest in the host; while in SCFS the monomer is forced to pass through the CD pore, driving the complex through energetically unfavourable transition states that constitute the largest energy barriers to the passage of the monomer through the pore. This may be expected to be most relevant when the monomer is large and rigid, as would be the case for substituted aromatic groups. We sketch the differing mechanisms and resulting energy pathways in Fig. 4c. As an illustrative example, we consider that the ΔG° of rupturing the H–G complex between aniline and β-CD, when the aniline guest has adopted the most energetically favourable configuration, was measured to be 2.3 kcal mol−1 (9.6 kJ mol−1) by ITC (and ΔGbu calculated to be 12.7 kJ mol−1 using that work's data and applying the F–N–Y formalism; see Table S2 in ESI†), while we find a ΔGsl for sliding β-CD from a PEO chain over the very similar station p-aminoaniline and on to a subsequent PEO chain to be much higher at 72 kJ mol−1 (see Table 1). Thus, since the binding constants measured or calculated for H–G complexes will not necessarily reflect the main energy barrier to sliding the same CD host over the same monomer guest, we reject using H–G binding constants as a basis for predicting the expected sliding energy.
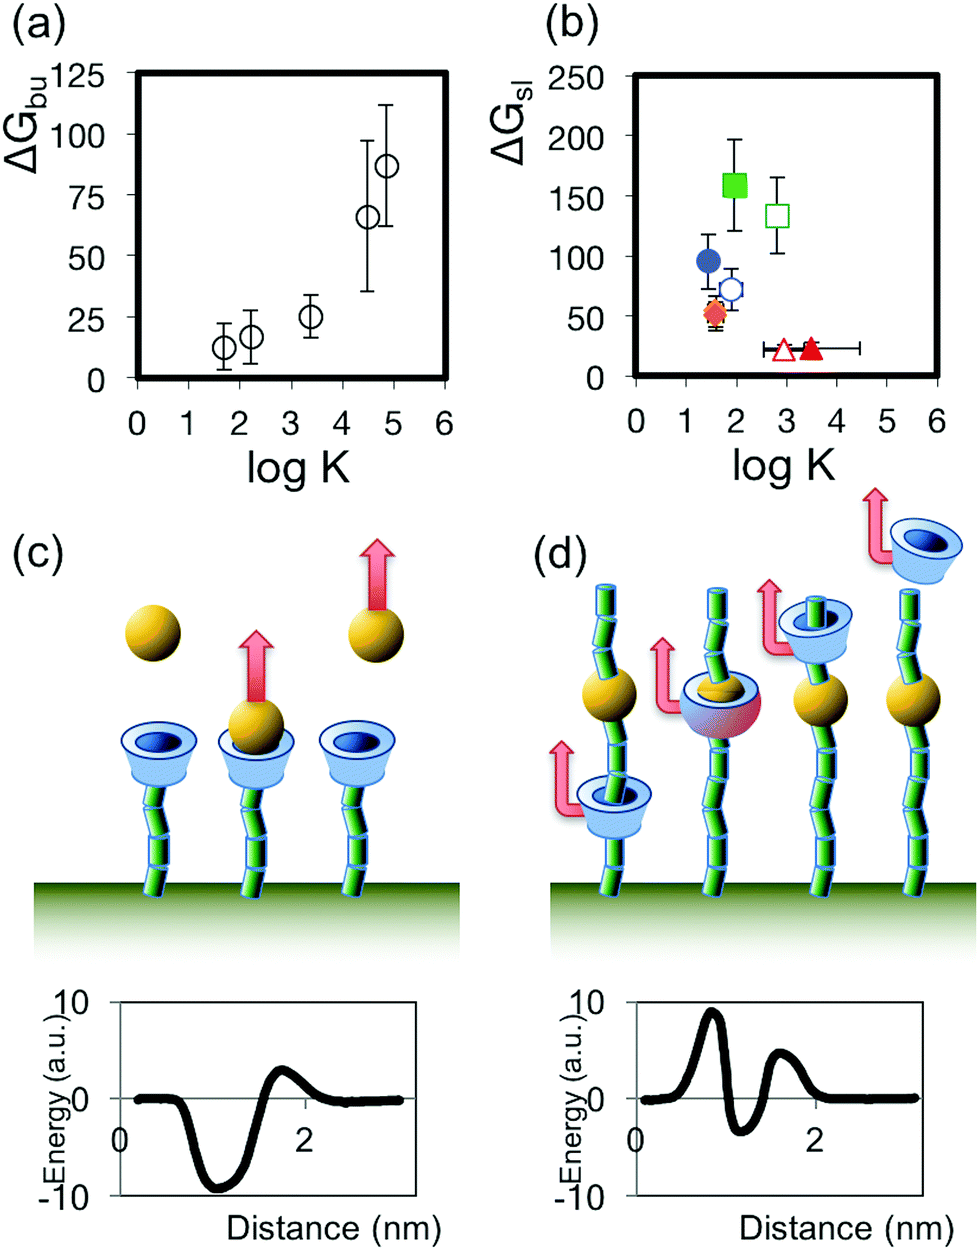 | ||
| Fig. 4 (a) Plot of the relationship between ΔGbu (calculated from the AFM data in ref. 31 using the Friddle–Noy method) and log K (derived from ITC measurements described in ref. 31) for the host–guest complexes interrogated by Auletta et al.31 (b) Plot of the relationship between ΔGsl and log K for the sliding contact experiments described in this work. (c,d) Illustrations of the unbinding processes and sketches of possible corresponding energy pathways for disrupting the H–G complex (c), where the depth of the energy well for the H–G complex binding is the principal energy barrier, and the sliding contact experiment (d), where other barriers to the passage of the guest may dominate. | ||
Contributions of solvation and friction to sliding force
We then proceed to consider a more general paradigm to account for the origins of this energy penalty to sliding along the polymer chain. Lulevich et al.,37 when interpreting the flat, plateau-like events they observed when they used AFM to pull single stranded DNA (ssDNA) out of the interior pore of a carbon nanotube, considered that the total work Wtot required to pull a polymer out of a pore requires the actor to overcome two principal barriers: Wfr, the work arising from the friction accompanying motion of the polymer in the pore, and Wadh, the work arising from the strength of the adhesive interaction between the polymer and the pore, so that Wtot = Wfr + Wadh. The first barrier, Wfr, denotes work done opposing relative motion between the polymer and the pore and may be expected to depend upon the ‘tightness of fit’ of the monomer in the pore, while a key component of Wadh is the difference between the solvation energies of the polymer with the pore interior and with the exterior solvent – a hydrophobic molecule will experience the interior of the CD pore as a more favourable environment than the aqueous bulk phase. Both Lulevich37 and, more recently, Nelson et al.,18 have found the sliding of ssDNA within nanopores to be frictionless, although in both cases the pores they investigated (between 1 and 3 nm diameter) were significantly larger than the pore of a cyclodextrin (0.5–0.6 nm diameter for α- and β-CD). The phenomenon of solvation as a barrier to polymer unfolding has been observed previously in SMFS experiments as the Raleigh Instability, resulting on the observation of plateaus as individual polymers are pulled out of the globular conformation they adopt in a poor solvent.38 We applied this approach to our data.In order to estimate the contributions of friction and solvation to the overall energy of passing a particular monomer through the CD pore, we looked for measured or calculable parameters that reflect these two contributions. As already described, the friction component will depend in some part upon the ‘tightness of fit’ of the monomer inside the CD pore, so the ratio of cross-sectional areas of the monomer and the CD pore, called the dimensionless space-filling parameter Φ19 (calculated using the cross-sectional areas of the monomers39 and the cross-sectional area of the interior pore of the bead) and already shown to have predictive power in estimating the stability constants of host–guest complexes where CDs are the host,19,40 may be considered as a proxy for the friction component. Complexation has been observed to occur between guests and cyclodextrin hosts where values of Φ have varied between 0.9 and 1.2.19 A value of Φ greater than 1 implies that the guest is larger than the host cavity, but structural motions of the guest and host, including opening out of the α-(1 → 4) C–O–C bond between neighbouring glucose units in cyclodextrin, allow the host to accommodate larger guests. The introduction of a driving force in the form of an AFM probe may be expected to drive the accommodation and passage of even larger guests at the cost of frictional energy, and indeed the passage of single stranded DNA through β-CD, for which Φ > 3.3, has been experimentally observed.10 The calculation of Φ for stations 1 to 5 is presented in ESI,† and ranges from 0.6 to 3 (Table S3†). Likewise, the solvation component reflects the passage of the monomer from an aqueous environment, into the hydrophobic interior of the CD pore, and then back out into the aqueous phase again, so that P, the dimensionless octanol:water partition coefficient commonly used (in its log form) as a measure of hydrophobicity in drug design, can be used to describe the relative favourability of these two environments for a particular monomer. Values of logP for stations 1–5 are in the range −3.3 to 0.6, corresponding to values of P between 0 and 4.
We then looked for correlations between ΔGsl, Φ and P, as shown by Fig. S8 in ESI.† Taken in isolation, Φ does not show a straightforward relationship with ΔGsl, likely due to the anomalously low values of ΔGsl for the two uronic acids, while there is a clear linear dependence of ΔGsl on P (R2 = 0.90). When we look at the dependence of ΔGsl on the sum Φ + P, we find that all datapoints collapse onto a straight line. Using the method of least squares, we can therefore equate the two eqn (1) and (2):
| ΔGsl = Wfr + Wadh | (1) |
| ΔGsl = k(Φ + P) | (2) |
| ΔGsl = kΦΦ + kPP | (3) |
This analysis produces values of 19.8 (SE = 1.4) and 25.6 (SE = 1.2) kJ mol−1 for kΦ and kP respectively. Fig. 5 shows the very close correspondence between the value of ΔGsl measured by SCFS (ΔGsl(meas)) for the series of stations passing through α- and β-CD and the value calculated from kΦ × Φ + kP × P, (ΔGsl(calc)). The data used to construct this relation encompasses large and small monomers that are hydrophilic or mildly hydrophobic (max. logP = 0.6). For small, hydrophobic monomers such as ethylene, or for the guest molecules investigated by Auletta et al.31 the relation predicts very high energies (more than 500 kJ mol−1) due to the dependence on P rather than logP, so clearly our empirical model is applicable over a limited range. Replicating the above analysis, replacing the dependence on P with a dependence on logP, yields values of 52.9 kJ mol−1 for kΦ and 28.4 kJ mol−1 for klog P, which still corresponds reasonably well to ΔGsl(meas) but does predict negative energies in some cases, while providing more likely values of ΔGsl(calc) for hydrophobic monomers. Nevertheless, other monomers that fall within the model's applicable range include those constituting many important linear and short-branched heteropolymers (essentially all monosaccharides, amino acids, nucleic acids and biocompatible polyhydroxyalkanoates), some of which are not amenable to conventional sequencing methods.
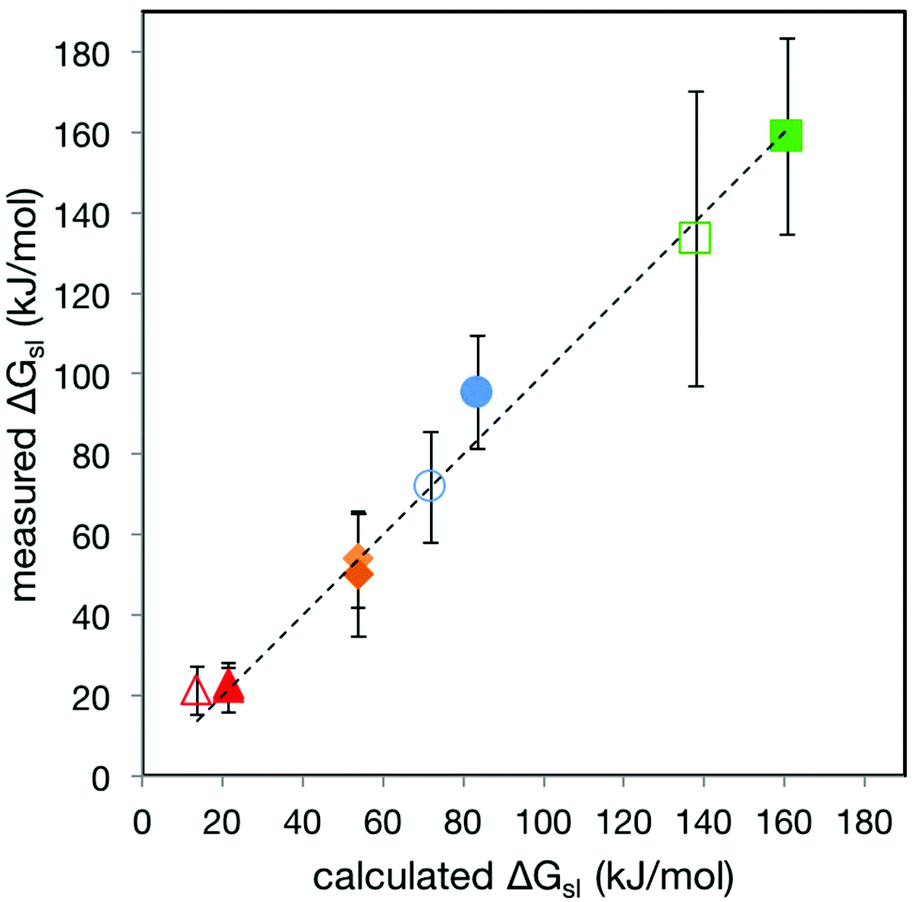 | ||
| Fig. 5 Plot of ΔGsl(meas)vs. ΔGsl(calc) for stations 1–5 passing through α- and β-CD. The dashed line is the fit to the line y = x. The colours of the datapoints follow the pattern used in Fig. 3. Error bars are 2 × SD of the ΔGsl(meas) data, encompassing 95% of data assuming normal distribution. | ||
Towards single molecule polymer sequencing
The very clear predictive equation described above ΔGsl = kΦ × Φ + kP × P allows us to consider whether this approach may serve as an alternative, or a first, mapping or sequencing tool for epigenetic modifications of nucleic acids, post-translational modifications of proteins and sidechain patterns in linear glycans. Table S4 in ESI† lists the values of P, Φ, ΔGsl and feq for the four DNA nucleotides, several biocompatible polyhydroxyalkanoates, the 24 standard amino acids and some common post-translational modifications, including phosphorylation of serine, threonine and tyrosine, N-glycosylation of asparagine, O-glycosylation of serine and threonine and methylation of DNA. A check on the applicability of the method may be made by comparing the value of ΔGsl it predicts for ssDNA with the simulated and measured values found by Lindsay and Williams.10,23 Using calculated values of Φ and P we find predicted values of ΔGsl for the four nucleotides and β-CD to fall between 67 and 76 kJ mol−1. This is rather larger than the values of ΔGsl calculated using the simulated forces and spring constants reported by Lindsay and Williams10,23 (31–33 kJ mol−1), but as noted above, the experimental data for the sliding of β-CD along ssDNA published subsequently10 shows force plateaus of approximately 110 pN, corresponding to a ΔGsl of 67 kJ mol−1 which agrees with our prediction. Nelson et al.18 observed two classes of behaviour for ssDNA sliding in nanopores with dimensions from 1–2 nm: so-called “frictionless” and “stick-slip”. These behaviours were associated with forces of either 12–13 pN or 40–80 pN respectively. Comparison to our predicted ΔGsl values is complicated because calibrated cantilever spring constants for particular measurements are not reported, but for ssDNA the value of Φ falls from 3.51 to 0.38 as the pore diameter increases from 0.6 (β-CD) to 2 nm. Accordingly, the predicted force value we obtain for sliding ssDNA through a 2 nm pore using a probe with a spring constant of 5 pN nm−1 (within the range quoted by Nelson et al.18) is 11 pN. Notwithstanding the difference in magnitude of the forces, the similarity of the values for the four nucleotides reflects the failure of the method to detect differences between nucleotides on the basis of their sliding forces. Both the smaller energy barrier in the simulation and the lack of differentiation between bases reflect the mobility of the base in the nucleotide, allowing it to fold close to the deoxyribophosphate backbone to pass through the CD pore presenting a much smaller cross-sectional area. Similarly, although the difference in predicted ΔGsl between glycine and tryptophan, for example, is large (35 vs. 139 kJ mol−1), the differences between many amino acids are too small to resolve above thermal noise, and the same is true for methylation of nucleic acids. On the other hand, we have recently shown that the difference in force between sliding α-CD along a single alginate chain and using it to unzip a cross-linked junction zone between two such chains is between 68 and 87 pN, corresponding to 125 kJ mol−1.9 Thus, assuming reasonable cantilever spring constants (20–100 pN nm−1) and allowing for variation around the value of feq due to thermal noise of 15 pN (this value also reflects ⋝2 × SD for all the interactions studied here except for 1: β-CD (see Table 1), so assuming a normal distribution of the force values this range will encompass ⋝95% of events), we predict on the basis of Table S4† that SCFS will detect N- and O-glycosylation of amino acids and glycans. Fig. S9† summarises the key results of Table S4† and shows predicted force values for short amino acid and glycan sequences highlighting the differences in predicted force signals for native and modified (phosphorylated and N- and O-glycosylated) amino acid sequences in sections of the MUC-1 protein and the monosaccharide decoration of a plant cell wall hemicellulose. In the experimental examples considered in the present work, different stations were addressed in individual polymers or separated by long PEG spacers. We have recently published evidence that consecutive stations can be distinguished in space from each other.9Examples where this new approach may yield new information include the study of micro- and macroheterogeneity in protein glycosylation41 and the pattern of monosaccharide decoration in polysaccharides, including hemicelluloses whose structure helps determine plant cell wall recalcitrance in bioenergy applications.42,43 In both cases, the current state of the art method of analysis is mass spectrometry (MS). SCFS offers advantages over MS methods where the elucidation of sequence patterns over large distances is required. Therefore, SCFS offers the prospect of an alternative route to mapping critical post-translational modifications of proteins and a first method for mapping the pattern of sidechains in linear glycans that can be easily implemented in any standard AFM.
Experimental
Cyclodextrin functionalisation
α- and β-cyclodextrins were modified with a bisamine-terminated PPG–PEG–PPG tether as described previously.1 Briefly, aldehyde groups were created on the cyclodextrins by treatment with Dess–Martin periodinane and bis(2-aminopropyl) polypropylene oxide-polyethylene oxide block copolymer was coupled to the aldehyde in a Schiff base reaction.Polymer conjugation, pseudorotaxane formation and surface functionalisation of stations 1–3
The polymers including stations 1, 2 and 3 that were investigated experimentally in this work were prepared as described elsewhere.1 Briefly, aminoaniline was coupled to a formyl-terminated PEG400 polymer by reductive amination, and a thiol group introduced at the distal, hydroxyl-terminated end of the PEG for coupling to a gold substrate.Samples for AFM were prepared by depositing aqueous solutions of the polymers and rotaxanes on template-stripped gold as follows: 0.4% w/w of each polymer was mixed with a 1:1 mole equivalent of amino-functionalized α- or β-CD for 24 hours, and deposited onto template-stripped gold from water for 24 hours.
AFM probes (MLCT silicon nitride from Veeco Instruments, Santa Barbara, CA, USA) with nominal spring constants of 10 and 20 pN nm−1 were prepared by coating under vacuum with 1 nm Cr and 10 nm Au (both from Goodfellow Corp., Berwyn, PA, USA) before incubation with 1 mM 11-11′-dithio-bis(succinimidyl undecanoate) in 1,4-dioxane for 10 minutes. Functionalised probes were used immediately or stored in an inert atmosphere.
Polymer conjugation, pseudorotaxane formation and surface functionalisation of stations 4 and 5
Alginate oligomers (stations 4 and 5) were fractionated from partially hydrolysed polyG by size exclusion chromatography and freeze dried as previously described.44 Size was assessed with HPAEC-PAD and compositional purity F(G) and degree of polymerisation (DP(n)) were calculated according to both of the methods described in a previous work45 from 1H NMR spectra recorded on a Bruker Avance 400 MHz spectrometer.46,47 HPAEC PAD chromatograms and NMR spectra of the oligoGs were presented previously.48 Guluronic acid fractions with n = 6 and n = 16–18, and a mannuronic acid fraction with n = 10 were selected for conjugation to short PEG polymers using a reducing-end-selective method49 previously shown to link polysaccharides to AFM probes and substrates.50 For this conjugation, 0.5 mL of 5 M NaBH3CN (5.0 M solution of sodium cyanoborohydride in aqueous 1 M sodium hydroxide, Sigma-Aldrich), 0.1 mL of 0.5 mM oligosaccharide, 0.25 mL of 0.5 mM amino-PEG-Boc (3000 Da; polydispersity index 1.03) and 1.5 mL of MQ-water were mixed and incubated for 48–144 h. Gel Permeation Chromatography shows that the conjugate has a mass of ∼3600 Da, close to the expected mass of ∼4200 Da (for details of this analysis see ESI†). Prior to conjugation to the substrate surface tert-butoxycarbonyl (Boc) deprotection was carried out in a 50% TFA solution for 2 h on ice to limit acid hydrolysis.Samples for AFM were prepared by an alternative method to that used for stations 1–3: freshly-cleaved mica was functionalised with 3-mercaptopropyl triethoxysilane (MTS) (Sigma-Aldrich) from a 2% solution in acetone (200 μL, 20 min, washed 5× water). To crosslink the amine-terminated PEG-alginate polymer to the thiol-terminated substrate, a short PEG spacer with maleimide and succinimide end groups (SM(PEG)12, Thermo Fisher Scientific) was used (100 μL of 1:300 dilution in water deposited on to thiol-functionalised mica for 2 h at RT or overnight at 4 °C).
AFM probes for the alginate-pseudorotaxane experiments (MLCT silicon nitride from Veeco Instruments, Santa Barbara, CA, USA) with nominal spring constants of 10 and 20 pN nm−1 were silanised with thiol-terminated alkylsilane and then further functionalised with (α-maleimido-ω-N-hydroxysuccinimide)-propylene glycol as described above. Both probe treatments resulted in probes functionalized with succinimidyl groups for in situ reaction with the amine groups on the cyclodextrins and gave comparable success rates.
AFM force spectroscopy experiments
Force spectroscopy experiments were carried out using a Multimode AFM with Nanoscope IIIa or V controllers (Veeco Instruments, Santa Barbara, CA, USA) and a JPK Nanowizard III (JPK, Berlin, Germany) in water. The spring constants, calibrated using the thermal tune principle,51 ranged from 13.3 to 25.1 pN nm−1. The force–distance data were recorded in contact mode, using a setpoint of 0.6 nN and a relative setpoint of 0.2 nN. The z-length varied between 150 nm and 1000 nm and the approach speed was set at 0.5 microns per second. For the dynamic force spectroscopy study, retraction speeds were varied from 100 to 500 nm s−1, and the resolution adjusted as required. Force spectra were collected in arrays of 100 × 100 data points over areas of 10 × 10 microns. Force spectra were exported and analysed using JPK's data processing software (JPK instruments, DE, ver. 4.2.23). Observed events were fitted with an extended freely-jointed chain model and the compiled data was analysed using OriginPro™ (OriginLab, ver. 8.0724).Calculation of log![[thin space (1/6-em)]](https://www.rsc.org/images/entities/h3_char_2009.gif) P
P
Chemicalize was used to calculate logP for each of the stations used in this work, April, 2017, https://chemicalize.com/ developed by ChemAxon (http://www.chemaxon.com).
Conclusions
We have assessed the utility of a novel iteration of AFM-based single molecule force spectroscopy, here called sliding contact force spectroscopy (SCFS), as a polymer sequencing tool. Carrying out SCFS experiments with α- and β-cyclodextrins and with polymers incorporating monomers ranging from substituted aromatic groups to saccharides and polyethylene glycol, we find that the free energy of sliding a cyclodextrin ring over a monomer unit within the polymer under the control of the AFM probe (ΔGsl) does not scale with the binding constant of the corresponding host:guest complex. Instead ΔGsl is proportional to the sum of the values of two dimensionless, easily calculable quantities: the octanol:water partition coefficient P and the space-filling parameter Φ, according to the equation ΔGsl = kΦ × Φ + kP × P, where kΦ = 19.8 kJ mol−1 and kP = 25.6 kJ mol−1. Based on these results, we conclude that SCFS will detect the existence and position of branch points in glycans and glycosylated proteins and that it therefore represents a new tool to map patterns of heterogeneous branching and post-translational modifications over long sequences in glycans and proteins.
Conflicts of interest
The authors declare no competing interests.Acknowledgements
The authors acknowledge support from BBSRC [grant no. H019294 (KB, ANR)] and EPSRC (AD, ANR). We are grateful to Andrew Mayes of the School of Chemistry, UEA for his assistance with the GPC experiments.References
- A. Varki, Glycobiology, 2017, 27, 3–49 CrossRef PubMed.
- O. Nørregaard Jensen, Curr. Opin. Chem. Biol., 2004, 8, 33–41 CrossRef PubMed.
- A. Hirano, Y.-H. Fu and L. J. Ptáček, Nat. Struct. Mol. Biol., 2016, 23, 1053–1060 CAS.
- M. J. Booth, E.-A. Raiber and S. Balasubramanian, Chem. Rev., 2015, 115(6), 2240 CrossRef CAS PubMed.
- F. A. Leibfarth, J. A. Johnson and T. F. Jamison, Proc. Natl. Acad. Sci. U. S. A., 2015, 112, 10617–10622 CrossRef CAS PubMed.
- J. C. Barnes, D. J. C. Ehrlich, A. X. Gao, F. A. Leibfarth, Y. Jiang, E. Zhou, T. F. Jamison and J. A. Johnson, Nat. Chem., 2015, 7, 810–815 CrossRef CAS PubMed.
- J.-F. Lutz, J.-M. Lehn, E. W. Meijer and K. Matyjaszewski, Nat. Rev. Mater., 2016, 1, 16024 CrossRef CAS.
- A. Dunlop, J. Wattoom, E. A. Hasan, T. Cosgrove and A. N. Round, Nanotechnology, 2008, 19, 345706 CrossRef PubMed.
- K. A. Bowman, O. A. Aarstad, B. T. Stokke, G. Skjåk-Braek and A. N. Round, Langmuir, 2016, 32, 12814–12822 CrossRef CAS PubMed.
- B. A. Ashcroft, Q. Spadola, S. Qamar, P. Zhang, G. Kada, R. Bension and S. M. Lindsay, Small, 2008, 4, 1468–1475 CrossRef CAS PubMed.
- A. Harada and M. Kamachi, Macromolecules, 1990, 23, 2821–2823 CrossRef CAS.
- C. Cheng and J. F. Stoddart, ChemPhysChem, 2016, 17, 1780–1793 CrossRef CAS PubMed.
- M. von Delius and D. A. Leigh, Chem. Soc. Rev., 2011, 40, 3656–3676 RSC.
- P. Lussis, T. Svaldo-Lanero, A. Bertocco, C.-A. Fustin, D. A. Leigh and A.-S. Duwez, Nat. Nanotechnol., 2011, 6, 553–557 CrossRef CAS PubMed.
- M. Wanunu, Phys. Life Rev., 2012, 9, 125–158 CrossRef PubMed.
- A. H. Laszlo, I. M. Derrington, B. C. Ross, H. Brinkerhoff, A. Adey, I. C. Nova, J. M. Craig, K. W. Langford, J. M. Samson, R. Daza, K. Doering, J. Shendure and J. H. Gundlach, Nat. Biotechnol., 2014, 32, 829–833 CrossRef CAS PubMed.
- G. Baaken, I. Halimeh, L. Bacri, J. Pelta, A. Oukhaled and J. C. Behrends, ACS Nano, 2015, 9, 6443–6449 CrossRef CAS PubMed.
- E. M. Nelson, H. Li and G. Timp, ACS Nano, 2014, 8, 5484–5493 CrossRef CAS PubMed.
- G. Wenz, B. Han and A. Muller, Chem. Rev., 2006, 106, 782–817 CrossRef CAS PubMed.
- H. Shigekawa, K. Miyake, J. Sumaoka, A. Harada and M. Komiyama, J. Am. Chem. Soc., 2000, 122, 5411–5412 CrossRef CAS.
- B. Brough, B. H. Northrop, J. J. Schmidt, H.-R. Tseng, K. N. Houk, J. F. Stoddart and C.-M. Ho, Proc. Natl. Acad. Sci. U. S. A., 2006, 103, 8583–8588 CrossRef CAS PubMed.
- N. K. Voulgarakis, A. Redondo, A. R. Bishop and K. O. Rasmussen, Nano Lett., 2006, 6, 1483–1486 CrossRef CAS PubMed.
- S. Qamar, P. M. Williams and S. M. Lindsay, Biophys. J., 2008, 94, 1233–1240 CrossRef CAS PubMed.
- R. W. Friddle, A. Noy and J. J. De Yoreo, Proc. Natl. Acad. Sci. U. S. A., 2012, 109, 13573–13578 CrossRef CAS PubMed.
- A. Noy and R. W. Friddle, Methods, 2013, 60, 142–150 CrossRef CAS PubMed.
- E. Evans, Faraday Discuss., 1999, 111, 1–16 RSC.
- S. Guo, N. Li, N. Lad, S. Desai and B. B. Akhremitchev, J. Phys. Chem. C, 2010, 114, 8755–8765 CAS.
- B. D. Rackham, L. A. Howell, A. N. Round and M. Searcey, Org. Biomol. Chem., 2013, 11, 8340–8347 CAS.
- S. J. Suresh and V. M. Naik, J. Chem. Phys., 2000, 113, 9727–9732 CrossRef CAS.
- I. F. Hakem, A. Boussaid, H. Benchouk-Taleb and M. R. Bockstaller, J. Chem. Phys., 2007, 127, 224106 CrossRef PubMed.
- T. Auletta, M. R. de Jong, A. Mulder, F. C. J. M. van Veggel, J. Huskens, D. N. Reinhoudt, S. Zou, S. Zapotoczny, H. Schonherr, G. J. Vancso and L. Kuipers, J. Am. Chem. Soc., 2004, 126, 1577–1584 CrossRef CAS PubMed.
- J. Blass, M. Albrecht, B. L. Bozna, G. Wenz and R. Bennewitz, Nanoscale, 2015, 7, 7674–7681 RSC.
- K. A. Connors, J. Pharm. Sci., 1995, 84, 843–848 CrossRef CAS PubMed.
- H. J. Buschmann and E. Schollmeyer, J. Incl. Phenom. Macro., 1997, 29, 167–174 CrossRef CAS.
- H. J. Buschmann, K. Jansen and E. Schollmeyer, J. Incl. Phenom. Macro., 2000, 37, 231–236 CrossRef CAS.
- A. F. D. de Namor, P. M. Blackett, M. C. Cabaleiro and J. M. A. Al Rawi, J. Chem. Soc., Faraday Trans., 1994, 90, 845 RSC.
- V. Lulevich, S. Kim, C. P. Grigoropoulos and A. Noy, Nano Lett., 2011, 11, 1171–1176 CrossRef CAS PubMed.
- A. Scherer, C. Zhou, J. Michaelis, C. Brauchle and A. Zumbusch, Macromolecules, 2005, 38, 9821–9825 CrossRef CAS.
- V. Privalko, Macromolecules, 1980, 13, 370–372 CrossRef CAS.
- A. Müller and G. Wenz, Chemistry, 2007, 13, 2218–2223 CrossRef PubMed.
- K. Mariño, J. Bones, J. J. Kattla and P. M. Rudd, Nat. Chem. Biol., 2010, 6, 713–723 CrossRef PubMed.
- M. Busse-Wicher, N. J. Grantham, J. J. Lyczakowski, N. Nikolovski and P. Dupree, Biochem. Soc. Trans., 2016, 44, 74–78 CrossRef CAS PubMed.
- S. M. Cragg, G. T. Beckham, N. C. Bruce, T. D. Bugg, D. L. Distel, P. Dupree, A. G. Etxabe, B. S. Goodell, J. Jellison, J. E. McGeehan, S. J. McQueen-Mason, K. Schnorr, P. H. Walton, J. E. Watts and M. Zimmer, Curr. Opin. Chem. Biol., 2015, 29, 108–119 CrossRef CAS PubMed.
- S. Ballance, S. Holtan, O. A. Aarstad, P. Sikorski, G. Skjåk-Braek and B. E. Christensen, J. Chromatogr., A, 2005, 1093, 59–68 CrossRef CAS PubMed.
- H. Grasdalen, B. Larsen and O. Smidsrød, Carbohydr. Res., 1979, 68, 23–31 CrossRef CAS.
- C. Campa, S. Holtan, N. Nilsen, T. M. Bjerkan, B. T. Stokke and G. Skjåk-Braek, Biochem. J., 2004, 381, 155–164 CrossRef CAS PubMed.
- C. Campa, A. Oust, G. Skjåk-Braek, B. S. Paulsen, S. Paoletti, B. E. Christensen and S. Ballance, J. Chromatogr., A, 2004, 1026, 271–281 CrossRef CAS PubMed.
- K. A. Bowman, O. A. Aarstad, M. Nakamura, B. T. Stokke, G. Skjåk-Braek and A. N. Round, Carbohydr. Polym., 2016, 148, 52–60 CrossRef CAS PubMed.
- G. Gray, Methods Enzymol., 1978, 50, 155–160 CAS.
- M. Takemasa, M. Sletmoen and B. T. Stokke, Langmuir, 2009, 25, 10174–10182 CrossRef CAS PubMed.
- J. L. Hutter and J. Bechhoefer, Rev. Sci. Instrum., 1993, 64, 1868–1873 CrossRef CAS.
Footnote |
| † Electronic supplementary information (ESI) available: Details and results of SMFS data selection and analysis; UV data and method; calculation of Φ; table of predicted values of ΔGsl; experimental method and results of gel permeation chromatography of the PEG-uronic acid conjugate. See DOI: 10.1039/c7nr03358c |
| This journal is © The Royal Society of Chemistry 2017 |