
 Open Access Article
 This Open Access Article is licensed under a Creative Commons Attribution-Non Commercial 3.0 Unported Licence
Detecting patchy nanoparticle assembly at the single-particle level†
S.
Pothorszky
,
D.
Zámbó
,
D.
Szekrényes
,
Z.
Hajnal
 and
A.
Deák
*
and
A.
Deák
*
Institute of Technical Physics and Materials Science, HAS Centre for Energy Research, 1121 Budapest, Konkoly-Thege M. str. 29-33, Hungary. E-mail: andras.deak@energia.mta.hu
First published on 4th July 2017
Abstract
Patchy colloidal particles offer a unique platform to explore and investigate spatially inhomogeneous colloidal interactions. In the present work we provide direct, in situ experimental observation at the single particle level on the colloidal interaction driven formation of a heterodimer, consisting of a patchy nanorod and a sphere. The gold nanorods employed during the experiments feature positively charged tip regions, while the side of the rods is covered by surface grafted PEG. The driving force of the assembly is the electric double layer interaction between the nanorod and the nanosphere possessing opposite surface charge. The great advantage of using gold heterodimers is that their optical scattering spectrum characteristics are known to be very sensitive to the actual structure of the assembly due to plasmon hybridization. This was exploited to determine the structure of the heterodimer in situ upon formation in aqueous medium. The results indicate, that despite the attractive patches being located at the nanorod tips, for the given particle pairs the spheres readily bind to the side region of the nanorods in the aqueous medium during the assembly. Finite element simulations of the electric double layer interaction reveal that this is the energetically favorable configuration for the given heterodimer. This work demonstrates the potential of in situ experiments performed at single particle level for the characterization of self-assembling structures, which can contribute to the development of rationally designed nanoscale building blocks.
Introduction
Colloidal interactions between nanoparticles are often a key factor determining their potential for advanced applications.1–4 From this perspective, patchy colloids are especially interesting, since they allow the development of a spatially inhomogeneous interaction profile, and depending on the number and arrangement of the patches, the valence and directionality of the interaction can be controlled.5 These patchy colloids are not only interesting as colloidal molecules, but also due to their readiness for spontaneous or directed cluster formation.6–8Noble metal nanoparticles represent an ideal class of model system for these efforts. Well established synthetic protocols can be used to prepare them in various shapes and their surface can be conveniently modified with thiol group containing molecules. More importantly, the intense scattering of the particles allows direct observation and spectral characterization at the single particle level, especially when the particle dimension exceeds ca. 40 nm.9 Near-field coupling between neighbouring particles at small interparticle separations results in hybridization of the plasmon modes, and associated changes in the scattering spectrum provide direct access to structural information,10 or one can even conclude on the interaction between the particles.11 Especially for heterodimers, where the coupled pair consist of particles with different sizes or shapes, hybridization of the individual particle plasmon modes may result in a scattering and absorption properties rich of new spectral feature, like Fano-resonances.12 In a heterodimer consisting of a gold nanorod and a sphere, a low-energy and high-energy scattering peak evolve around a dip in the scattering spectrum, corresponding to different hybridized plasmon modes.13 The energy and intensity of these modes depends heavily on the relative position of the rod and the sphere, the scattering spectra of individual heterodimers provide an excellent access to structural information. This property might be also utilized to gain insight into the self-assembly of rods and spheres in detail.
Assembly strategies concerning the controlled preparation of rod–sphere particle assemblies naturally rely on colloidal interactions. Earlier findings indicate that electric double layer, dispersion or induced dipole interaction might be used to obtain sphere–rod assembles.14 Recent results on patchy nanorod and sphere assembly suggest that the electric double layer interaction plays a central role. But depending on the absolute dimensions of the particles and the effective range of the interactions, different localization of the spheres on the nanorod (tip or side) could be observed.15 Investigations performed at the single particle level in the liquid medium during the assembly might elucidate how the spheres bind to the rods. In this regard, in situ liquid-cell based TEM is a very powerful tool to obtain direct visual information about the assembly and interaction of nanoparticles. This technique was successfully used recently to observe the repulsive interaction between plain gold nanorods16 and the assembly of nanorods in the presence of cysteamine.17 While traditional optical microscopy based single particle scattering spectroscopy has an inherently lower spatial resolution, it has been successfully used to reveal the interaction between DNA linked nanosphere homodimers.18
In the present work, the colloidal interaction governed formation of gold nanoparticle/nanorod heterodimers is investigated (Scheme 1). We rely on the unique optical properties of the heterodimers to obtain direct, in situ information on the structure of the assembly using single particle scattering spectroscopy combined with correlative electron microscopy investigations. Patchy nanorods are first immobilized on a substrate, and changes in the optical scattering spectrum of individual objects upon introducing nanospheres analysed. The main question investigated is how the final structure of the heterodimer evolves; whether the attachment of the sphere to the nanorod in a certain configuration can be detected in the aqueous phase already during assembly.
 | ||
| Scheme 1 Schematics of the prepared nanoparticles (left) and the measurement arrangement (right). The patchy nanorods are first immobilized on ITO covered substrates, then the aqueous nanosphere solution is introduced and changes in the scattered spectrum upon binding detected. | ||
Experimental
Nanoparticle synthesis and surface modification
Sodium citrate tribasic dihydrate (ACS reagent, ≥99.0%), cetyltrimethylammonium bromide (CTAB, 99%), sodium borohydride (NaBH4, 99%), L-ascorbic acid (AA, >99%), silver nitrate (AgNO3, >99%), cysteamine hydrochloride (>99%), sodium oleate (NaOl, ≥99%), hydrochloric acid (37%) and tetrachloroauric acid trihydrate (99.9%) were obtained from Sigma-Aldrich. Thiol-functionalized methoxy-polyethylene glycol (mPEG-SH; MW = 5000 Da) was supplied by RappPolymere GmbH. All chemicals were used as received. For all experiments, ultrapure water with a resistivity of 18.2 MΩ cm was used.Citrate-capped spherical gold nanoparticles with a diameter of 19 nm were prepared using the traditional Turkevich method.19 These particles were used as seeds for the preparation of larger diameter particles.20 The nanorods were prepared according to a seed-mediated protocol.21
The patchy nanorods were prepared based on earlier published methods.15,22 Briefly, cysteamine was added at different concentrations to the solution of nanorods containing 0.01 M CTAB. Successive PEGylation (5 mg ml−1 final mPEG-SH concentration) of the nanorods was employed to replace the remaining CTAB molecules in the side region of the nanorods. In addition to the spectroscopic measurements during ligand exchange, electrophoretic mobility measurement allowed to find the optimum conditions for the tip-selective ligand replacement. A fiber coupled UV-Vis spectrometer (Thorlabs CCS200) and a dynamic light scattering (Malvern Zetasizer NanoZS) instrument was used to characterize the as-prepared samples and to follow the surface modification reaction during patchy nanorod preparation.
Self-assembly and characterization
Self-assembly of the particles was carried out in a liquid chamber. The patchy nanoparticles were spin-coated (1250 rpm, 20 s) on pre-cleaned (sonication for 10 min each: acetone, isopropanol, water; plasma treatment for 5 min; drying in nitrogen flow), ITO coated glass slides. This particle-covered substrate was used as the bottom plate, a spacer (Parafilm) and a standard 0.1 microscope cover slide were used to complete the liquid chamber.The chamber was mounted on the microscope stage of an upright optical microscope (Olympus BX51) equipped with an oil-immersion dark-field condenser. The stage was set to an area displaying well separated individual scatterer. The chamber was filled with ultrapure water first and the scattering spectrum of selected individual nanorods measured using an imaging spectrograph (Princeton Instruments Isoplane SCT320) equipped with a high sensitivity CCD detector (Princeton Instruments PIXIS:400BRX). For all spectral measurements 10 seconds exposure time was used. The flow cell was flushed 3 times with the solution containing the spherical particles. After 5 minutes, the cell was extensively flushed with water again until no free spheres undergoing Brownian motion could be observed, to remove unbound nanospheres hence avoiding non-specific interactions between the particles during drying of the sample. Dark-field scattering spectra of the same scatterer were obtained again. The ex situ SEM images were obtained after disassembly of the cell using a Zeiss LEO field emission scanning electron microscope operated at 5 keV acceleration voltage.
The electric double layer interaction was calculated by finite-element method, implementing the nonlinear Poisson–Boltzmann equation23 in COMSOL Multiphysics® 4.3a.24 In the simulation setup, the “Electrostatic” and “Transport of Diluted Species” modules were used to calculate the ion-distribution around the charged particle surfaces in the aqueous medium. For each given geometrical configuration (rod/sphere orientation and surface-to-surface distance), the coupled diffusion and electric field equations were iteratively solved to obtain the converged ion-density distributions corresponding to the equilibrium “double-layer” formation. Integration of the electric, entropic and osmotic terms over the entire simulation volume was carried out to obtain the total free enthalpy change due to proximity of the nanoparticles:23
 | (1) |
Results and discussion
Nanoparticle synthesis
Larger particles are preferred for the plasmon coupling related optical readout of the assembly at the single particle level, since the scattering cross-section scales with the square of particle volume.25 The prepared gold nanorods have an approximate aspect ratio of 2, with 115 ± 6 × 49 ± 2 nm dimension (ESI Fig. S1a†) and the spherical particles have a diameter of 54 ± 5 nm. The ensemble longitudinal and transversal resonance wavelength of the as-prepared gold nanorods were 686 and 529 nm, respectively, while the dipole mode of the spheres is at 530 nm (ESI Fig. S2†).When adding cysteamine to the as-prepared nanorods, a pronounced blueshift of the longitudinal plasmon peak can be observed (ESI Fig. S1b†). This can be attributed to the replacement of the initial CTAB ligands in the tip region of the rods.15 The extent of blueshift as a function of cysteamine concentration converges to ca. 12 nm in the investigated concentration range (up to 10 mM), indicating no further ligand replacement at the rod tips above ca. 0.1 mM. The electrophoretic mobility (measured after PEGylation) on the other hand, increases asymptotically due to the more pronounced replacement of the CTAB at the side of the nanorods (please note the logarithmic x-axis scaling in Fig. S1b†). To prepare cysteamine patches preferably at the tips of the nanorods, 0.1 mM cysteamine concentration was used. The spherical particles feature negative electrophoretic mobility of (−2.04 μm cm V−1 s−1) due to the citrate capping molecules.
In situ assembly experiments
The spin-coating of the nanorods resulted in a homogeneous distribution of the particles over the ITO substrate without significant crowding, at an average coverage of ca. 1 particle per μm2. The scattering spectrum of the ITO supported individual nanorods measured in the water filled chamber is dominated by the longitudinal plasmon mode around 680 nm. In Fig. 1 such a single rod spectrum is shown for reference together with the spectra of 3 randomly measured scatterer upon sphere addition (additional spectra in the ESI Fig. S6†). As the chamber is filled with nanospheres, a pronounced change in the scattering spectrum can be observed. A blueshifted higher (H) and a redshifted lower (L) energy peak appears at around the initial longitudinal plasmon peak of the rod. It has been shown earlier both experimentally and theoretically, that such spectral features are characteristic for heterodimers formed by a nanorod (79 × 42 nm) and a smaller (24 nm) sphere: unless the sphere is located exactly at the middle of the rod, hybridization of the rod and sphere plasmon modes results in the appearance of a lower and a higher energy peak surrounding the dip around the energy of the original longitudinal plasmon mode of the nanorod.13 Such dark-field scattering spectra were also obtained for heterodimers, where the rod had smaller dimensions (50 × 15 nm).26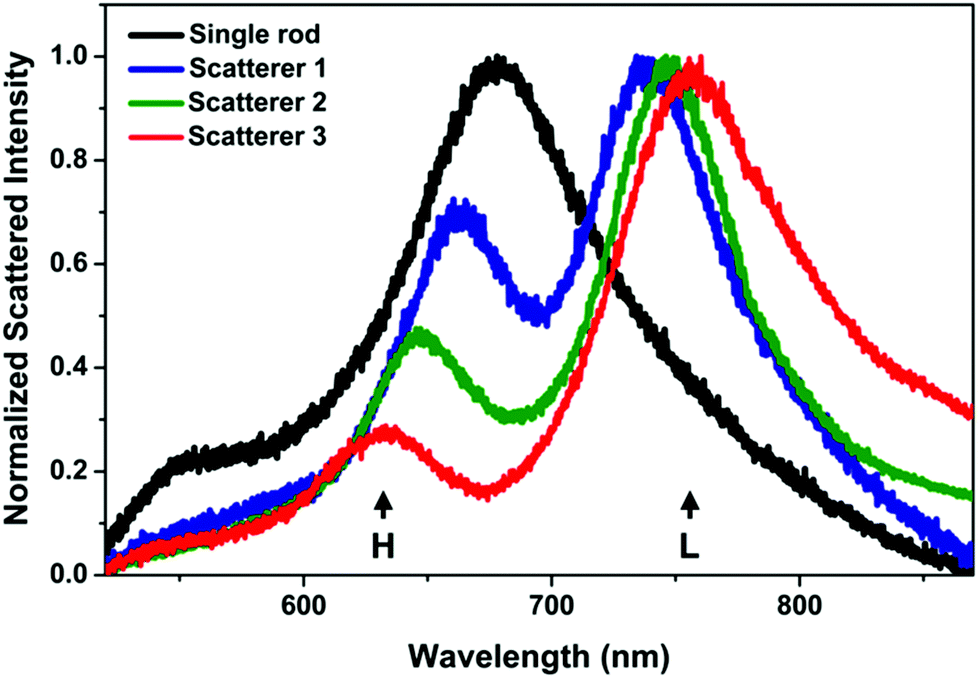 | ||
| Fig. 1 Typical scattering spectra measured in situ in the liquid cell. The appearance of the high (H) and low (L) energy peaks surrounding the dip indicate the formation of a heterodimer. The spectrum of a single nanorod before the assembly is shown for reference. | ||
While the basic characteristics of the different scatterer after nanosphere addition are identical, there is a variation in both the energy (wavelength) difference between the two peaks and their relative intensities. The larger the energy difference, the larger the intensity difference. Based on earlier optical simulations on such structures, this suggests that the observed variation is originating from the structural difference of the individual assemblies.13 During the in situ measurements, the difference of the peaks was below 120 nm and their ratio above 0.2. It should be noted that the prepared assemblies were found to be stable, that is no change in the in situ measured spectra was detected upon repeated measurement of the same object, not even after repeated excessive flushing of the liquid chamber with water.
Structural variation of the heterodimers
The ex situ SEM investigation confirms the affinity of the spheres to the rods and most of the nanorods accumulated a single sphere in their side region (Fig. 2a). To better quantify the heterodimer formation, 200 individual objects were examined by scanning randomly selected areas on the substrate. In general, the spherical particles are not precisely at the centre of the nanorod, rather they are shifted slightly towards the tip. The extent of this offset compared to the mid-plane of the rod was quantified by measuring the displacement of the sphere along the side of the rod (Fig. 2b). The measured displacement is normalized by the sum of the given particle radius and half of the rod length to account for the spheres and rod size distribution. Based on the obtained position distribution, the majority (65%, first 3 categories in Fig. 2b) of the spheres can be found within 20 nm from the rod centre. This also applies for the heterodimers, the spectra of which are shown in Fig. 1. Their SEM images (Fig. 2c, SEM micrograph outline same colour coding as the spectra in Fig. 1) indicate that the spheres are displaced along the rod perimeter with an increasing extent (see inset values). To clearly relate the scattering spectrum of the particle dimers to their structure, heterodimers displaying significantly different arrangement of the two particles were intentionally selected and their scattering spectra measured. In accordance with earlier findings, the energy difference between the low and high energy peaks (Fig. 3a) increases significantly as the nanosphere is located closer to the tip of the nanorod (Fig. 3b) and upon symmetry breaking, the two peaks are approximately of same intensity, but the higher energy peak intensity quickly decreases as the particle displacement increases.13 Hence this spectral property can be effectively used to probe the relative position of the two particles and also implies that there is a clear correlation between the ex situ observed structure of the heterodimers and the in situ measured scattering spectra: the structural differences shown in Fig. 2c are clearly manifested in their scattering spectra shown in Fig. 1 and the differences between the respective low and high energy peaks conform the trend shown in Fig. 3b. It must be emphasized, however, that the in situ microspectroscopic measurements carried out in the flow cell allow to distinguish between the different heterodimer arrangements only spectroscopically. | ||
| Fig. 2 (a) Typical assembly result, showing the formation of heterodimers. (b) Nanosphere position (relative displacement) distribution along the nanorod. For each measured object, the distance of the particle centre from the rod mid-plane (h) is normalized with the sum of the given particle radius (r) and half of the rod length (L/2). (c) SEM images of the heterodimers corresponding to the measured scatterer in Fig. 1. The numbers indicate their respective relative displacement, the colour outline of the SEM images corresponds to the colour coding of the spectra in Fig. 1. | ||
 | ||
| Fig. 3 (a) Ex situ scattering spectra of selected heterodimers measured after SEM imaging. (b) Difference between the hybridized low-energy (λL) and high-energy (λH) plasmon peak wavelengths for individual heterodimers as a function of relative sphere displacement. Colour coding of the scatter graph corresponds to the spectra in (a). | ||
Structure of the in situ formed heterodimer
The spectra shown in Fig. 1 indicate, that the heterodimer develops in the aqueous phase with the nanosphere located in the proximity of the rod side region and shifted toward the tip to different extents. This is supported by the appearance of the hybridized modes in the in situ measured spectra and the moderate (120 nm or less) difference between the low-energy and high-energy peak. The question arises on the other hand, if the attractive patches are located at the rod tips, why are most of the spheres assembling at the side of the rod already in the aqueous medium. It is important to pin down that the electric double layer interaction is the main driving force for the assembly. This is confirmed by experiments carried out at increased KCl concentrations (ESI Fig. S3†). As the salt concentration is gradually increased to 2.25 mM, 2 spheres start to bind to the same rod, then no assembly takes place and the spheres lose their stability (aggregation). This finding can be explained by the simultaneous reduction of effective range of both the repulsion between spheres and attraction between the rod tip and the sphere.15The double layer interaction not only triggers the heterodimer formation, but it also dictates the side assembly of the spheres. Even though the rod/sphere spacing might be larger at the side due to the presence of PEG, the double layer interaction energy associated with side assembly is significantly larger compared to the tip arrangement. Fig. 4 shows the difference between the calculated double layer interactions for the two extreme cases (side: ΔGEDL2 and tip: ΔGEDL1 selective approach of the sphere). When the surface-to-surface separation distance is below 20 nm, significantly larger attraction was obtained for the side arrangement.
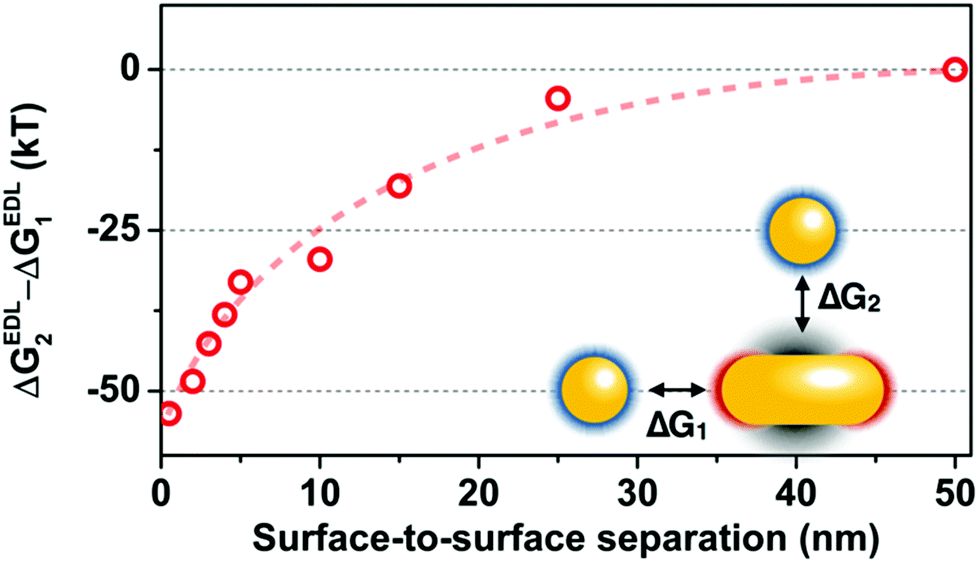 | ||
| Fig. 4 Difference between the electric double layer interaction energies calculated for the side (ΔGEDL2) and tip (ΔGEDL1) approach of the spherical particle. The dashed line is guideline. | ||
It has been reported earlier, that for significantly smaller heterodimers (rod and sphere diameter below 20 nm) and a single type of ligand on the rod surface, there is no significant difference in the particle-distribution along the nanorod due to the small variation in the electrical potential along the rod perimeter.27 Although earlier findings have shown that smaller spheres can accumulate at the tip of the rods according to the patchiness,15 the simulation data reveals the affinity for the side assembly in case of larger spheres. At the rod tips, the sphere can approach the rod closer due to the absence of PEG. But even at this smaller separation distance the side position is more preferred, and the particle might be forced to the side region. The above considerations, together with the absence of an abrupt boundary between the cysteamine and PEG covered areas might be the origin of the observed distribution in Fig. 2b.
In addition to the double layer, dispersion interaction also favours the side attachment of the sphere14 and can pin the particle to the rod. But the difference between the tip and side configurations is rather moderate compared to the contribution of the double layer interaction (ESI Fig. S4†).
Effect of drying
During drying of the sample, the particles might rearrange due to immersion type capillary forces.28 PEG dehydrates significantly29 at the typical laboratory relative humidity (32%) that might lead to chain collapse,30 although it might also promote adhesion of the sphere.31 Drying associated changes might be revealed by the optical spectra recorded after ambient drying of the samples. Although upon ambient drying the scattering spectra of the individual rod or spherical particles show significant blueshift in accordance with the decrease of the embedding medium dielectric constant (see ESI Fig. S5†), it is important to emphasize, that the spectral features of the heterodimers remain fairly the same (see ESI Fig. S6†). This also implies, that there is no significant transformation of the heterodimer structure; no excessive displacement of the sphere around the rod perimeter is indicated. The spectrum depends not only on the sphere position but also on the dielectric function of the embedding medium, the distance between the rod and the sphere, as well as on the exact shape and dimension of the particles. Hence, precise conclusion on the origin of the drying associated smaller spectral variations cannot be drawn. Based on earlier optical simulation results on similar structures, separation distance decrease is the most probable origin of the observed spectral change.13Conclusions
In this work, the in situ formation of heterodimers composed of a patchy gold nanorod and a spherical particle was investigated. In situ microspectroscopic experiments revealed the formation of heterodimers at the single-particle level. Although the patches are located at the rod tips, the results show that the heterodimer evolves in the aqueous phase with the sphere already attached to the side of the nanorod. The heterodimers were found to be stable in the aqueous phase and upon ambient drying as well. Ex situ electron microscopy confirms that the spheres are located at the side of the rods and reveal their position distribution. Most of the spheres are shifted by up to ca. 20% of the rod length towards the tip. The side-localization of the spheres and its distribution for the given rod/sphere heterodimer can be interpreted based on the combined effect of dispersion, electric double layer and steric interactions. The results can contribute to the rational design of nanoscale patchy particles for a better control over the resulting assembly structure.Conflict of interest
There are no conflicts of interest to declare.Acknowledgements
The project was supported by the Hungarian Scientific Research Fund NN-117847, K-112114, K-119532 and received funding from the Hungarian Academy of Sciences (INFRA 2016). S. P. and D. S. acknowledge the support of the Pro Progressio Foundation and József Varga Foundation.Notes and references
- K. Hayashi, M. Nakamura, H. Miki, S. Ozaki, M. Abe, T. Matsumoto and K. Ishimura, Chem. Commun., 2013, 49, 5334 RSC.
- M. Ibáñez, Z. Luo, A. Genç, L. Piveteau, S. Ortega, D. Cadavid, O. Dobrozhan, Y. Liu, M. Nachtegaal, M. Zebarjadi, J. Arbiol, M. V. Kovalenko and A. Cabot, Nat. Commun., 2016, 7, 10766 CrossRef PubMed.
- I. Haidar, G. Lévi, L. Mouton, J. Aubard, J. Grand, S. Lau-Truong, D. R. Neuville, N. Félidj and L. Boubekeur-Lecaque, Phys. Chem. Chem. Phys., 2016, 18, 32272–32280 RSC.
- Y. Tong, F. Ehrat, W. Vanderlinden, C. Cardenas-Daw, J. K. Stolarczyk, L. Polavarapu and A. S. Urban, ACS Nano, 2016, 10, 10936–10944 CrossRef CAS PubMed.
- Y. Wang, Y. Wang, D. R. Breed, V. N. Manoharan, L. Feng, A. D. Hollingsworth, M. Weck and D. J. Pine, Nature, 2012, 491, 51–55 CrossRef CAS PubMed.
- M. Grzelczak, A. Sánchez-Iglesias, H. H. Mezerji, S. Bals, J. Pérez-Juste and L. M. Liz-Marzán, Nano Lett., 2012, 12, 4380–4384 CrossRef CAS PubMed.
- E. Bianchi, C. N. Likos and G. Kahl, Nano Lett., 2014, 14, 3412–3418 CrossRef CAS PubMed.
- R. M. Choueiri, E. Galati, A. Klinkova, H. Thérien-Aubin and E. Kumacheva, Faraday Discuss., 2016, 191, 189–204 RSC.
- X. Lu, J. Wu, Q. Zhu, J. Zhao, Q. Wang, L. Zhan and W. Ni, Nanoscale, 2014, 6, 14244–14253 RSC.
- J. Kumar, X. Wei, S. Barrow, A. M. Funston, K. G. Thomas and P. Mulvaney, Phys. Chem. Chem. Phys., 2013, 15, 4258 RSC.
- L. Tong, V. D. Miljković, P. Johansson and M. Käll, Nano Lett., 2011, 11, 4505–4508 CrossRef CAS PubMed.
- L. V. Brown, H. Sobhani, J. B. Lassiter, P. Nordlander and N. J. Halas, ACS Nano, 2010, 4, 819–832 CrossRef CAS PubMed.
- L. Shao, C. Fang, H. Chen, Y. C. Man, J. Wang and H.-Q. Lin, Nano Lett., 2012, 12, 1424–1430 CrossRef CAS PubMed.
- D. A. Walker, C. E. Wilmer, B. Kowalczyk, K. J. M. Bishop and B. A. Grzybowski, Nano Lett., 2010, 10, 2275–2280 CrossRef CAS PubMed.
- S. Pothorszky, D. Zámbó, T. Deák and A. Deák, Nanoscale, 2016, 8, 3523–3529 RSC.
- Q. Chen, H. Cho, K. Manthiram, M. Yoshida, X. Ye and A. P. Alivisatos, ACS Cent. Sci., 2015, 1, 33–39 CrossRef CAS PubMed.
- S. F. Tan, U. Anand and U. Mirsaidov, ACS Nano, 2017, 11, 1633–1640 CrossRef CAS PubMed.
- T. Chen, Y. Hong and B. M. Reinhard, Nano Lett., 2015, 15, 5349–5357 CrossRef CAS PubMed.
- J. Turkevich, P. C. Stevenson and J. Hillier, Discuss. Faraday Soc., 1951, 11, 55 RSC.
- J. H. Yoon, J. Lim and S. Yoon, ACS Nano, 2012, 6, 7199–7208 CrossRef CAS PubMed.
- X. Ye, C. Zheng, J. Chen, Y. Gao and C. B. Murray, Nano Lett., 2013, 13, 765–771 CrossRef CAS PubMed.
- Z. Nie, D. Fava, E. Kumacheva, S. Zou, G. C. Walker and M. Rubinstein, Nat. Mater., 2007, 6, 609–614 CrossRef CAS PubMed.
- K. A. Sharp and B. Honig, J. Phys. Chem., 1990, 94, 7684–7692 CrossRef CAS.
- https://www.comsol.com/products/4.3a .
- A. Crut, P. Maioli, N. Del Fatti and F. Vallée, Chem. Soc. Rev., 2014, 43, 3921 RSC.
- S. Biswas, J. Duan, D. Nepal, K. Park, R. Pachter and R. A. Vaia, Nano Lett., 2013, 13, 6287–6291 CrossRef CAS PubMed.
- D. A. Walker, E. K. Leitsch, R. J. Nap, I. Szleifer and B. A. Grzybowski, Nat. Nanotechnol., 2013, 8, 676–681 CrossRef CAS PubMed.
- P. A. Kralchevsky and N. D. Denkov, Curr. Opin. Colloid Interface Sci., 2001, 6, 383–401 CrossRef CAS.
- B. Bilen, Y. Skarlatos, G. Aktas, M. N. Inci, T. Dispinar, M. M. Kose and A. Sanyal, J. Appl. Phys., 2007, 102, 73534 CrossRef.
- J. Prasad, I. Zins, R. Branscheid, J. Becker, A. H. R. Koch, G. Fytas, U. Kolb and C. Sönnichsen, J. Phys. Chem. C, 2015, 119, 5577–5582 CAS.
- T. Drobek, N. D. Spencer and M. Heuberger, Macromolecules, 2005, 38, 5254–5259 CrossRef CAS.
Footnote |
| † Electronic supplementary information (ESI) available. See DOI: 10.1039/c7nr02623d |
| This journal is © The Royal Society of Chemistry 2017 |